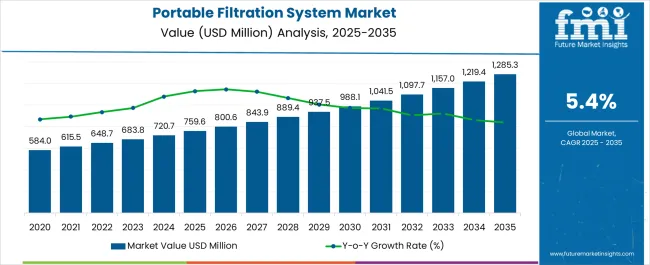
The portable filtration system market is set to progress at a CAGR of 5.4% through 2034. The market value is slated to increase from USD 720.7 million in 2024 to USD 1.2 billion by 2034.
Growth Drivers
Various industries make use of portable filtration systems to recycle the demand for the product. These industries include oil and gas, water power generation, and more.
Systematic Industrial Use
The sudden surge in simple structure, and convenient filtration systems for large-scale transportation sector worldwide. Escalating the need for water filtration in remote areas, the market is gaining potential in recent years. Spreading diseases due to waterborne pathogens is considered a significant market driver in the coming years. Also, a portable filtration system is gaining popularity in various industries to reduce the unwanted entries into several liquids which is required.
Clean Energy and Water Treatment
The demand for the portable filtration system in the power plants. Portable filtration systems help in the production of clean energy and water treatment. Moreover, sustainability concerns are contributing to the market. As people are becoming aware of the importance of reducing plastic waste and usage, the portable filtration system is gaining attention for providing an eco-friendly alternative to bottled water.
Attention toward outdoor recreational activities such as hiking, camping other activities. People are increasingly using portable filtration systems the filter water and other liquids. Characteristics and benefits such as lightweight and portability are getting the attention of the customers.
Technological Advances and Government Initiatives
Technological advancements are on the rise in developed countries. As manufacturers are heavily investing in the technologies. With a focus on the integration of the latest technologies in the systems to give convenience to their customers.
The government initiatives toward the promotion of sustainability and environmental concerns are leading the market growth further. After the implementation of government rules and regulations, there are significant possibilities for the market to gain traction in the coming years.
Emerging Healthcare systems and Oil and Gas Industries
Need for the clean air and water in the healthcare systems is amplifying lucrative opportunities in the market. Several governments are trying to provide a clean and healthy environment for their people thus, portable filtration systems are playing a major role in this.
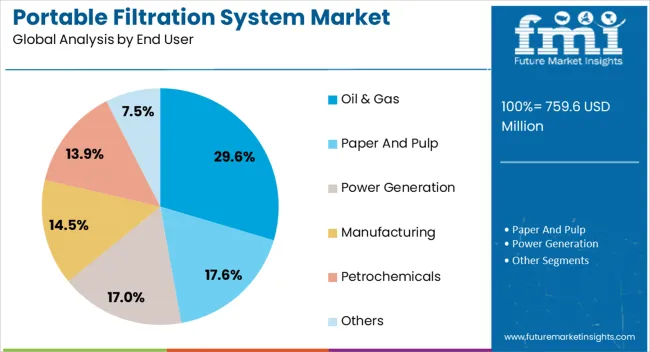
The use of portable filtration systems in oil and gas is expected to create significant opportunities in the market. Usage of this system in industries is reducing the money spent on lubricants and other facilities.
Attributes | Details |
---|---|
Portable Filtration System Market Size, 2024 | USD 720.7 million |
Forecast Market Size, 2034 | USD 1.2 billion |
Value-based CAGR (2024 to 2034) | 5.4% |
Attributes | Details |
---|---|
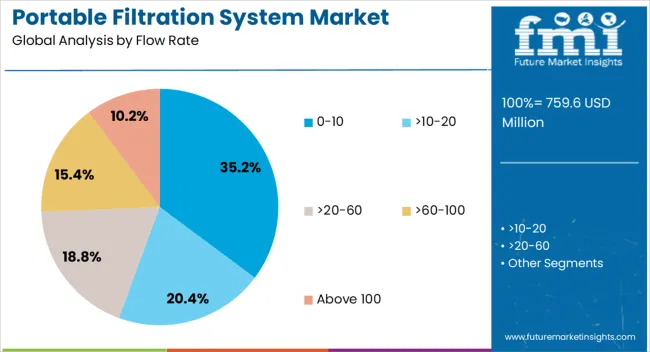
Top Flow Rate | 0-10 |
CAGR from 2024 to 2034 | 5.1% |
The 0-10 segment is leading the market growth during the forecast period owing to the increasing use in industrial areas. The popularity of small filtration systems has been gaining traction over the years. The need for a cost-effective portable filtration system is further contributing to the growth of the segment. The affordability and versatility is making them popular among consumers. As 0-10 flow rate is also suitable for the emergency situations such as on the go conditions and others.
Attributes | Details |
---|---|
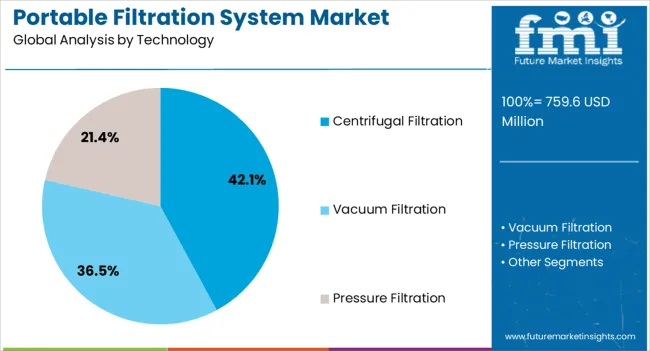
Top Solution | Centrifugal Filtration |
CAGR through 2034 | 4.9% |
The demand for removing high concentration of suspended solids in the industries is expected to create significant opportunities for market players. Having the compact size and portability is making centrifugal filtration system is an ideal choice among the consumers. Factors such as easy operating and maintaining making it popular choice in the market.
Countries | CAGR through 2024 to 2034 |
---|---|
United States | 5.7% |
China | 4.5% |
United kingdom | 6.6% |
Japan | 4.5% |
South Korea | 7.7% |
Escalating innovation and development has been observed in the United States. Several concerns regarding the filtration of oil, water, and others are contributing to the growth of the portable filtration system market.
Characteristics such as offering convenient and effective solutions to people who want to filter their water on the go, and portable filtration gaining popularity among the people in the United States. The need for water filtration in home and commercial settings in the United States.
The incidents regarding waterborne illness are on the rise in the United States owing to people demanding portable filtration systems for their safety and hygiene. Upsurge in activities such as hiking, camping, and backpacking in the United States.
The aging population in China. With easy use and portability of portable filtration systems getting much attention in China. Moreover, manufacturers are investing in the filtration system making them more accessible and easy to use.
A middle-class segment is seeking out high-quality products that improve the quality of the lifestyle in China. Thus, the portable filtration system is an emerging aspect of a healthy lifestyle in China. Furthermore, water scarcity is leading the market growth in China. Allowing the reuse of water from various sources, portable filtration systems gaining traction in China.
Government initiatives toward the promotion of portable water filtration in the United Kingdom drive demand for these systems. With the offering of several benefits including improvising water quality and ensuring access to safe drinking water, potable water filtration systems are emerging as an important aspect among consumers.
The sudden upsurge in outdoor recreation and travel is anticipated to create lucrative opportunities for the market in the United Kingdom. Moreover, sports activities and fitness activities are projected to gain the maximum share of the market in the region.
Japan is at the forefront of technological development and innovations among the nations. Several companies are developing innovative portable filtration systems for residential and commercial settings. Using advanced materials such as activated carbon and ceramic filters and other, Japanese portable filtration systems gaining popularity across the world.
The partnership and collaboration between companies for the development of innovative products have been seen in South Korea. Several companies are looking for the incorporation of advanced technologies to make their filters smarter, allowing better control of the filtration process through their smartphones or other devices in South Korea.
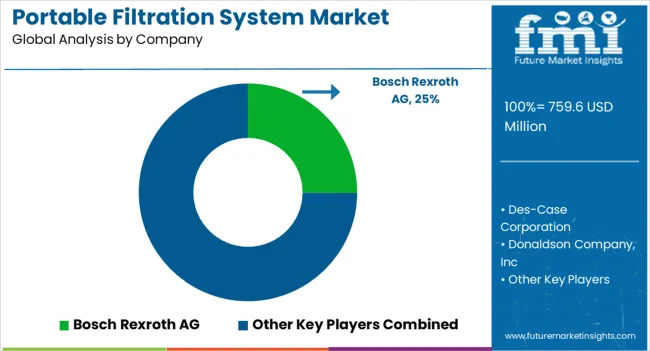
The market is seen in rapid development and evaluation. Several strategies are changing the market landscape by disrupting traditional asset management methods and introducing unique methods. Key players are investing in their tools to gain maximum market share in the market.
The market is anticipated to gain exponential growth during the forecast period owing to innovations and research. Many governments and governmental bodies are incorporating the manufacturers to boost their research and development activities. Manufacturers are looking to improvising consumer experience by implementing new marketing strategies.
Recent Developments
Table 1: Global Market Value (US$ Million) Forecast by Region, 2019 to 2034
Table 2: Global Market Volume (Units) Forecast by Region, 2019 to 2034
Table 3: Global Market Value (US$ Million) Forecast by Flow Rate, 2019 to 2034
Table 4: Global Market Volume (Units) Forecast by Flow Rate, 2019 to 2034
Table 5: Global Market Value (US$ Million) Forecast by Technology, 2019 to 2034
Table 6: Global Market Volume (Units) Forecast by Technology, 2019 to 2034
Table 7: Global Market Value (US$ Million) Forecast by End-User, 2019 to 2034
Table 8: Global Market Volume (Units) Forecast by End-User, 2019 to 2034
Table 9: North America Market Value (US$ Million) Forecast by Country, 2019 to 2034
Table 10: North America Market Volume (Units) Forecast by Country, 2019 to 2034
Table 11: North America Market Value (US$ Million) Forecast by Flow Rate, 2019 to 2034
Table 12: North America Market Volume (Units) Forecast by Flow Rate, 2019 to 2034
Table 13: North America Market Value (US$ Million) Forecast by Technology, 2019 to 2034
Table 14: North America Market Volume (Units) Forecast by Technology, 2019 to 2034
Table 15: North America Market Value (US$ Million) Forecast by End-User, 2019 to 2034
Table 16: North America Market Volume (Units) Forecast by End-User, 2019 to 2034
Table 17: Latin America Market Value (US$ Million) Forecast by Country, 2019 to 2034
Table 18: Latin America Market Volume (Units) Forecast by Country, 2019 to 2034
Table 19: Latin America Market Value (US$ Million) Forecast by Flow Rate, 2019 to 2034
Table 20: Latin America Market Volume (Units) Forecast by Flow Rate, 2019 to 2034
Table 21: Latin America Market Value (US$ Million) Forecast by Technology, 2019 to 2034
Table 22: Latin America Market Volume (Units) Forecast by Technology, 2019 to 2034
Table 23: Latin America Market Value (US$ Million) Forecast by End-User, 2019 to 2034
Table 24: Latin America Market Volume (Units) Forecast by End-User, 2019 to 2034
Table 25: Western Europe Market Value (US$ Million) Forecast by Country, 2019 to 2034
Table 26: Western Europe Market Volume (Units) Forecast by Country, 2019 to 2034
Table 27: Western Europe Market Value (US$ Million) Forecast by Flow Rate, 2019 to 2034
Table 28: Western Europe Market Volume (Units) Forecast by Flow Rate, 2019 to 2034
Table 29: Western Europe Market Value (US$ Million) Forecast by Technology, 2019 to 2034
Table 30: Western Europe Market Volume (Units) Forecast by Technology, 2019 to 2034
Table 31: Western Europe Market Value (US$ Million) Forecast by End-User, 2019 to 2034
Table 32: Western Europe Market Volume (Units) Forecast by End-User, 2019 to 2034
Table 33: Eastern Europe Market Value (US$ Million) Forecast by Country, 2019 to 2034
Table 34: Eastern Europe Market Volume (Units) Forecast by Country, 2019 to 2034
Table 35: Eastern Europe Market Value (US$ Million) Forecast by Flow Rate, 2019 to 2034
Table 36: Eastern Europe Market Volume (Units) Forecast by Flow Rate, 2019 to 2034
Table 37: Eastern Europe Market Value (US$ Million) Forecast by Technology, 2019 to 2034
Table 38: Eastern Europe Market Volume (Units) Forecast by Technology, 2019 to 2034
Table 39: Eastern Europe Market Value (US$ Million) Forecast by End-User, 2019 to 2034
Table 40: Eastern Europe Market Volume (Units) Forecast by End-User, 2019 to 2034
Table 41: South Asia and Pacific Market Value (US$ Million) Forecast by Country, 2019 to 2034
Table 42: South Asia and Pacific Market Volume (Units) Forecast by Country, 2019 to 2034
Table 43: South Asia and Pacific Market Value (US$ Million) Forecast by Flow Rate, 2019 to 2034
Table 44: South Asia and Pacific Market Volume (Units) Forecast by Flow Rate, 2019 to 2034
Table 45: South Asia and Pacific Market Value (US$ Million) Forecast by Technology, 2019 to 2034
Table 46: South Asia and Pacific Market Volume (Units) Forecast by Technology, 2019 to 2034
Table 47: South Asia and Pacific Market Value (US$ Million) Forecast by End-User, 2019 to 2034
Table 48: South Asia and Pacific Market Volume (Units) Forecast by End-User, 2019 to 2034
Table 49: East Asia Market Value (US$ Million) Forecast by Country, 2019 to 2034
Table 50: East Asia Market Volume (Units) Forecast by Country, 2019 to 2034
Table 51: East Asia Market Value (US$ Million) Forecast by Flow Rate, 2019 to 2034
Table 52: East Asia Market Volume (Units) Forecast by Flow Rate, 2019 to 2034
Table 53: East Asia Market Value (US$ Million) Forecast by Technology, 2019 to 2034
Table 54: East Asia Market Volume (Units) Forecast by Technology, 2019 to 2034
Table 55: East Asia Market Value (US$ Million) Forecast by End-User, 2019 to 2034
Table 56: East Asia Market Volume (Units) Forecast by End-User, 2019 to 2034
Table 57: Middle East and Africa Market Value (US$ Million) Forecast by Country, 2019 to 2034
Table 58: Middle East and Africa Market Volume (Units) Forecast by Country, 2019 to 2034
Table 59: Middle East and Africa Market Value (US$ Million) Forecast by Flow Rate, 2019 to 2034
Table 60: Middle East and Africa Market Volume (Units) Forecast by Flow Rate, 2019 to 2034
Table 61: Middle East and Africa Market Value (US$ Million) Forecast by Technology, 2019 to 2034
Table 62: Middle East and Africa Market Volume (Units) Forecast by Technology, 2019 to 2034
Table 63: Middle East and Africa Market Value (US$ Million) Forecast by End-User, 2019 to 2034
Table 64: Middle East and Africa Market Volume (Units) Forecast by End-User, 2019 to 2034
Figure 1: Global Market Value (US$ Million) by Flow Rate, 2024 to 2034
Figure 2: Global Market Value (US$ Million) by Technology, 2024 to 2034
Figure 3: Global Market Value (US$ Million) by End-User, 2024 to 2034
Figure 4: Global Market Value (US$ Million) by Region, 2024 to 2034
Figure 5: Global Market Value (US$ Million) Analysis by Region, 2019 to 2034
Figure 6: Global Market Volume (Units) Analysis by Region, 2019 to 2034
Figure 7: Global Market Value Share (%) and BPS Analysis by Region, 2024 to 2034
Figure 8: Global Market Y-o-Y Growth (%) Projections by Region, 2024 to 2034
Figure 9: Global Market Value (US$ Million) Analysis by Flow Rate, 2019 to 2034
Figure 10: Global Market Volume (Units) Analysis by Flow Rate, 2019 to 2034
Figure 11: Global Market Value Share (%) and BPS Analysis by Flow Rate, 2024 to 2034
Figure 12: Global Market Y-o-Y Growth (%) Projections by Flow Rate, 2024 to 2034
Figure 13: Global Market Value (US$ Million) Analysis by Technology, 2019 to 2034
Figure 14: Global Market Volume (Units) Analysis by Technology, 2019 to 2034
Figure 15: Global Market Value Share (%) and BPS Analysis by Technology, 2024 to 2034
Figure 16: Global Market Y-o-Y Growth (%) Projections by Technology, 2024 to 2034
Figure 17: Global Market Value (US$ Million) Analysis by End-User, 2019 to 2034
Figure 18: Global Market Volume (Units) Analysis by End-User, 2019 to 2034
Figure 19: Global Market Value Share (%) and BPS Analysis by End-User, 2024 to 2034
Figure 20: Global Market Y-o-Y Growth (%) Projections by End-User, 2024 to 2034
Figure 21: Global Market Attractiveness by Flow Rate, 2024 to 2034
Figure 22: Global Market Attractiveness by Technology, 2024 to 2034
Figure 23: Global Market Attractiveness by End-User, 2024 to 2034
Figure 24: Global Market Attractiveness by Region, 2024 to 2034
Figure 25: North America Market Value (US$ Million) by Flow Rate, 2024 to 2034
Figure 26: North America Market Value (US$ Million) by Technology, 2024 to 2034
Figure 27: North America Market Value (US$ Million) by End-User, 2024 to 2034
Figure 28: North America Market Value (US$ Million) by Country, 2024 to 2034
Figure 29: North America Market Value (US$ Million) Analysis by Country, 2019 to 2034
Figure 30: North America Market Volume (Units) Analysis by Country, 2019 to 2034
Figure 31: North America Market Value Share (%) and BPS Analysis by Country, 2024 to 2034
Figure 32: North America Market Y-o-Y Growth (%) Projections by Country, 2024 to 2034
Figure 33: North America Market Value (US$ Million) Analysis by Flow Rate, 2019 to 2034
Figure 34: North America Market Volume (Units) Analysis by Flow Rate, 2019 to 2034
Figure 35: North America Market Value Share (%) and BPS Analysis by Flow Rate, 2024 to 2034
Figure 36: North America Market Y-o-Y Growth (%) Projections by Flow Rate, 2024 to 2034
Figure 37: North America Market Value (US$ Million) Analysis by Technology, 2019 to 2034
Figure 38: North America Market Volume (Units) Analysis by Technology, 2019 to 2034
Figure 39: North America Market Value Share (%) and BPS Analysis by Technology, 2024 to 2034
Figure 40: North America Market Y-o-Y Growth (%) Projections by Technology, 2024 to 2034
Figure 41: North America Market Value (US$ Million) Analysis by End-User, 2019 to 2034
Figure 42: North America Market Volume (Units) Analysis by End-User, 2019 to 2034
Figure 43: North America Market Value Share (%) and BPS Analysis by End-User, 2024 to 2034
Figure 44: North America Market Y-o-Y Growth (%) Projections by End-User, 2024 to 2034
Figure 45: North America Market Attractiveness by Flow Rate, 2024 to 2034
Figure 46: North America Market Attractiveness by Technology, 2024 to 2034
Figure 47: North America Market Attractiveness by End-User, 2024 to 2034
Figure 48: North America Market Attractiveness by Country, 2024 to 2034
Figure 49: Latin America Market Value (US$ Million) by Flow Rate, 2024 to 2034
Figure 50: Latin America Market Value (US$ Million) by Technology, 2024 to 2034
Figure 51: Latin America Market Value (US$ Million) by End-User, 2024 to 2034
Figure 52: Latin America Market Value (US$ Million) by Country, 2024 to 2034
Figure 53: Latin America Market Value (US$ Million) Analysis by Country, 2019 to 2034
Figure 54: Latin America Market Volume (Units) Analysis by Country, 2019 to 2034
Figure 55: Latin America Market Value Share (%) and BPS Analysis by Country, 2024 to 2034
Figure 56: Latin America Market Y-o-Y Growth (%) Projections by Country, 2024 to 2034
Figure 57: Latin America Market Value (US$ Million) Analysis by Flow Rate, 2019 to 2034
Figure 58: Latin America Market Volume (Units) Analysis by Flow Rate, 2019 to 2034
Figure 59: Latin America Market Value Share (%) and BPS Analysis by Flow Rate, 2024 to 2034
Figure 60: Latin America Market Y-o-Y Growth (%) Projections by Flow Rate, 2024 to 2034
Figure 61: Latin America Market Value (US$ Million) Analysis by Technology, 2019 to 2034
Figure 62: Latin America Market Volume (Units) Analysis by Technology, 2019 to 2034
Figure 63: Latin America Market Value Share (%) and BPS Analysis by Technology, 2024 to 2034
Figure 64: Latin America Market Y-o-Y Growth (%) Projections by Technology, 2024 to 2034
Figure 65: Latin America Market Value (US$ Million) Analysis by End-User, 2019 to 2034
Figure 66: Latin America Market Volume (Units) Analysis by End-User, 2019 to 2034
Figure 67: Latin America Market Value Share (%) and BPS Analysis by End-User, 2024 to 2034
Figure 68: Latin America Market Y-o-Y Growth (%) Projections by End-User, 2024 to 2034
Figure 69: Latin America Market Attractiveness by Flow Rate, 2024 to 2034
Figure 70: Latin America Market Attractiveness by Technology, 2024 to 2034
Figure 71: Latin America Market Attractiveness by End-User, 2024 to 2034
Figure 72: Latin America Market Attractiveness by Country, 2024 to 2034
Figure 73: Western Europe Market Value (US$ Million) by Flow Rate, 2024 to 2034
Figure 74: Western Europe Market Value (US$ Million) by Technology, 2024 to 2034
Figure 75: Western Europe Market Value (US$ Million) by End-User, 2024 to 2034
Figure 76: Western Europe Market Value (US$ Million) by Country, 2024 to 2034
Figure 77: Western Europe Market Value (US$ Million) Analysis by Country, 2019 to 2034
Figure 78: Western Europe Market Volume (Units) Analysis by Country, 2019 to 2034
Figure 79: Western Europe Market Value Share (%) and BPS Analysis by Country, 2024 to 2034
Figure 80: Western Europe Market Y-o-Y Growth (%) Projections by Country, 2024 to 2034
Figure 81: Western Europe Market Value (US$ Million) Analysis by Flow Rate, 2019 to 2034
Figure 82: Western Europe Market Volume (Units) Analysis by Flow Rate, 2019 to 2034
Figure 83: Western Europe Market Value Share (%) and BPS Analysis by Flow Rate, 2024 to 2034
Figure 84: Western Europe Market Y-o-Y Growth (%) Projections by Flow Rate, 2024 to 2034
Figure 85: Western Europe Market Value (US$ Million) Analysis by Technology, 2019 to 2034
Figure 86: Western Europe Market Volume (Units) Analysis by Technology, 2019 to 2034
Figure 87: Western Europe Market Value Share (%) and BPS Analysis by Technology, 2024 to 2034
Figure 88: Western Europe Market Y-o-Y Growth (%) Projections by Technology, 2024 to 2034
Figure 89: Western Europe Market Value (US$ Million) Analysis by End-User, 2019 to 2034
Figure 90: Western Europe Market Volume (Units) Analysis by End-User, 2019 to 2034
Figure 91: Western Europe Market Value Share (%) and BPS Analysis by End-User, 2024 to 2034
Figure 92: Western Europe Market Y-o-Y Growth (%) Projections by End-User, 2024 to 2034
Figure 93: Western Europe Market Attractiveness by Flow Rate, 2024 to 2034
Figure 94: Western Europe Market Attractiveness by Technology, 2024 to 2034
Figure 95: Western Europe Market Attractiveness by End-User, 2024 to 2034
Figure 96: Western Europe Market Attractiveness by Country, 2024 to 2034
Figure 97: Eastern Europe Market Value (US$ Million) by Flow Rate, 2024 to 2034
Figure 98: Eastern Europe Market Value (US$ Million) by Technology, 2024 to 2034
Figure 99: Eastern Europe Market Value (US$ Million) by End-User, 2024 to 2034
Figure 100: Eastern Europe Market Value (US$ Million) by Country, 2024 to 2034
Figure 101: Eastern Europe Market Value (US$ Million) Analysis by Country, 2019 to 2034
Figure 102: Eastern Europe Market Volume (Units) Analysis by Country, 2019 to 2034
Figure 103: Eastern Europe Market Value Share (%) and BPS Analysis by Country, 2024 to 2034
Figure 104: Eastern Europe Market Y-o-Y Growth (%) Projections by Country, 2024 to 2034
Figure 105: Eastern Europe Market Value (US$ Million) Analysis by Flow Rate, 2019 to 2034
Figure 106: Eastern Europe Market Volume (Units) Analysis by Flow Rate, 2019 to 2034
Figure 107: Eastern Europe Market Value Share (%) and BPS Analysis by Flow Rate, 2024 to 2034
Figure 108: Eastern Europe Market Y-o-Y Growth (%) Projections by Flow Rate, 2024 to 2034
Figure 109: Eastern Europe Market Value (US$ Million) Analysis by Technology, 2019 to 2034
Figure 110: Eastern Europe Market Volume (Units) Analysis by Technology, 2019 to 2034
Figure 111: Eastern Europe Market Value Share (%) and BPS Analysis by Technology, 2024 to 2034
Figure 112: Eastern Europe Market Y-o-Y Growth (%) Projections by Technology, 2024 to 2034
Figure 113: Eastern Europe Market Value (US$ Million) Analysis by End-User, 2019 to 2034
Figure 114: Eastern Europe Market Volume (Units) Analysis by End-User, 2019 to 2034
Figure 115: Eastern Europe Market Value Share (%) and BPS Analysis by End-User, 2024 to 2034
Figure 116: Eastern Europe Market Y-o-Y Growth (%) Projections by End-User, 2024 to 2034
Figure 117: Eastern Europe Market Attractiveness by Flow Rate, 2024 to 2034
Figure 118: Eastern Europe Market Attractiveness by Technology, 2024 to 2034
Figure 119: Eastern Europe Market Attractiveness by End-User, 2024 to 2034
Figure 120: Eastern Europe Market Attractiveness by Country, 2024 to 2034
Figure 121: South Asia and Pacific Market Value (US$ Million) by Flow Rate, 2024 to 2034
Figure 122: South Asia and Pacific Market Value (US$ Million) by Technology, 2024 to 2034
Figure 123: South Asia and Pacific Market Value (US$ Million) by End-User, 2024 to 2034
Figure 124: South Asia and Pacific Market Value (US$ Million) by Country, 2024 to 2034
Figure 125: South Asia and Pacific Market Value (US$ Million) Analysis by Country, 2019 to 2034
Figure 126: South Asia and Pacific Market Volume (Units) Analysis by Country, 2019 to 2034
Figure 127: South Asia and Pacific Market Value Share (%) and BPS Analysis by Country, 2024 to 2034
Figure 128: South Asia and Pacific Market Y-o-Y Growth (%) Projections by Country, 2024 to 2034
Figure 129: South Asia and Pacific Market Value (US$ Million) Analysis by Flow Rate, 2019 to 2034
Figure 130: South Asia and Pacific Market Volume (Units) Analysis by Flow Rate, 2019 to 2034
Figure 131: South Asia and Pacific Market Value Share (%) and BPS Analysis by Flow Rate, 2024 to 2034
Figure 132: South Asia and Pacific Market Y-o-Y Growth (%) Projections by Flow Rate, 2024 to 2034
Figure 133: South Asia and Pacific Market Value (US$ Million) Analysis by Technology, 2019 to 2034
Figure 134: South Asia and Pacific Market Volume (Units) Analysis by Technology, 2019 to 2034
Figure 135: South Asia and Pacific Market Value Share (%) and BPS Analysis by Technology, 2024 to 2034
Figure 136: South Asia and Pacific Market Y-o-Y Growth (%) Projections by Technology, 2024 to 2034
Figure 137: South Asia and Pacific Market Value (US$ Million) Analysis by End-User, 2019 to 2034
Figure 138: South Asia and Pacific Market Volume (Units) Analysis by End-User, 2019 to 2034
Figure 139: South Asia and Pacific Market Value Share (%) and BPS Analysis by End-User, 2024 to 2034
Figure 140: South Asia and Pacific Market Y-o-Y Growth (%) Projections by End-User, 2024 to 2034
Figure 141: South Asia and Pacific Market Attractiveness by Flow Rate, 2024 to 2034
Figure 142: South Asia and Pacific Market Attractiveness by Technology, 2024 to 2034
Figure 143: South Asia and Pacific Market Attractiveness by End-User, 2024 to 2034
Figure 144: South Asia and Pacific Market Attractiveness by Country, 2024 to 2034
Figure 145: East Asia Market Value (US$ Million) by Flow Rate, 2024 to 2034
Figure 146: East Asia Market Value (US$ Million) by Technology, 2024 to 2034
Figure 147: East Asia Market Value (US$ Million) by End-User, 2024 to 2034
Figure 148: East Asia Market Value (US$ Million) by Country, 2024 to 2034
Figure 149: East Asia Market Value (US$ Million) Analysis by Country, 2019 to 2034
Figure 150: East Asia Market Volume (Units) Analysis by Country, 2019 to 2034
Figure 151: East Asia Market Value Share (%) and BPS Analysis by Country, 2024 to 2034
Figure 152: East Asia Market Y-o-Y Growth (%) Projections by Country, 2024 to 2034
Figure 153: East Asia Market Value (US$ Million) Analysis by Flow Rate, 2019 to 2034
Figure 154: East Asia Market Volume (Units) Analysis by Flow Rate, 2019 to 2034
Figure 155: East Asia Market Value Share (%) and BPS Analysis by Flow Rate, 2024 to 2034
Figure 156: East Asia Market Y-o-Y Growth (%) Projections by Flow Rate, 2024 to 2034
Figure 157: East Asia Market Value (US$ Million) Analysis by Technology, 2019 to 2034
Figure 158: East Asia Market Volume (Units) Analysis by Technology, 2019 to 2034
Figure 159: East Asia Market Value Share (%) and BPS Analysis by Technology, 2024 to 2034
Figure 160: East Asia Market Y-o-Y Growth (%) Projections by Technology, 2024 to 2034
Figure 161: East Asia Market Value (US$ Million) Analysis by End-User, 2019 to 2034
Figure 162: East Asia Market Volume (Units) Analysis by End-User, 2019 to 2034
Figure 163: East Asia Market Value Share (%) and BPS Analysis by End-User, 2024 to 2034
Figure 164: East Asia Market Y-o-Y Growth (%) Projections by End-User, 2024 to 2034
Figure 165: East Asia Market Attractiveness by Flow Rate, 2024 to 2034
Figure 166: East Asia Market Attractiveness by Technology, 2024 to 2034
Figure 167: East Asia Market Attractiveness by End-User, 2024 to 2034
Figure 168: East Asia Market Attractiveness by Country, 2024 to 2034
Figure 169: Middle East and Africa Market Value (US$ Million) by Flow Rate, 2024 to 2034
Figure 170: Middle East and Africa Market Value (US$ Million) by Technology, 2024 to 2034
Figure 171: Middle East and Africa Market Value (US$ Million) by End-User, 2024 to 2034
Figure 172: Middle East and Africa Market Value (US$ Million) by Country, 2024 to 2034
Figure 173: Middle East and Africa Market Value (US$ Million) Analysis by Country, 2019 to 2034
Figure 174: Middle East and Africa Market Volume (Units) Analysis by Country, 2019 to 2034
Figure 175: Middle East and Africa Market Value Share (%) and BPS Analysis by Country, 2024 to 2034
Figure 176: Middle East and Africa Market Y-o-Y Growth (%) Projections by Country, 2024 to 2034
Figure 177: Middle East and Africa Market Value (US$ Million) Analysis by Flow Rate, 2019 to 2034
Figure 178: Middle East and Africa Market Volume (Units) Analysis by Flow Rate, 2019 to 2034
Figure 179: Middle East and Africa Market Value Share (%) and BPS Analysis by Flow Rate, 2024 to 2034
Figure 180: Middle East and Africa Market Y-o-Y Growth (%) Projections by Flow Rate, 2024 to 2034
Figure 181: Middle East and Africa Market Value (US$ Million) Analysis by Technology, 2019 to 2034
Figure 182: Middle East and Africa Market Volume (Units) Analysis by Technology, 2019 to 2034
Figure 183: Middle East and Africa Market Value Share (%) and BPS Analysis by Technology, 2024 to 2034
Figure 184: Middle East and Africa Market Y-o-Y Growth (%) Projections by Technology, 2024 to 2034
Figure 185: Middle East and Africa Market Value (US$ Million) Analysis by End-User, 2019 to 2034
Figure 186: Middle East and Africa Market Volume (Units) Analysis by End-User, 2019 to 2034
Figure 187: Middle East and Africa Market Value Share (%) and BPS Analysis by End-User, 2024 to 2034
Figure 188: Middle East and Africa Market Y-o-Y Growth (%) Projections by End-User, 2024 to 2034
Figure 189: Middle East and Africa Market Attractiveness by Flow Rate, 2024 to 2034
Figure 190: Middle East and Africa Market Attractiveness by Technology, 2024 to 2034
Figure 191: Middle East and Africa Market Attractiveness by End-User, 2024 to 2034
Figure 192: Middle East and Africa Market Attractiveness by Country, 2024 to 2034
The CAGR of the portable filtration market in the United States is estimated to be 5.7% through 2034.
The portable filtration system market is expected to grow at a CAGR of 5.4% over the forecast period.
The market size is expected to be worth USD 720.7 million in 2024.
The CAGR of the market in China is estimated to be 6.2% from 2024 to 2034.
The market is estimated to get as big as USD 1.2 billion by 2034.
The portable filtration system market can be divided into the following segments: flow rate and technology.
Explore Similar Insights
Thank you!
You will receive an email from our Business Development Manager. Please be sure to check your SPAM/JUNK folder too.