The global pre-made pouch packaging market is valued at USD 12,456 million in 2025 and is set to reach USD 23,163 million by 2035, growing at a CAGR of 6.4%. The market stands at the forefront of a transformative decade that promises to redefine flexible packaging infrastructure and convenience-driven consumption excellence across food processing, beverage manufacturing, personal care, and pharmaceutical sectors. The market's journey from USD 12,456 million in 2025 to USD 23,163 million by 2035 represents substantial growth, demonstrating the accelerating adoption of lightweight packaging solutions and sophisticated barrier protection systems across retail shelving, e-commerce distribution, quick-service restaurants, and consumer goods applications.
The first half of the decade (2025-2030) will witness the market climbing from USD 12,456 million to approximately USD 16,842 million, adding USD 4,386 million in value, which constitutes 41% of the total forecast growth period. This phase will be characterized by the rapid adoption of ready-to-fill pouch systems, driven by increasing demand for convenience packaging solutions and enhanced shelf appeal requirements worldwide. Superior moisture barrier capabilities and resealable closure features will become standard expectations rather than premium options.
The latter half (2030-2035) will witness sustained growth from USD 16,842 million to USD 23,163 million, representing an addition of USD 6,345 million or 59% of the decade's expansion. This period will be defined by mass market penetration of specialized pouch formats, integration with comprehensive filling automation platforms, and seamless compatibility with existing packaging and distribution infrastructure. The market trajectory signals fundamental shifts in how food manufacturers and brand owners approach flexible packaging solutions, with participants positioned to benefit from sustained demand across multiple application segments.
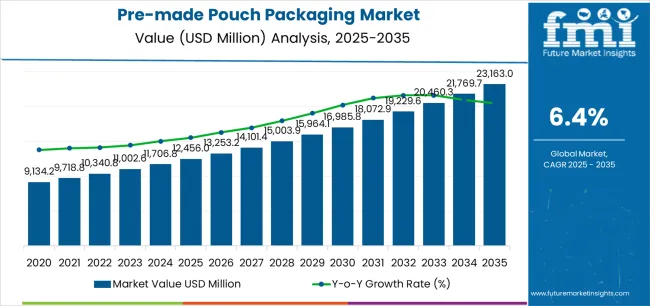
The pre-made pouch packaging market demonstrates distinct growth phases with varying market characteristics and competitive dynamics. Between 2025 and 2030, the market progresses through its convenience packaging adoption phase, expanding from USD 12,456 million to USD 16,842 million with steady annual increments averaging 6.2% growth. This period showcases the transition from basic three-side seal pouches to advanced systems with enhanced barrier properties and integrated zipper closures becoming mainstream features.
The 2025-2030 phase adds USD 4,386 million to market value, representing 41% of total decade expansion. Market maturation factors include standardization of pouch specifications, declining material costs for specialty laminates, and increasing brand owner awareness of pouch benefits reaching 75-80% effectiveness in retail applications. Competitive landscape evolution during this period features established converters like Amcor and Mondi expanding their product portfolios while new entrants focus on specialized spout pouch solutions and enhanced reclosability technology.
From 2030 to 2035, market dynamics shift toward advanced customization and multi-sector deployment, with growth accelerating from USD 16,842 million to USD 23,163 million, adding USD 6,345 million or 59% of total expansion. This phase transition logic centers on universal pouch systems, integration with automated filling equipment, and deployment across diverse application scenarios, becoming standard rather than specialized packaging formats. The competitive environment matures with focus shifting from basic pouch quality to comprehensive barrier performance and compatibility with high-speed production operations.
| Metric | Value |
|---|---|
| Market Value (2025) | USD 12,456 million |
| Market Forecast (2035) | USD 23,163 million |
| Growth Rate | 6.40% CAGR |
| Leading Pouch Type | Stand-up Pouches |
| Primary Application | Food & Beverage Segment |
The market demonstrates strong fundamentals with stand-up pouch systems capturing a dominant share through superior shelf presence and space-efficient storage capabilities. Food & beverage applications drive primary demand, supported by increasing consumer preference for convenient packaging and product freshness management solutions. Geographic expansion remains concentrated in developed markets with established retail infrastructure, while emerging economies show accelerating adoption rates driven by modern trade expansion and rising disposable incomes.
The pre-made pouch packaging market represents a compelling intersection of flexible packaging innovation, barrier technology enhancement, and convenience management. With robust growth projected from USD 12,456 million in 2025 to USD 23,163 million by 2035 at a 6.40% CAGR, this market is driven by increasing consumer demand for convenient packaging, retail shelf optimization requirements, and commercial demand for lightweight transport formats.
The market's expansion reflects a fundamental shift in how food manufacturers and brand owners approach flexible packaging infrastructure. Strong growth opportunities exist across diverse applications, from food processing operations requiring extended shelf life to beverage companies demanding spouted pouch solutions. Geographic expansion is particularly pronounced in Asia-Pacific markets, led by China (7.2% CAGR) and India (6.9% CAGR), while established markets in North America and Europe drive innovation and specialized segment development.
The dominance of stand-up pouch systems and food & beverage applications underscores the importance of proven barrier technology and retail appeal in driving adoption. Filling line compatibility and material cost optimization remain key challenges, creating opportunities for companies that can deliver reliable performance while maintaining economic efficiency.
Market expansion rests on three fundamental shifts driving adoption across food processing and consumer goods sectors. 1. Convenience demand creates compelling advantages through pouch systems that provide lightweight portability with space-efficient storage, enabling consumers to transport products easily while maintaining freshness and justifying premium pricing over rigid containers. 2. Retail optimization accelerates as brand owners worldwide seek differentiated packaging solutions that deliver shelf appeal directly to purchase decision points, enabling product visibility that aligns with marketing strategies and captures consumer attention. 3. Supply chain efficiency drives adoption from manufacturers requiring packaging solutions that maximize transportation density while minimizing material usage during distribution and logistics operations.
However, growth faces headwinds from filling equipment compatibility that differs across production facilities regarding speed capabilities and format versatility, potentially limiting conversion flexibility in high-volume manufacturing categories. Material complexity also persists regarding multi-layer laminate construction and recycling infrastructure that may increase operational costs in markets with demanding environmental regulations.
Primary Classification: The market segments by pouch type into stand-up pouches, flat pouches, spout pouches, zipper pouches, and retort pouches categories, representing the evolution from basic flexible bags to advanced resealable formats for comprehensive packaging operations.
Secondary Breakdown: Application segmentation divides the market into food & beverage, personal care & cosmetics, pharmaceuticals, pet food, household products, and others sectors, reflecting distinct requirements for barrier protection, convenience features, and shelf life extension.
Regional Classification: Geographic distribution covers North America, Europe, Asia Pacific, Latin America, and the Middle East & Africa, with developed markets leading innovation while emerging economies show accelerating growth patterns driven by modern retail expansion programs.
The segmentation structure reveals technology progression from standard three-side seal pouches toward integrated multi-functional platforms with enhanced barrier properties and reclosability capabilities, while application diversity spans from food processing operations to pharmaceutical facilities requiring comprehensive protection and user-friendly dispensing solutions.
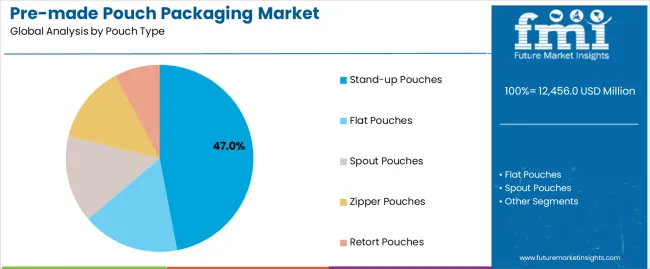
Stand-up pouch segment is estimated to account for 47% of the pre-made pouch packaging market share in 2025. The segment's leading position stems from its fundamental role as a critical component in retail shelf presence applications and its extensive use across multiple food and beverage sectors. Stand-up pouch dominance is attributed to its superior display flexibility, including self-standing capability, bilateral graphics area, and consumer-friendly opening that make it indispensable for branded packaging operations.
Market Position: Stand-up pouch systems command the leading position in the pre-made pouch packaging market through advanced gusset technologies, including comprehensive bottom support options, zipper integration versatility, and reliable sealing performance that enable converters to deploy packaging solutions across diverse retail environments.
Value Drivers: The segment benefits from brand owner preference for proven shelf-stable formats that provide exceptional visibility without requiring dedicated display fixtures. Cost-effective material utilization enables deployment in snack packaging, beverage concentrate, and pet treat applications where retail presence and product protection represent critical selection requirements.
Competitive Advantages: Stand-up pouch systems differentiate through excellent merchandising performance, proven transportation durability, and compatibility with standard filling equipment that enhance brand appeal while maintaining economical production profiles suitable for diverse food and beverage applications.
Key market characteristics:
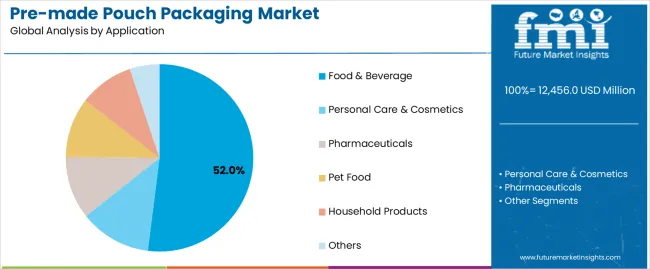
Food & beverage segment is projected to hold 52% of the pre-made pouch packaging market share in 2025. The segment's market leadership is driven by the extensive use of pre-made pouches in snack packaging, liquid beverage concentrates, sauce & condiment filling, and frozen food applications, where pouches serve as both a protection barrier and convenience tool. The food industry's consistent investment in flexible packaging materials supports the segment's dominant position.
Market Context: Food & beverage applications dominate the market due to widespread adoption of lightweight packaging materials and increasing focus on portion control management, shelf life extension, and consumer-friendly applications that enhance product freshness while maintaining cost efficiency.
Appeal Factors: Food manufacturers prioritize moisture barrier properties, seal integrity, and integration with filling line protocols that enable coordinated deployment across multiple production facilities. The segment benefits from substantial food safety requirements and retail standards that emphasize reliable packaging for ambient and refrigerated applications.
Growth Drivers: Convenience food trends incorporate pre-made pouches as standard packaging for single-serve portions and ready-to-eat meals. At the same time, beverage industry initiatives are increasing demand for spouted pouch systems that comply with FDA standards and enhance consumer convenience.
Market Challenges: Filling line modifications and equipment investments may limit adoption flexibility in legacy manufacturing facilities or specialized product categories.
Application dynamics include:
Growth Accelerators: Consumer convenience drives primary adoption as pouch systems provide exceptional portability capabilities that enable on-the-go consumption without excessive packaging waste, supporting lifestyle preferences and product accessibility that require lightweight packaging formats. E-commerce expansion accelerates market growth as online retailers seek damage-resistant packaging solutions that maintain product integrity during shipping while enhancing unboxing experiences through visually appealing pouch designs. Retail modernization increases worldwide, creating sustained demand for space-efficient packaging systems that complement shelf optimization and provide competitive advantages in crowded store environments.
Growth Inhibitors: Filling equipment limitations differ across manufacturing facilities regarding speed capabilities and format compatibility, which may restrict market penetration and production efficiency in high-volume categories with demanding throughput requirements. Material cost volatility persists regarding polymer resin pricing and specialty film availability that may increase production expenses in markets with fluctuating raw material costs. Market fragmentation across multiple pouch formats and barrier specifications creates compatibility concerns between different filling systems and existing packaging infrastructure.
Market Evolution Patterns: Adoption accelerates in food processing and personal care sectors where convenience packaging justifies material investments, with geographic concentration in developed markets transitioning toward mainstream adoption in emerging economies driven by modern retail expansion and consumer goods growth. Technology development focuses on enhanced barrier performance, improved zipper reliability, and integration with automated quality inspection systems that optimize production efficiency and consumer satisfaction. The market could face disruption if alternative flexible formats or technology innovations significantly challenge pouch advantages in food packaging applications.
The pre-made pouch packaging market demonstrates varied regional dynamics with Growth Leaders including China (7.2% CAGR) and India (6.9% CAGR) driving expansion through modern retail development and consumer goods modernization. Steady Performers encompass the USA (6.5% CAGR), Germany (6% CAGR), and Japan (5.7% CAGR), benefiting from established food processing sectors and convenience packaging adoption.
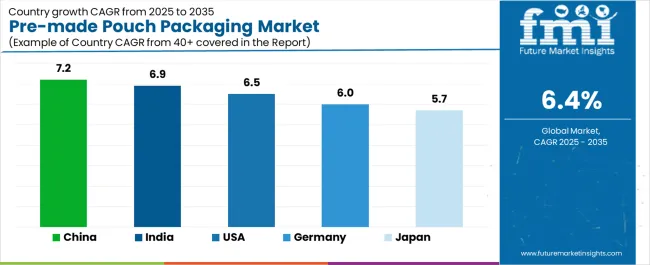
| Country | CAGR (2025-2035) |
|---|---|
| China | 7.2% |
| India | 6.9% |
| USA | 6.5% |
| Germany | 6% |
| Japan | 5.7% |
Regional synthesis reveals Asia-Pacific markets leading growth through retail expansion and packaged food consumption, while European countries maintain steady expansion supported by specialized organic food applications and premium product requirements. North American markets show strong growth driven by snack food innovation and beverage concentrate applications.
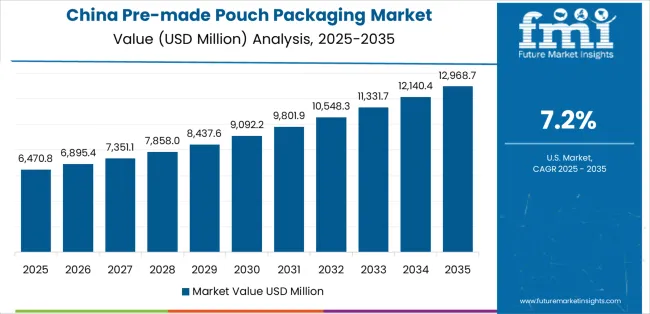
China establishes regional leadership through explosive e-commerce expansion and comprehensive consumer goods modernization, integrating advanced pouch packaging systems as standard components in snack food distribution and beverage concentrate applications. The country's 7.2% CAGR through 2035 reflects government initiatives promoting food safety standards and domestic manufacturing activity that mandate the use of barrier packaging systems in food operations. Growth concentrates in major urban regions, including Shanghai, Guangzhou, and Shenzhen, where food processors showcase integrated pouch systems that appeal to domestic consumers seeking convenience formats and international brand standards.
Chinese converters are developing innovative pouch solutions that combine local production advantages with international barrier specifications, including high-oxygen barrier and advanced printing capabilities.
Strategic Market Indicators:
The Indian market emphasizes food & beverage applications, including rapid modern retail development and comprehensive packaged food expansion that increasingly incorporates pre-made pouches for snack distribution and spice packaging applications. The country is projected to show a 6.9% CAGR through 2035, driven by massive urbanization under government infrastructure programs and commercial demand for affordable, hygienic packaging systems. Indian food manufacturers prioritize cost-effectiveness with pouches delivering product protection through economical material usage and efficient distribution capabilities.
Technology deployment channels include major food processors, FMCG companies, and regional brands that support high-volume usage for domestic and export applications.
Performance Metrics:
The USA market emphasizes advanced pouch features, including innovative zipper technologies and integration with comprehensive automated filling platforms that manage product dispensing, reclosure convenience, and shelf life extension through unified packaging systems. The country is projected to show a 6.5% CAGR through 2035, driven by snack food innovation under consumer preference shifts and commercial demand for convenient, portable packaging systems. American food brands prioritize consumer convenience with pouches delivering exceptional usability through ergonomic designs and resealable integration.
Technology deployment channels include major CPG companies, craft food producers, and beverage brands that support custom development for premium product operations.
Performance Metrics:
In Munich, Hamburg, and Frankfurt, German food manufacturers and packaging converters are implementing advanced pouch systems to enhance product protection capabilities and support retail presentation that aligns with quality protocols and environmental standards. The German market demonstrates sustained growth with a 6% CAGR through 2035, driven by organic food innovation programs and premium product investments that emphasize reliable packaging systems for natural and specialty applications. German food facilities are prioritizing pouch systems that provide exceptional barrier performance while maintaining compliance with packaging regulations and minimizing material usage, particularly important in organic snacks and premium beverage operations.
Market expansion benefits from retail quality programs that mandate protective packaging in product specifications, creating sustained demand across Germany's food processing and specialty goods sectors, where barrier integrity and material efficiency represent critical requirements.
Strategic Market Indicators:
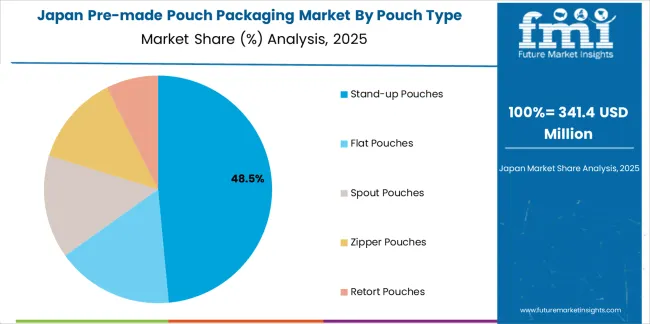
Japan's sophisticated food market demonstrates meticulous pouch deployment, growing at 5.7% CAGR, with documented operational excellence in convenience store distribution and premium product applications through integration with existing retail systems and quality assurance infrastructure. The country leverages engineering expertise in film technology and printing precision to maintain market leadership. Food processing centers, including Tokyo, Osaka, and Nagoya, showcase advanced installations where pouch systems integrate with comprehensive automated filling platforms and quality inspection systems to optimize production efficiency and consumer satisfaction.
Japanese food manufacturers prioritize packaging precision and material reliability in product development, creating demand for premium pouch systems with advanced features, including transparent windows and integration with microwave-safe constructions. The market benefits from established retail infrastructure and willingness to invest in specialized packaging technologies that provide superior freshness protection and regulatory compliance.
Market Intelligence Brief:
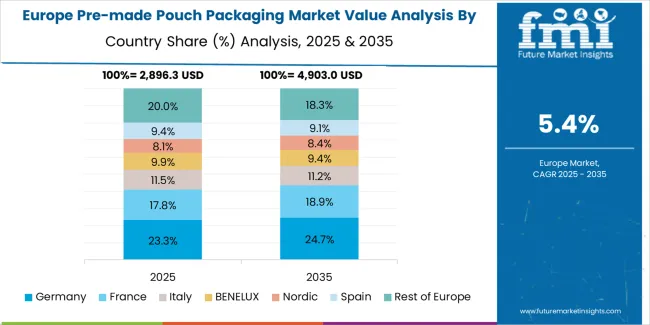
The pre-made pouch packaging market in Europe is projected to grow from USD 3,178 million in 2025 to USD 5,246 million by 2035, registering a CAGR of 5.1% over the forecast period. Germany is expected to maintain its leadership position with a 38.2% market share in 2025, declining slightly to 37.8% by 2035, supported by its food processing excellence and major manufacturing centers, including Bavaria and North Rhine-Westphalia.
France follows with a 26.3% share in 2025, projected to reach 26.7% by 2035, driven by comprehensive gourmet food packaging and premium beverage initiatives. The United Kingdom holds a 18.4% share in 2025, expected to maintain 18.7% by 2035 through established snack food sectors and convenience retail adoption. Italy commands an 9.7% share, while Spain accounts for 6.2% in 2025. The Rest of Europe region is anticipated to gain momentum, expanding its collective share from 1.2% to 1.5% by 2035, attributed to increasing modern retail development in Eastern European countries and emerging Scandinavian food brands implementing flexible packaging programs.
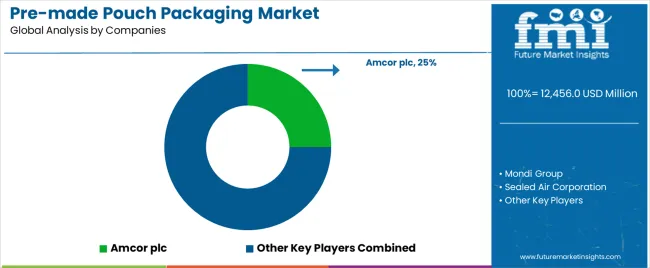
The pre-made pouch packaging market operates with moderate concentration, featuring approximately 22-30 participants, where leading companies control roughly 38-45% of the global market share through established converter networks and comprehensive format capabilities. Competition emphasizes barrier performance, seal reliability, and printing quality rather than price-based rivalry.
Market leaders encompass Amcor plc, Mondi Group, and Sealed Air Corporation, which maintain competitive advantages through extensive converting expertise, global manufacturing networks, and comprehensive technical support capabilities that create brand loyalty and support filling line requirements. These companies leverage decades of flexible packaging experience and ongoing lamination technology investments to develop advanced pouch systems with exceptional protection and convenience features.
Specialty challengers include Sonoco Products Company, Coveris Holdings, and ProAmpac, which compete through specialized barrier film focus and innovative closure solutions that appeal to food manufacturers seeking extended shelf life formats and custom printing flexibility. These companies differentiate through material engineering emphasis and specialized application focus.
Market dynamics favor participants that combine reliable sealing performance with advanced graphics support, including rotogravure printing and digital decoration capabilities. Competitive pressure intensifies as traditional rigid packaging manufacturers expand into flexible formats. At the same time, specialized film converters challenge established players through innovative barrier solutions and cost-effective production targeting emerging food segments.
| Item | Value |
|---|---|
| Quantitative Units | USD 12,456 million |
| Pouch Type | Stand-up Pouches, Flat Pouches, Spout Pouches, Zipper Pouches, Retort Pouches |
| Application | Food & Beverage, Personal Care & Cosmetics, Pharmaceuticals, Pet Food, Household Products, Others |
| Regions Covered | North America, Europe, Asia Pacific, Latin America, Middle East & Africa |
| Countries Covered | USA, Germany, Japan, China, India, and 25+ additional countries |
| Key Companies Profiled | Amcor plc, Mondi Group, Sealed Air Corporation, Sonoco Products Company, Coveris Holdings, ProAmpac |
| Additional Attributes | Dollar sales by pouch type and application categories, regional adoption trends across North America, Europe, and Asia-Pacific, competitive landscape with flexible packaging converters and material suppliers, brand owner preferences for barrier performance and convenience excellence, integration with automated filling equipment and inspection systems, innovations in lamination technology and closure construction, and development of specialized packaging solutions with enhanced shelf life and consumer usability capabilities |
The global pre-made pouch packaging market is estimated to be valued at USD 12,456.0 million in 2025.
The market size for the pre-made pouch packaging market is projected to reach USD 23,163.0 million by 2035.
The pre-made pouch packaging market is expected to grow at a 6.4% CAGR between 2025 and 2035.
The key product types in pre-made pouch packaging market are stand-up pouches, flat pouches, spout pouches, zipper pouches and retort pouches.
In terms of application, food & beverage segment to command 52.0% share in the pre-made pouch packaging market in 2025.


Full Research Suite comprises of:
Market outlook & trends analysis
Interviews & case studies
Strategic recommendations
Vendor profiles & capabilities analysis
5-year forecasts
8 regions and 60+ country-level data splits
Market segment data splits
12 months of continuous data updates
DELIVERED AS:
PDF EXCEL ONLINE
Industry Share & Competitive Positioning in Pre-Made Pouch Packaging
Automatic Pre-made Pouch Packaging Machine Market
Pouch Tapes Market Size and Share Forecast Outlook 2025 to 2035
Pouch Filler Market Analysis - Size, Share, & Forecast Outlook 2025 to 2035
Pouch Equipment Market Growth – Demand, Trends & Outlook 2025 to 2035
Pouch Film Market Trends & Industry Growth Forecast 2024-2034
Pouch Market Insights – Growth & Trends 2024-2034
Pouch Sealing Machine Market
Pouch Dispensing Fitment Market
Pouch Packaging Market Size and Share Forecast Outlook 2025 to 2035
Pouch Packaging Machines Market Size and Share Forecast Outlook 2025 to 2035
Pouch-Bowl Packaging Market Size and Share Forecast Outlook 2025 to 2035
Arm Pouches Market Size and Share Forecast Outlook 2025 to 2035
Box Pouch Market by Pouch Type from 2025 to 2035
Competitive Breakdown of Box Pouch Providers
OPP Pouches Market Trends - Growth, Demand & Forecast 2024 to 2034
PCR Pouches Market
Doy Pouch Packaging Market
Foam Pouch Market Analysis - Demand, Size & Industry Outlook 2025 to 2035
Peel Pouches Market

Thank you!
You will receive an email from our Business Development Manager. Please be sure to check your SPAM/JUNK folder too.
Chat With
MaRIA