

- Market Size (2026)
- USD 4860.7 Mn
- Forecast (2036)
- USD 8461.5 Mn
- CAGR (2026 to 2036)
- 5.7%
How big is the Prestressing Steel Strands Market in 2026?
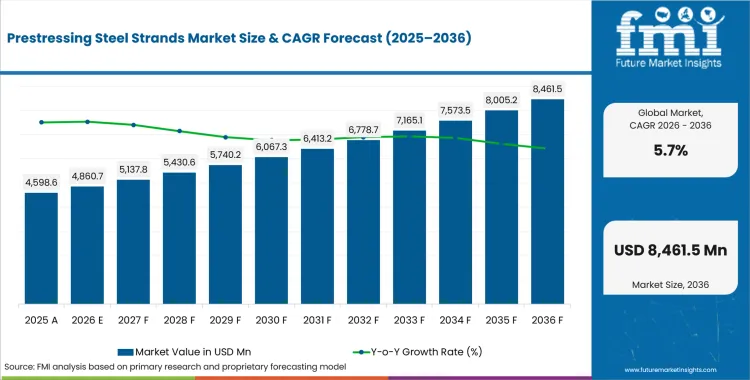
USD 4,860.7 million in 2026 and USD 8,461.5 million by 2036 at a 5.7% CAGR.
Sales of prestressing steel strands are estimated to rise at 5.7% CAGR through 2036, increasing valuation from USD 4,860.7 million in 2026 to USD 8,461.5 million by 2036. Prestressing steel strands are shifting from routine reinforcement inputs into specification-led materials used to protect span performance and project approval. Contractors evaluate tensile strength and mill documentation before strands enter bridge, building and precast programs. World Steel Association reported total world crude steel production at 1,849.4 Mt in 2025, giving strand suppliers a large steel base for wire-rod planning and conversion programs.
India accounts are expected to favor strand suppliers with highway project readiness and mill-backed delivery records. China accounts are projected to value transport construction scale along with steady wire-rod conversion support. Concrete construction keeps strand demand linked to bridge renewal and precast element production. USA Geological Survey reported estimated cement shipments of 100 million tons valued at USD 17 billion in 2025, showing the scale of concrete-linked material demand. Strand suppliers gain attention once product records support stress transfer and repeatable project execution.
Buyer review is guided by public construction spending and highway work requiring durable concrete structures. USA Census Bureau estimated April 2026 construction spending at a seasonally adjusted annual rate of USD 2,172.4 billion, with public construction at USD 532.7 billion and highway construction at USD 149.6 billion. Such spending levels support strand demand across precast systems and infrastructure assets requiring documented reinforcement quality.
Key Takeaways
-
Demand for prestressing steel strands is driven by contractors' need for span performance across precast members and post-tensioned concrete work, along with engineers' requirements for material files supporting design review.
-
By sales channel, direct mill supply is expected to lead with 58.5% share in 2026, backed by specification support and supplier accountability.
-
The 9.5-12.7 mm diameter range is the dominant diameter segment, projected to hold 46.0% share in 2026, reflecting its common use across precast and bridge applications.
-
Infrastructure is estimated to lead the end-use category with 40.6% share in 2026, driven by corridor and public concrete asset work.
-
Direct technical support and batch documentation carry higher value as public owners demand clearer accountability and relaxation performance records across concrete structures.
-
India and China are expected to form the higher-growth country tier, advancing at 7.9% and 6.9% CAGR respectively by 2036, supported by highway corridor expansion and transport investment.
-
Competition centers on Insteel Industries, Bekaert, Tata Steel, Kiswire, Usha Martin, Sumiden Wire, Hengxing, Fapricela, DWK Drahtwerk Koeln, and Siam Industrial Wire, with vendors differentiating through strand quality, project documentation, and mill-ready supply support.
Analyst Perspective
"The prestressing steel strands market is increasingly driven by proven performance in demanding construction applications rather than material specifications alone. Infrastructure developers and precast manufacturers are favoring suppliers that provide verified mechanical performance, comprehensive quality documentation, and dependable project support. Companies that assist customers throughout specification, installation, and execution are better positioned to secure approvals and strengthen their presence in long-term infrastructure projects."
- Nikhil Kaitwade, Principal Consultant for Industrial Automation at Future Market Insights
How is the Prestressing Steel Strands Market segmented?
The prestressing steel strands industry is segmented by strand type, diameter, application, end use, sales channel and region.
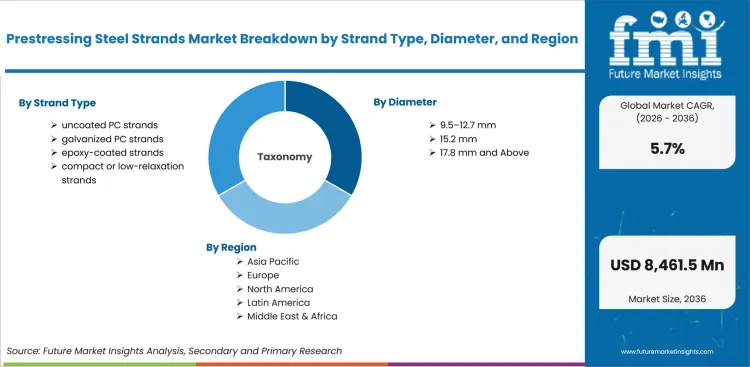
The prestressing steel strands are segmented by strand type, diameter, application, end use, sales channel and region. By strand type, coverage includes uncoated PC strands, galvanized PC strands, epoxy-coated strands and compact or low-relaxation strands. By diameter, coverage includes 9.5-12.7 mm, 15.2 mm and 17.8 mm and above. By application, coverage includes bridges, buildings, railway sleepers and precast concrete products. By end use, coverage includes infrastructure, commercial construction, industrial projects and energy or utilities. By sales channel, coverage includes direct mill supply, distributors and precast or contractor supply, with regional coverage across North America, Latin America, Europe, East Asia, South Asia and Pacific and the Middle East and Africa.
How does direct mill supply influence buying within the sales channel segment?
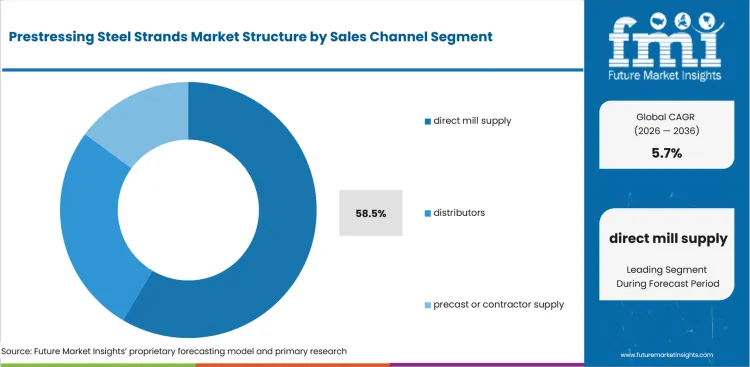
Direct mill supply influences prestressing steel strand buying as quality files and order continuity attach directly to project approval. Contractors and precast producers need supplier accountability during delivery planning and site support. Insteel Industries states that its concrete reinforcing products include welded wire reinforcement and prestressed concrete strand, and its July 2025 investor presentation listed 11 USA manufacturing facilities, including 3 PC strand plants.
- Direct mill supply is expected to capture 58.5% share in 2026, driven by product approval work completed before project supply. Buyers prefer direct routes infleuncing batch record access and corrective action. Mill-led relationships also help contractors reduce delays during bridge and precast schedules.
- Distributors remain useful for smaller projects and local access. Direct mill supply gains selection attention once contractors and precast yards need supplier response during strand testing and delivery coordination.
How does 9.5-12.7 mm create value in the diameter segment?
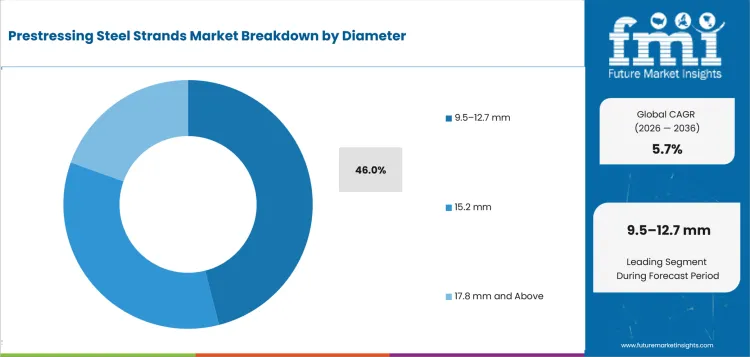
9.5-12.7 mm strands create value in projects needing practical handling, common stressing equipment and stable transfer behavior. Diameter choice links material selection with jobsite equipment and strand availability. Buyers compare such diameter range against installation familiarity and performance records before wider project approval.
- 9.5-12.7 mm is anticipated to hold 46.0% share in 2026, influenced by recurring use across precast members and bridge components. Contractors prefer such range as it can support common stressing practices without major equipment changes. Suppliers gain approval once strand geometry and relaxation records remain consistent across orders.
- 15.2 mm and larger diameters remain useful for heavier loading and longer-span concrete work. Mid-range strands retain buyer attention as project teams compare supply availability and design compatibility during repeat purchases.
What keeps infrastructure important within the end use segment?
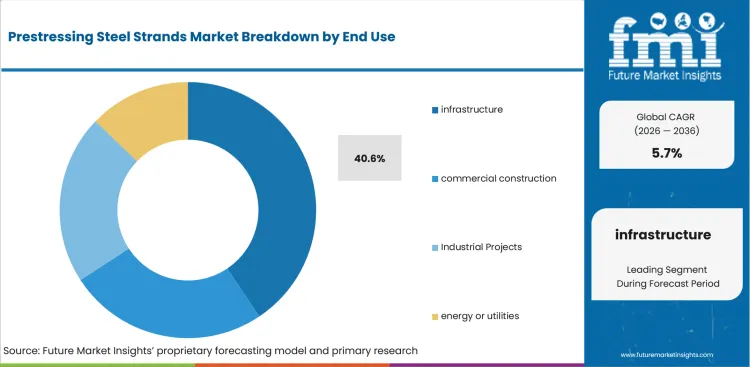
Infrastructure remains central to prestressing steel strand demand as rail assets and public concrete structures require tested reinforcement materials. Project owners need strand documentation able to support service-life expectations and inspection records. Federal Highway Administration bridge data for 2025 listed 624,193 USA bridges, including 41,685 bridges in poor condition. USA Census Bureau estimated highway construction at USD 149.6 billion in April 2026, adding another public-infrastructure signal for strand demand across bridge decks and precast assets.
- Infrastructure is projected to represent 40.6% share in 2026, guided by bridge and public concrete asset requirements. Public owners and contractors use strand specifications to reduce installation risk and strengthen service-life confidence. Supplier selection is expected to depend on test certificates and technical service.
- Commercial construction and industrial projects remain important secondary end uses for prestressing steel strands. Infrastructure leads evaluation cycles as public assets require closer coordination between contractors and material suppliers.
How should buyers read uncoated PC strands demand within the strand type segment?
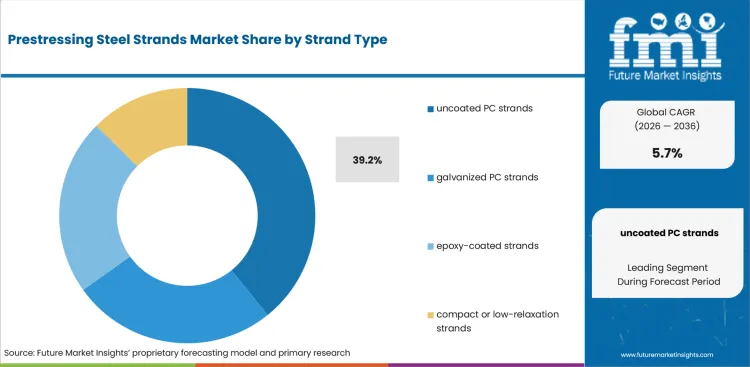
Uncoated PC strands remain a core strand type as many prestressed concrete designs require familiar materials with stable tensile performance. Buyer review focuses on low-relaxation properties and mill test certificates. Engineering teams compare supplier evidence before approving strand use across repeat bridge and precast projects.
- Uncoated PC Strands are expected to account for 39.2% share in 2026, led by established use across buildings and precast products. Buyers use strand type as a standard option once engineering teams can verify strength and relaxation records. Supplier approval depends on repeatable quality across project batches.
- Galvanized, epoxy-coated and compact strands remain useful for exposure conditions and specific design needs. Uncoated PC strands receive broad use as contractors are familiar with inspection practices and application behavior.
Why are bridges important within the application segment?
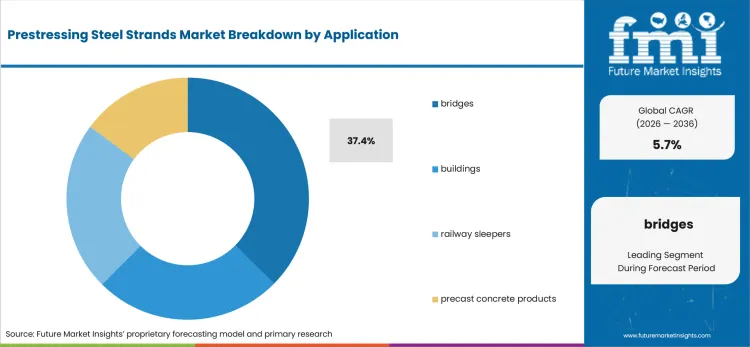
Bridges remain an important application area as prestressing steel strands support deck durability and crack control. Public owners and engineers require clear material records before approving strands for structural elements. Federal Highway Administration bridge condition data reported 309,729 USA bridges in fair condition in 2025, creating a measurable base for renewal and maintenance-linked material demand.
- Bridges are projected to capture 37.4% share in 2026, reflected by public structure renewal and bridge-deck applications. Engineers use strand performance records to defend material choices across design and inspection reviews. Contractors need suppliers supporting delivery timing and field questions during installation.
- Railway sleepers and precast concrete products create additional application demand. Bridges attract closer buyer scrutiny as public owners need stronger proof around relaxation behavior and long-term structural service.
What are the drivers, restraints, and opportunities in the Prestressing Steel Strands Market?
Near-term purchases are shaped by strand qualification and specification-led support outlined below.
- Driver: Infrastructure renewal and precast expansion increase demand for strands supporting longer spans and reliable stress transfer. Buyer teams prefer suppliers able to document relaxation performance and heat traceability before project approval.
- Restraint: Strand price volatility and wire-rod exposure can slow supplier switching. Buyers delay expansion if trial documentation or site support does not match engineering approval needs.
- Opportunity: Specification-led supply packages create room for mills combining testing records and application support. Suppliers can improve trial conversion by helping precast yards and contractors reduce rework during tendon placement and stressing.
Prestressing steel strand demand rises as road and bridge programs convert public infrastructure plans into concrete-intensive work packages. India’s Ministry of Road Transport and Highways reported 146,560 km of National Highways at present and 3,052 km of operational access-controlled high-speed corridors and expressways in 2025. Corridor expansion supports strand demand as flyovers and precast components require reliable reinforcement inputs.
Qualification risk remains a practical restraint as construction demand does not always translate into fast strand approvals. National Bureau of Statistics of China reported fixed asset investment down 3.8% in 2025, and infrastructure investment excluding power and water down 2.2% year on year. Slower conversion can delay project approvals and keep buyers tied to already accepted strand suppliers.
Specification-led supply creates an opportunity for strand mills and wire specialists supporting public infrastructure pipelines. United Kingdom infrastructure planning listed 734 planned projects covering GBP 718 billion of private and public investment over the next decade in March 2026. Project visibility gives suppliers room to combine shipment planning and contractor support for long-cycle construction programs.
Which country CAGRs are profiled in the Prestressing Steel Strands Market?
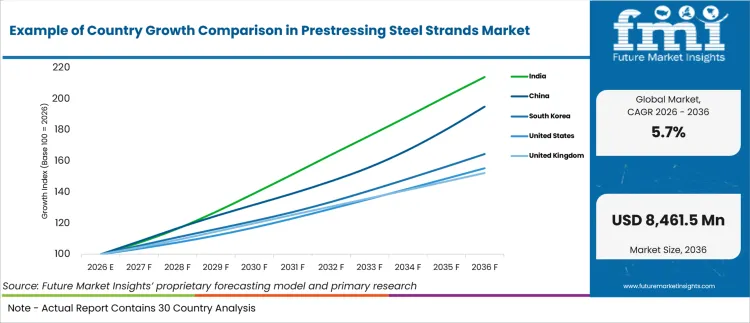
| Country | CAGR |
|---|---|
| India | 7.9% |
| China | 6.9% |
| South Korea | 5.1% |
| United States | 4.5% |
| United Kingdom | 4.3% |
| Germany | 3.9% |
| Japan | 3.7% |
Source: Future Market Insights analysis, 2026.
How do country-level CAGRs compare in the Prestressing Steel Strands Market?
The country comparison spans 4.2 percentage points and highlights three distinct growth groups across the Prestressing Steel Strands Market. India and China form the upper growth tier with only 1.0 percentage point separating the two markets. South Korea creates a transition into the middle tier, while the United States, the United Kingdom, Germany and Japan remain within a 0.8-point band, reflecting a relatively concentrated lower-growth segment. Countries with expanding infrastructure development, bridge construction and investment in high-strength concrete structures generally demonstrate stronger market growth.
-
India leads the comparison as large-scale investments in transportation infrastructure, urban development and commercial construction continue to support demand for prestressing steel strands.
-
China remains 1.0 percentage point below India and reflects a market where ongoing infrastructure modernization, railway expansion and major civil engineering projects sustain product consumption.
-
South Korea stands 1.8 percentage points below China, highlighting the contribution of transportation projects, industrial facilities and structural engineering applications to market growth.
-
The United States remains 0.6 percentage points below South Korea as bridge rehabilitation, highway improvements and commercial construction projects continue to generate demand for prestressed concrete systems.
-
The United Kingdom sits only 0.2 percentage points below the United States, reflecting steady investment in transport infrastructure and structural upgrades across public and private construction projects.
-
Germany records a CAGR 0.4 percentage points below the United Kingdom, with demand supported by engineering-intensive construction, infrastructure renewal and durable concrete structures.
-
Japan remains 0.2 percentage points below Germany, reflecting a mature construction market where prestressing steel strands continue to be used in seismic-resistant buildings, bridges and long-span infrastructure.
Comparable CAGRs can still produce different market entry conditions. Differences in infrastructure spending, construction standards, public investment priorities and adoption of prestressed concrete technologies influence growth patterns and long-term market development. The full report provides country-level CAGR analysis across North America, Latin America, Europe, East Asia, South Asia, Oceania and the Middle East and Africa.
Country-wise Analysis
-
India is projected to post 7.9% CAGR by 2036, driven by national highway expansion and corridor-led bridge demand. Government road data recorded 43,512 km of 4-lane and above National Highways in 2025, supporting strand use across flyovers and precast systems.
- China is forecast to grow at 6.9% CAGR by 2036, influenced by transport investment and steel supply scale. National data reported 36.0% investment growth in pipeline transport and 22.9% growth in multimodal transport and transport agency services in 2025, supporting concrete and infrastructure material demand.
- South Korea is projected to record 5.1% CAGR through 2036, reflected by steel conversion depth and compact infrastructure systems. World Steel Association reported South Korea crude steel production at 61.9 Mt in 2025, giving strand suppliers a domestic steel base for wire and construction material planning.
- United States is expected to expand at 4.5% CAGR through 2036, backed by bridge renewal and concrete reinforcement programs. Federal Highway Administration bridge data listed 272,779 USA bridges in good condition and 309,729 in fair condition in 2025, promoting ongoing inspection and maintenance-linked material demand.
- United Kingdom is forecast to register 4.3% CAGR by 2036, shaped by infrastructure pipeline planning and project delivery needs. March 2026 pipeline data indicated average annual workforce demand of 629,000 to 706,000 workers over the next 5 years, showing construction activity tied to material planning.
- Germany is anticipated to grow at 3.9% CAGR by 2036, underpinned by steel production depth and civil engineering review standards. World Steel Association reported Germany crude steel output at 34.1 Mt in 2025, giving strand buyers a measurable steel supply reference for wire-based construction materials.
- Japan is expected to post 3.7% CAGR through 2036, aided by high specification standards and infrastructure workforce constraints. Japan’s land and infrastructure ministry projected construction engineers to decline by about 1.5% to 3.0% every 5 years and skilled construction workers by about 7.0% to 8.0%, increasing attention on reliable materials and supplier support.
Who are the notable companies in the Prestressing Steel Strands Market?
Insteel Industries, Bekaert, Tata Steel, Kiswire, Usha Martin, Sumiden Wire, Hengxing, Fapricela, DWK Drahtwerk Koeln and Siam Industrial Wire are the notable companies influencing prestressing steel strands and concrete reinforcement supply pathways.
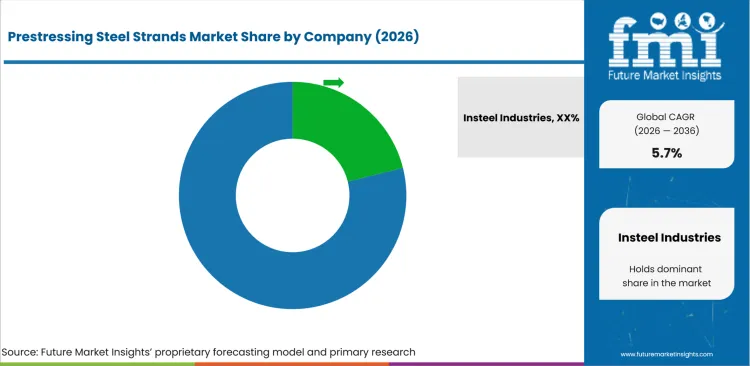
Competition in prestressing steel strands is grouped by how buyers seek strand proof to work. Insteel Industries and Bekaert are stronger in PC strand and concrete reinforcement support. Tata Steel and Kiswire are important for steel-wire conversion and infrastructure supply pathways. Usha Martin, Sumiden Wire and Hengxing strengthen competition led by wire product depth and export reach. Fapricela, DWK Drahtwerk Koeln and Siam Industrial Wire support buyers requiring regional service and order continuity.
- Insteel Industries has an advantage led by PC strand and welded wire reinforcement capabilities. Buyers can connect supplier support with mill trials and construction schedule needs.
- Bekaert supports buyer review based on prestressing wires and strands for concrete structures and precast elements. Engineers use product documentation to compare mechanical-property and relaxation-performance evidence.
- Tata Steel and Kiswire strengthen competition due to wire conversion depth and infrastructure product positioning. Construction programs use such capabilities as strand quality and supply continuity affect project outcomes.
- Usha Martin, Sumiden Wire, Hengxing, Fapricela, DWK Drahtwerk Koeln and Siam Industrial Wire compete based on regional reach and order support. Buyers compare these companies depending on product records and service continuity.
Competitive Benchmarking: Prestressing Steel Strands Market
| Company | Specification Fit | Project Support | Channel Reach | Geographic Reach |
|---|---|---|---|---|
| Insteel Industries | High | High | High | United States |
| Bekaert | High | High | Strong | Global |
| Tata Steel | Strong | Strong | Strong | Global |
| Kiswire | Strong | Medium | Strong | Global |
| Usha Martin | Strong | Medium | Medium | Global |
| Sumiden Wire | High | High | Strong | Global |
| Hengxing | High | Medium | Strong | Global |
| Fapricela | Strong | Medium | Medium | Europe and export markets |
| DWK Drahtwerk Koeln | Medium | Medium | Medium | Europe |
| Siam Industrial Wire | Strong | Medium | Strong | Asia and export markets |
Source: Future Market Insights competitive analysis, 2026.
Key Developments in the Prestressing Steel Strands Market
- In October 2025, Insteel Industries reported fiscal 2025 net earnings of USD 41.0 million. Annual performance improved from USD 19.3 million in 2024, strengthening its position across concrete reinforcing products and PC strand supply.
- In July 2025, Insteel Industries presented an updated investor view of its PC strand manufacturing footprint. Presentation materials identified 3 PC strand plants within its USA facility base, supporting direct mill supply and project documentation needs.
- In July 2025, Tata Steel’s integrated reporting covered Siam Industrial Wire’s PC strand and PC wire position. Company disclosures stated, Siam Industrial Wire exports products to more than 70 countries and holds 34.0% share in Thailand’s PC strand and PC wire segment.
Key Players in the Prestressing Steel Strands Market
Prestressing strand suppliers
- Insteel Industries
- Bekaert
- Tata Steel
- Kiswire
Wire and steel product suppliers
- Usha Martin
- Sumiden Wire
- Hengxing
Regional prestressing suppliers
- Fapricela
- DWK Drahtwerk Koeln
- Siam Industrial Wire
Prestressing Steel Strands Market - Report Scope
| Coverage field | Report scope |
|---|---|
| Market breakdown | Prestressing steel strands market breakdown by strand type, diameter, application, end use, sales channel and region |
| Market Definition | Steel strand products used in prestressed and post-tensioned concrete structures to support tensile reinforcement, span performance, crack control and structural service requirements |
| Regions Covered | North America, Latin America, Europe, East Asia, South Asia and Pacific, Middle East and Africa |
| Countries Covered | United States, China, India, Germany, United Kingdom, Japan, South Korea and 30+ countries |
| Key Companies Profiled | Insteel Industries, Bekaert, Tata Steel, Kiswire, Usha Martin, Sumiden Wire, Hengxing, Fapricela, DWK Drahtwerk Koeln, Siam Industrial Wire |
| Forecast Period | 2026 to 2036 |
| Approach | Hybrid bottom-up and top-down methodology using infrastructure demand, strand application intensity, diameter adoption, sales-channel structure, supplier portfolios and country-level indicators |
Source: Future Market Insights analysis, 2026.
Prestressing Steel Strands Market - Research Methodology
| Method | Approach |
|---|---|
| Primary Research | FMI analysts gathered input from manufacturers, service providers, technology developers, distributors, end users, procurement teams, and subject-matter experts. Interviews examined purchasing decisions, product or service evaluation, adoption barriers, approval requirements, pricing considerations, and expectations for technical or commercial support. Respondents were also asked what evidence is required before a trial, pilot, or initial order develops into regular purchasing. |
| Desk Research | Desk research covered government statistics, regulatory publications, trade data, industry associations, technical literature, standards, company filings, product information, and official corporate announcements. Sources were reviewed for relevance, publication date, geographic coverage, and consistency with the defined market scope. Claims relating to performance, applications, approvals, capacity, investment, and commercial activity were retained only when supported by credible public evidence. |
| Market Sizing and Forecasting | The market model combined the baseline value with historical performance, segment structure, pricing and volume indicators, adoption levels, company participation, and country-level demand conditions. Forecast assumptions considered economic activity, investment trends, regulatory developments, technology adoption, purchasing cycles, supply availability, and barriers to wider market use. Segment and regional estimates were reconciled before the final market total was calculated. |
| Data Validation | Estimates were checked against multiple independent indicators, including public data, company activity, trade patterns, industry developments, and findings from primary interviews. Validation also tested whether products, services, applications, and company revenues fell within the defined market boundaries. Adjacent categories, unsupported claims, overlapping revenues, and activities without direct market relevance were excluded to reduce double counting and maintain consistency across segments and countries. |
Prestressing Steel Strands Market by Segments
Prestressing Steel Strands Market segmented by Strand Type:
- Uncoated PC Strands
- Galvanized PC Strands
- Epoxy-coated Strands
- Compact / Low-relaxation Strands
Prestressing Steel Strands Market segmented by Diameter:
- 9.5-12.7 mm
- 15.2 mm
- 17.8 mm and Above
Prestressing Steel Strands Market segmented by Application:
- Bridges
- Buildings
- Railway Sleepers
- Precast Concrete Products
Prestressing Steel Strands Market segmented by End Use:
- Infrastructure
- Commercial Construction
- Industrial Projects
- Energy / Utilities
Prestressing Steel Strands Market segmented by Sales Channel:
- Direct Mill Supply
- Distributors
- Precast / Contractor Supply
Prestressing Steel Strands Market by Region:
- North America
- United States
- Canada
- Latin America
- Brazil
- Mexico
- Chile
- Rest of Latin America
- Western Europe
- Germany
- United Kingdom
- Italy
- Spain
- France
- Nordic
- BENELUX
- Rest of Western Europe
- Eastern Europe
- Poland
- Hungary
- Balkan and Baltic
- Rest of Eastern Europe
- East Asia
- China
- Japan
- South Korea
- South Asia and Pacific
- India
- ASEAN
- Australia and New Zealand
- Rest of South Asia and Pacific
- Middle East and Africa
- Kingdom of Saudi Arabia
- Other GCC Countries
- Turkiye
- South Africa
- Other African Union
- Rest of Middle East and Africa
Research Sources and Bibliography
- Federal Highway Administration. (2025, June 15). Bridge condition by highway system 2025. Federal Highway Administration.
- Insteel Industries. (2025, July 17). Investor presentation. Insteel Industries.
- Insteel Industries. (2025, October 23). Annual report 2025. Insteel Industries.
- Ministry of Land, Infrastructure, Transport and Tourism. (2025). Summary of the White Paper on Land, Infrastructure, Transport and Tourism in Japan, 2025. Ministry of Land, Infrastructure, Transport and Tourism.
- National Bureau of Statistics of China. (2026, January 20). Investment in fixed assets in 2025. National Bureau of Statistics of China.
- National Infrastructure and Service Transformation Authority. (2026, March 9). Infrastructure Pipeline update signals future workforce needs. Government of the United Kingdom.
- Press Information Bureau. (2025, December 30). Year End Review 2025 - Ministry of Road Transport and Highways. Government of India.
- Tata Steel. (2025, July). Integrated Report 2024-25: Annexures. Tata Steel.
- USA Census Bureau. (2026, June 1). Monthly construction spending, April 2026. USA Census Bureau.
- USA Geological Survey. (2026). Cement. In Mineral Commodity Summaries 2026. USA Geological Survey.
- World Steel Association. (2026, January 23). December 2025 crude steel production and 2025 global crude steel production totals. World Steel Association.
This bibliography is provided for reader reference and is not exhaustive. The full report contains the complete reference list and detailed citations.
This Report Answers
- What is the expected global value of the prestressing steel strands market in 2026 and 2036?
- What CAGR is forecast for the prestressing steel strands market during the 2026 to 2036 period?
- Which diameter segment is used to assess 9.5-12.7 mm prestressing steel strand demand in 2026?
- Why do contractors and infrastructure owners buy controlled prestressing steel strand systems?
- How do direct mill supply and infrastructure demand shape strand purchasing choices?
- Which countries are compared in the prestressing steel strands forecast?
- Which companies compete across PC strand and concrete reinforcement supply pathways?
- What strand types and applications are included within the prestressing steel strands definition?
- How does FMI size and forecast prestressing steel strand demand across segments and countries?
- What qualification and supplier-selection factors should executives assess?
Frequently Asked Questions
What is driving growth in the prestressing steel strands market?
Demand is driven by precast expansion and the need to maintain structural performance across concrete projects. Buyers are also giving more attention to strands being able to reduce uncertainty during specification review and field execution.
Why should executives track the prestressing steel strands market?
Executives are likely to track this segment since strand approval affects project timing and supplier accountability. Supplier selection can influence installation reliability and commercial performance across infrastructure and precast operations.
What business problem does the prestressing steel strands market address?
Prestressing steel strands help contractors and public owners reduce uncertainty around tensile reinforcement and repeatable use in concrete structures. It also supports buyers requiring clearer links between strand quality and operating control.
What should sourcing leaders evaluate before selecting suppliers?
Sourcing leaders are likely to compare documentation quality and supply reliability before supplier approval. Technical service and project-specific evidence should also guide supplier review.
What can limit return on investment for buyers?
Return on investment is expected to be delayed if trial evidence is weak or strand handling requires project changes. Buyers are expected to reduce such risk by phasing supplier approval before wider use.
How can suppliers build executive confidence?
Suppliers build confidence through verified product data and accountable support during project roll-out. Clear test records and consistent batch documentation can strengthen buyer approval.
Which companies lead prestressing steel strands market?
Competition is led by Insteel Industries and Bekaert, based on PC strand portfolios and concrete reinforcement support. Tata Steel, Kiswire and Usha Martin add wire conversion depth for infrastructure supply programs.
What demand driver supports prestressing steel strands market?
Bridge renewal and precast concrete work support demand across public infrastructure programs. Contractors prefer strand suppliers with tensile strength records and mill documentation.
Preview the report firsthand - request a free sample
Get SampleGet the brochure for pricing and purchase details.
Get PDFTable of Content
- Key Takeaways
- Market Size and CAGR
- Top Growth Driver
- Fastest Growing Segment
- Leading Region
- Key Companies
- Emerging Opportunities
- Executive Summary
- Global Market Outlook
- Demand-side Trends
- Supply-side Trends
- Technology Roadmap Analysis
- Analysis and Recommendations
- Analyst Perspective (What is happening? Why now? What should investors know?)
- Key Questions Answered
- How large is the market?
- What is the CAGR?
- What are key trends?
- Which region dominates?
- Who are the leaders?
- Market Overview
- Market Coverage / Taxonomy
- Market Definition / Scope / Limitations
- Research Methodology
- Chapter Orientation
- Analytical Lens and Working Hypotheses
- Market Structure, Signals, and Trend Drivers
- Benchmarking and Cross-market Comparability
- Market Sizing, Forecasting, and Opportunity Mapping
- Research Design and Evidence Framework
- Desk Research Programme (Secondary Evidence)
- Expert Input and Fieldwork (Primary Evidence)
- Tooling, Models, and Reference Databases
- Data Engineering and Model Build
- Quality Assurance and Audit Trail
- Market Background
- Market Dynamics (Drivers, Restraints, Opportunity, Trends)
- Scenario Forecast (Optimistic, Likely, Conservative)
- Impact Analysis
- AI Impact
- Sustainability Impact
- Regulatory Impact
- Technology Impact
- Consumer / Buyer Analysis
- Purchase Drivers
- Adoption Barriers
- Buyer Journey
- Opportunity Map Analysis
- Product Life Cycle Analysis
- Supply Chain Analysis
- Investment Feasibility Matrix
- Value Chain Analysis
- PESTLE and Porter's Analysis
- Regulatory Landscape
- Regional Parent Market Outlook
- Production and Consumption Statistics
- Import and Export Statistics
- Global Market Analysis and Forecast, 2021 to 2036
- Historical Market Size Value (USD Mn) Analysis, 2021 to 2025
- Current and Future Market Size Value (USD Mn) Projections, 2026 to 2036
- Y-o-Y Growth Trend Analysis
- Absolute $ Opportunity Analysis
- Global Market Pricing Analysis, 2021 to 2036
- Global Market Analysis and Forecast, By Strand Type, 2021 to 2036
- Introduction / Key Findings
- Historical Market Size Value (USD Mn) Analysis By Strand Type, 2021 to 2025
- Current and Future Market Size Value (USD Mn) Analysis and Forecast By Strand Type, 2026 to 2036
- uncoated PC strands
- galvanized PC strands
- epoxy-coated strands
- compact or low-relaxation strands
- uncoated PC strands
- Y-o-Y Growth Trend Analysis By Strand Type, 2021 to 2025
- Absolute $ Opportunity Analysis By Strand Type, 2026 to 2036
- Global Market Analysis and Forecast, By Diameter, 2021 to 2036
- Introduction / Key Findings
- Historical Market Size Value (USD Mn) Analysis By Diameter, 2021 to 2025
- Current and Future Market Size Value (USD Mn) Analysis and Forecast By Diameter, 2026 to 2036
- 9.5-12.7 mm
- 15.2 mm
- 17.8 mm and Above
- 9.5-12.7 mm
- Y-o-Y Growth Trend Analysis By Diameter, 2021 to 2025
- Absolute $ Opportunity Analysis By Diameter, 2026 to 2036
- Global Market Analysis and Forecast, By Application, 2021 to 2036
- Introduction / Key Findings
- Historical Market Size Value (USD Mn) Analysis By Application, 2021 to 2025
- Current and Future Market Size Value (USD Mn) Analysis and Forecast By Application, 2026 to 2036
- bridges
- buildings
- railway sleepers
- precast concrete products
- bridges
- Y-o-Y Growth Trend Analysis By Application, 2021 to 2025
- Absolute $ Opportunity Analysis By Application, 2026 to 2036
- Global Market Analysis and Forecast, By End Use, 2021 to 2036
- Introduction / Key Findings
- Historical Market Size Value (USD Mn) Analysis By End Use, 2021 to 2025
- Current and Future Market Size Value (USD Mn) Analysis and Forecast By End Use, 2026 to 2036
- infrastructure
- commercial construction
- Industrial Projects
- energy or utilities
- infrastructure
- Y-o-Y Growth Trend Analysis By End Use, 2021 to 2025
- Absolute $ Opportunity Analysis By End Use, 2026 to 2036
- Global Market Analysis and Forecast, By Sales Channel, 2021 to 2036
- Introduction / Key Findings
- Historical Market Size Value (USD Mn) Analysis By Sales Channel, 2021 to 2025
- Current and Future Market Size Value (USD Mn) Analysis and Forecast By Sales Channel, 2026 to 2036
- direct mill supply
- distributors
- precast or contractor supply
- direct mill supply
- Y-o-Y Growth Trend Analysis By Sales Channel, 2021 to 2025
- Absolute $ Opportunity Analysis By Sales Channel, 2026 to 2036
- Global Market Analysis and Forecast, By Region, 2021 to 2036
- Introduction
- Historical Market Size Value (USD Mn) Analysis By Region, 2021 to 2025
- Current Market Size Value (USD Mn) Analysis and Forecast By Region, 2026 to 2036
- North America
- Latin America
- Western Europe
- Eastern Europe
- East Asia
- South Asia and Pacific
- Middle East & Africa
- Market Attractiveness Analysis By Region
- North America Market Analysis and Forecast, By Country, 2021 to 2036
- Historical Market Size Value (USD Mn) Trend Analysis By Market Taxonomy, 2021 to 2025
- Market Size Value (USD Mn) Forecast By Market Taxonomy, 2026 to 2036
- By Country
- USA
- Canada
- By Strand Type
- By Diameter
- By Application
- By End Use
- By Sales Channel
- By Country
- Market Attractiveness Analysis
- By Country
- By Strand Type
- By Diameter
- By Application
- By End Use
- By Sales Channel
- Key Takeaways
- Latin America Market Analysis and Forecast, By Country
- Historical Market Size Value (USD Mn) Trend Analysis By Market Taxonomy, 2021 to 2025
- Market Size Value (USD Mn) Forecast By Market Taxonomy, 2026 to 2036
- By Country
- Brazil
- Mexico
- Chile
- Rest of Latin America
- By Strand Type
- By Diameter
- By Application
- By End Use
- By Sales Channel
- By Country
- Market Attractiveness Analysis
- By Country
- By Strand Type
- By Diameter
- By Application
- By End Use
- By Sales Channel
- Key Takeaways
- Western Europe Market Analysis and Forecast, By Country
- Historical Market Size Value (USD Mn) Trend Analysis By Market Taxonomy, 2021 to 2025
- Market Size Value (USD Mn) Forecast By Market Taxonomy, 2026 to 2036
- By Country
- Germany
- UK
- Italy
- Spain
- France
- Nordic
- BENELUX
- Rest of Western Europe
- By Strand Type
- By Diameter
- By Application
- By End Use
- By Sales Channel
- By Country
- Market Attractiveness Analysis
- By Country
- By Strand Type
- By Diameter
- By Application
- By End Use
- By Sales Channel
- Key Takeaways
- Eastern Europe Market Analysis and Forecast, By Country
- Historical Market Size Value (USD Mn) Trend Analysis By Market Taxonomy, 2021 to 2025
- Market Size Value (USD Mn) Forecast By Market Taxonomy, 2026 to 2036
- By Country
- Russia
- Poland
- Hungary
- Balkan & Baltic
- Rest of Eastern Europe
- By Strand Type
- By Diameter
- By Application
- By End Use
- By Sales Channel
- By Country
- Market Attractiveness Analysis
- By Country
- By Strand Type
- By Diameter
- By Application
- By End Use
- By Sales Channel
- Key Takeaways
- East Asia Market Analysis and Forecast, By Country
- Historical Market Size Value (USD Mn) Trend Analysis By Market Taxonomy, 2021 to 2025
- Market Size Value (USD Mn) Forecast By Market Taxonomy, 2026 to 2036
- By Country
- China
- Japan
- South Korea
- By Strand Type
- By Diameter
- By Application
- By End Use
- By Sales Channel
- By Country
- Market Attractiveness Analysis
- By Country
- By Strand Type
- By Diameter
- By Application
- By End Use
- By Sales Channel
- Key Takeaways
- South Asia and Pacific Market Analysis and Forecast, By Country
- Historical Market Size Value (USD Mn) Trend Analysis By Market Taxonomy, 2021 to 2025
- Market Size Value (USD Mn) Forecast By Market Taxonomy, 2026 to 2036
- By Country
- India
- ASEAN
- Australia & New Zealand
- Rest of South Asia and Pacific
- By Strand Type
- By Diameter
- By Application
- By End Use
- By Sales Channel
- By Country
- Market Attractiveness Analysis
- By Country
- By Strand Type
- By Diameter
- By Application
- By End Use
- By Sales Channel
- Key Takeaways
- Middle East & Africa Market Analysis and Forecast, By Country
- Historical Market Size Value (USD Mn) Trend Analysis By Market Taxonomy, 2021 to 2025
- Market Size Value (USD Mn) Forecast By Market Taxonomy, 2026 to 2036
- By Country
- Kingdom of Saudi Arabia
- Other GCC Countries
- Türkiye
- South Africa
- Other African Union
- Rest of Middle East & Africa
- By Strand Type
- By Diameter
- By Application
- By End Use
- By Sales Channel
- By Country
- Market Attractiveness Analysis
- By Country
- By Strand Type
- By Diameter
- By Application
- By End Use
- By Sales Channel
- Key Takeaways
- Key Countries Market Analysis
- USA
- Pricing Analysis
- Market Share Analysis, 2025
- By Strand Type
- By Diameter
- By Application
- By End Use
- By Sales Channel
- Canada
- Pricing Analysis
- Market Share Analysis, 2025
- By Strand Type
- By Diameter
- By Application
- By End Use
- By Sales Channel
- Mexico
- Pricing Analysis
- Market Share Analysis, 2025
- By Strand Type
- By Diameter
- By Application
- By End Use
- By Sales Channel
- Brazil
- Pricing Analysis
- Market Share Analysis, 2025
- By Strand Type
- By Diameter
- By Application
- By End Use
- By Sales Channel
- Chile
- Pricing Analysis
- Market Share Analysis, 2025
- By Strand Type
- By Diameter
- By Application
- By End Use
- By Sales Channel
- Germany
- Pricing Analysis
- Market Share Analysis, 2025
- By Strand Type
- By Diameter
- By Application
- By End Use
- By Sales Channel
- UK
- Pricing Analysis
- Market Share Analysis, 2025
- By Strand Type
- By Diameter
- By Application
- By End Use
- By Sales Channel
- Italy
- Pricing Analysis
- Market Share Analysis, 2025
- By Strand Type
- By Diameter
- By Application
- By End Use
- By Sales Channel
- Spain
- Pricing Analysis
- Market Share Analysis, 2025
- By Strand Type
- By Diameter
- By Application
- By End Use
- By Sales Channel
- France
- Pricing Analysis
- Market Share Analysis, 2025
- By Strand Type
- By Diameter
- By Application
- By End Use
- By Sales Channel
- India
- Pricing Analysis
- Market Share Analysis, 2025
- By Strand Type
- By Diameter
- By Application
- By End Use
- By Sales Channel
- ASEAN
- Pricing Analysis
- Market Share Analysis, 2025
- By Strand Type
- By Diameter
- By Application
- By End Use
- By Sales Channel
- Australia & New Zealand
- Pricing Analysis
- Market Share Analysis, 2025
- By Strand Type
- By Diameter
- By Application
- By End Use
- By Sales Channel
- China
- Pricing Analysis
- Market Share Analysis, 2025
- By Strand Type
- By Diameter
- By Application
- By End Use
- By Sales Channel
- Japan
- Pricing Analysis
- Market Share Analysis, 2025
- By Strand Type
- By Diameter
- By Application
- By End Use
- By Sales Channel
- South Korea
- Pricing Analysis
- Market Share Analysis, 2025
- By Strand Type
- By Diameter
- By Application
- By End Use
- By Sales Channel
- Russia
- Pricing Analysis
- Market Share Analysis, 2025
- By Strand Type
- By Diameter
- By Application
- By End Use
- By Sales Channel
- Poland
- Pricing Analysis
- Market Share Analysis, 2025
- By Strand Type
- By Diameter
- By Application
- By End Use
- By Sales Channel
- Hungary
- Pricing Analysis
- Market Share Analysis, 2025
- By Strand Type
- By Diameter
- By Application
- By End Use
- By Sales Channel
- Kingdom of Saudi Arabia
- Pricing Analysis
- Market Share Analysis, 2025
- By Strand Type
- By Diameter
- By Application
- By End Use
- By Sales Channel
- Türkiye
- Pricing Analysis
- Market Share Analysis, 2025
- By Strand Type
- By Diameter
- By Application
- By End Use
- By Sales Channel
- South Africa
- Pricing Analysis
- Market Share Analysis, 2025
- By Strand Type
- By Diameter
- By Application
- By End Use
- By Sales Channel
- USA
- Market Structure Analysis
- Competition Dashboard
- Competition Benchmarking
- Market Share Analysis of Top Players
- By Regional
- By Strand Type
- By Diameter
- By Application
- By End Use
- By Sales Channel
- Emerging Startups
- Innovation Benchmarking
- Competition Analysis
- Competition Deep Dive
- Insteel Industries
- Overview
- Product Portfolio
- Profitability by Market Segments
- Sales Footprint
- Strategy Overview
- Marketing Strategy
- Product Strategy
- Channel Strategy
- Bekaert
- Tata Steel
- Kiswire
- Usha Martin
- Sumiden Wire
- Hengxing
- Fapricela
- DWK Drahtwerk Koeln
- Siam Industrial Wire
- Insteel Industries
- Case Studies
- Success Stories
- Recent Developments
- Competition Deep Dive
- Assumptions & Acronyms Used


