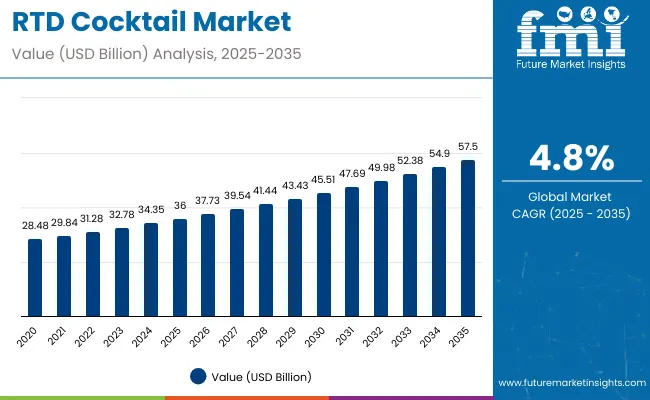
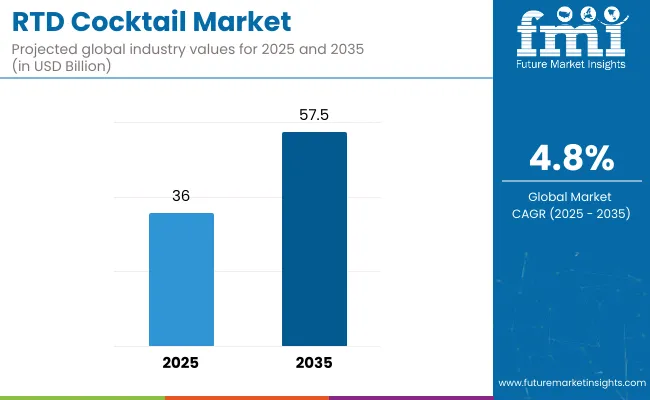
The ready-to-drink (RTD) cocktail market is estimated to be valued at USD 36.0 billion in 2025 and is projected to reach USD 57.5 billion by 2035, registering a compound annual growth rate (CAGR) of 4.8%. The market is projected to add an absolute dollar opportunity of USD 21.5 billion over the forecast period.
| Metric | Value |
|---|---|
| Market Size (2025) | USD 36 billion |
| Projected Market Size (2035) | USD 57.5 billion |
| CAGR (2025 to 2035) | 4.8% |
This reflects a 1.6 times growth at a compound annual growth rate of 4.8%. The market’s evolution is expected to be shaped by rising demand for convenient, premium alcoholic beverages, increasing popularity of low-ABV and spirit-based cocktails, and growing consumer preference for flavored, mixology-style drinks, particularly among millennials and urban consumers.
By 2030, the market is projected to reach nearly USD 45.51 billion, reflecting robust mid-term growth fueled by brand diversification and increasing popularity of flavored and premium cocktails. The sector is projected to achieve an absolute growth of USD 21.5 billion over 2025 to 2035, underscoring growing consumer inclination toward ready-to-drink cocktails and ongoing innovation in flavors and packaging worldwide.
Leading companies such as Anheuser-Busch InBev, Diageo plc, Pernod Ricard, Bacardi Limited, and Beam Suntory Inc. are consolidating their positions by strengthening product portfolios and advancing next-generation RTD cocktail innovations.
Their focus includes expanding flavor varieties, premium ingredient blends, and eco-friendly packaging that enhances convenience and sustainability, enabling stronger market penetration across both developed markets and emerging regions. By investing in product innovation, brand collaborations, and targeted marketing strategies, these players are enhancing consumer engagement while capturing growth opportunities in the rapidly evolving ready-to-drink cocktail segment.
The market holds a significant position in the alcoholic beverage industry, driven primarily by popular product types such as vodka-based RTD cocktails, which account for around 23% of the market share. Packaging formats such as cans, accounting for 38.0% of sales, remain central to consumer preference due to portability and ease of use. The sector benefits from consistent consumer demand, ongoing flavor innovation, and expansion of retail and online distribution channels worldwide.
The market is evolving with premiumization trends, inclusion of low-alcohol and hard seltzer options, and adoption of sustainable packaging materials that meet changing consumer lifestyles and health considerations. Companies are strengthening their portfolios with a wider range of flavors, limited editions, and collaborations with renowned mixologists and influencers, aiming to appeal to younger demographics and niche segments. Strategic partnerships with retailers, e-commerce platforms, and event sponsorships are reshaping accessibility and positioning RTD cocktails as essential beverages for social occasions, convenience, and experiential consumption globally.
The Ready-to-Drink (RTD) cocktail market is growing rapidly due to several converging factors that cater to modern consumer preferences and lifestyle shifts. Convenience tops the list, as RTD cocktails offer a hassle-free, portable, and time-saving option for consumers who want to enjoy high-quality cocktails without the need for traditional preparation or bar visits. This is particularly appealing to younger demographics and urban consumers who value on-the-go consumption and quick access.
Innovation in flavors and product variety significantly drives market expansion. Brands are introducing unique and premium flavor combinations, including low-alcohol and healthier options like hard seltzers and organic ingredients, appealing to health-conscious and adventurous drinkers. Sustainable and attractive packaging, especially the widespread adoption of cans, enhance portability and environmental appeal. The growth of online retail and expanding distribution channels further facilitate market accessibility, allowing consumers worldwide to explore and purchase RTD cocktails easily.
The market is segmented by sales channel, product type, packaging type, flavor, and region. By sales channel, the market is categorized into on-trade/food service, institutional sales (hospitality), retail including hypermarket/supermarket, convenience store, specialty stores, liquor shop/beverage exclusive, airport retail, and online retail. Based on product type, the market is divided into ciders, gin, vodka, wine, whiskey, rum, hard seltzer, and cocktail (bourbon, tequila).
In terms of packaging type, the market is divided into cans, premixed cocktail shots, and bottles. By flavor, the market is bifurcated into unflavored and flavored (citrus, ginger, apple, vanilla, berry, tropical, coconut, jerk, mixed fruits, and others such as plantain). Regionally, the market is classified into North America, Latin America, Europe, East Asia, South Asia, Oceania, and the Middle East and Africa.
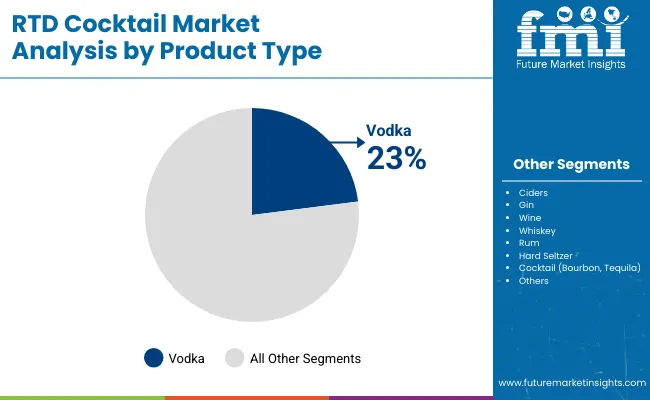
The vodka segment is projected to remain the most lucrative product type within the market, commanding a substantial market share of 23% in 2025. Its popularity is underpinned by vodka’s versatile flavor profile, which blends seamlessly with a wide range of mixers and ingredients, offering consumers endless possibilities for innovative and customizable cocktail experiences. This adaptability makes vodka-based RTDs appealing to a broad demographic, from traditional cocktail enthusiasts to younger consumers seeking convenient, ready-to-drink options.
Vodka’s dominance is further reinforced by strong brand presence, extensive product innovations, and aggressive marketing strategies by leading beverage companies. The increasing demand for flavored vodka RTDs, including citrus, berry, and tropical varieties, caters to evolving consumer tastes and preference for novel drinking experiences. Additionally, vodka’s low-calorie perception in some markets aligns well with health-conscious consumers, driving adoption in premium and craft RTD segments.
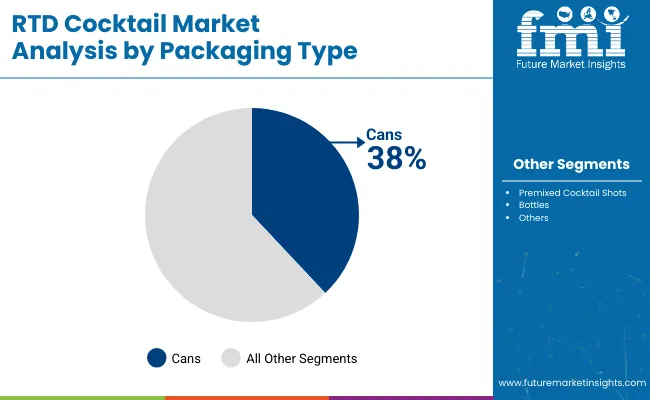
The cans segment is the most lucrative packaging type in the market, holding a dominant share of 38% in 2025. Cans have emerged as the preferred packaging option due to their unmatched convenience, portability, and sustainability benefits. Their lightweight nature and ability to keep beverages fresh and carbonated make them ideal for on-the-go consumption and outdoor activities, resonating strongly with younger, urban consumers who prioritize convenience without compromising quality.
Rising consumer demand for eco-friendly packaging further propels the growth of the cans segment, as aluminum is highly recyclable and less resource-intensive to produce compared to glass bottles. Innovations in can design and branding enable manufacturers to offer visually appealing products that stand out on retail shelves and attract impulse purchases. Additionally, canned RTD cocktails benefit from compatibility with major distribution channels such as convenience stores, supermarkets, and online platforms, facilitating widespread accessibility.
The RTD cocktail market from 2025 to 2035 is driven by growing consumer demand for convenient, ready-to-drink alcoholic beverages, rising preference for premium and flavored cocktails, and expansion of e-commerce and modern retail channels globally. Increasing urbanization and shifting social lifestyles encourage on-the-go consumption. Product innovations in flavors, packaging, and low-alcohol content variants further stimulate market growth. However, regulatory restrictions on alcohol advertising and health concerns about excessive consumption pose challenges to market expansion.
Health Awareness and Culinary Innovation Boost RTD Cocktail Market Growth
Increasing consumer awareness about health and nutrition is driving the demand for low-calorie, organic, and natural ingredient-based RTD cocktails. Culinary innovation by brands including collaborations with renowned mixologists and infusion of exotic flavors enhances appeal and consumer interest. The rise of sustainable and eco-friendly packaging aligns with environmental consciousness. Growth of online platforms facilitates wider accessibility and convenience. These factors collectively support market growth and evolving consumer preferences.
Innovation and Sustainability Expanding RTD Cocktail Market Opportunities
Innovations such as new flavor blends, premium spirits, and sustainable packaging are broadening market opportunities beyond traditional products. The development of hard seltzers and low-alcohol RTD variants targets health-conscious consumers. Brands increasingly adopt eco-friendly manufacturing and recyclable materials to reduce environmental impact. Regulatory compliance and quality certifications address consumer trust and safety concerns. These trends fuel diversified product offerings and strengthen position in a competitive alcoholic beverage landscape.
| Country | CAGR (%) |
|---|---|
| India | 7.5 |
| United Kingdom | 7.5 |
| Japan | 6.5 |
| France | 6.2 |
| Germany | 6.1 |
| South Korea | 5.9 |
| United States | 5.8 |
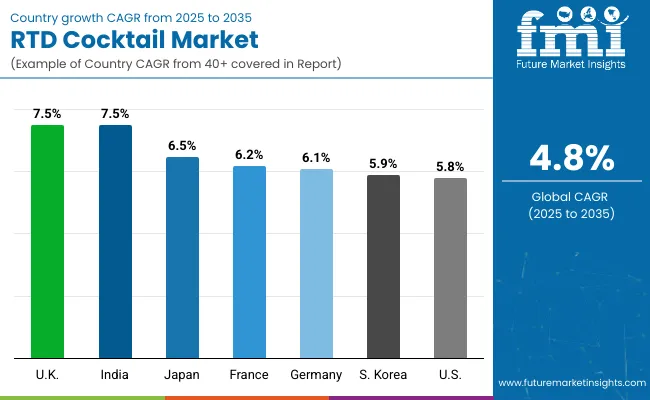
The RTD cocktail market shows varied growth across key countries. India and the United Kingdom lead with a CAGR of 7.5%, driven by urbanization, rising incomes, and youthful consumers embracing flavored cocktails. Japan (6.5%) and France (6.2%) follow, boosted by demand for premium, sustainable products. Germany (6.1%) and South Korea (5.9%) exhibit steady expansion due to shifting consumer preferences towards convenience and eco-friendly packaging. The USA grows at 5.8%, fueled by premiumization and innovation but faces market maturity. Emerging markets grow faster, while developed countries focus on premium and sustainable product innovation, driving the global RTD cocktail market's evolution.
The report covers an in-depth analysis of 40+ countries; seven top-performing OECD countries are highlighted below.
Revenue from RTD cocktails in the United States is witnessing substantial production capacity expansion driven by a CAGR of 5.8% from 2025 to 2035, reflecting growing consumer demand for convenient, premium alcoholic beverages. Major manufacturers are scaling operations to meet the rising preference for flavored and craft cocktails that cater to diverse taste profiles. Increasing investments in innovative packaging, especially cans, complement the focus on sustainability and portability. Online retail platforms and convenience stores are becoming primary distribution channels, enhancing product accessibility.
Marketing collaborations with influencers and mixologists further stimulate product trial and brand loyalty. Consumers’ shift towards low-alcohol and healthier options is prompting product diversification and new launches. Robust infrastructure development supporting large-scale production and distribution boosts market resilience. Overall, production capacities are aligning with escalating market consumption, facilitating ongoing growth and innovation.
Revenue from RTD cocktails in Germany is growing steadily at a CAGR of 6.1% due to a shift toward diverse and ready-to-drink beverage options among consumers. Manufacturers are responding with increased production of flavored vodka and gin RTD cocktails, aligning product portfolios with demand for novelty and quality. Sustainable production practices and recyclable packaging materials are increasingly adopted to meet regulatory requirements and consumer preferences.
Retail distribution shows marked growth in supermarkets and convenience stores, supporting availability across urban and suburban areas. The evolving drinking culture, especially among younger demographics, encourages the introduction of low-alcohol and premium variants. Collaborations between international brands and local producers enhance product innovation. Investment in production technology optimizes efficiency and maintains quality standards. German RTD cocktail producers are capitalizing on these trends to consolidate market share and drive sector growth.
Revenue from RTD cocktail in the United Kingdom is undergoing rapid structural adoption, growing at a CAGR of 7.5%, driven by escalating consumer demand for convenience and premium experiences. Production facilities are expanding with a focus on crafting diverse flavored products, including hard seltzers and artisanal cocktails. Sustainable packaging solutions, including aluminum cans and eco-friendly materials, play a key role in product design and market appeal.
The on-trade and off-trade sectors are both instrumental in distribution, complemented by a thriving online retail landscape. Regulatory frameworks encouraging responsible drinking have spurred innovation in low-alcohol products. Partnerships with local distilleries and global players facilitate access to high-quality ingredients and technology.
The progressive urban lifestyle and social trends favor ready-to-drink consumption, prompting manufacturers to optimize production capacity continually. Resulting market dynamism in the UK strengthens its position as a leader in RTD cocktail innovation and consumption.
Demand for RTD cocktails in South Korea is experiencing notable production capacity growth at a CAGR of 5.9% due to rapid urbanization and evolving beverage preferences. Manufacturers are ramping up output to cater to the increasing demand for flavored and health-conscious RTD cocktails. The synergy between convenience store chains and e-commerce platforms fuels product accessibility and boosts sales. Young consumers' affinity for innovative mixology and premiumization fuels continuous product development. Local and international brands are investing in advanced production technologies to maintain quality and scalability.
Sustainable packaging adoption is gaining traction to meet environmental expectations. Marketing strategies leveraging social media influencers effectively enhance brand visibility. Overall, the production landscape in South Korea is adapting dynamically to shifting consumer trends and market opportunities.
Demand for RTD cocktail in Japan reflects significant output enhancement, growing at a CAGR of 6.5%, responding to consumer preferences for high-quality, sophisticated beverages. Production strategies emphasize premium ingredients and unique flavor profiles that align with domestic tastes. Convenience store ubiquity and expanding online platforms ensure broad distribution and consumer reach. Companies integrate advanced technology into production lines to optimize efficiency and product consistency. Sustainability initiatives in packaging and production processes resonate well with consumers.
Collaborative ventures between global brands and local producers enhance product authenticity and innovation. The cultural trend towards shorter, social drinking occasions further boosts RTD consumption. Japan’s market growth is underpinned by this comprehensive approach to production scale and quality enhancement.
Structural Expansion in RTD Cocktail Market in France
Demand for RTD cocktails in France is witnessing structural expansion fueled by a CAGR of 6.2% and heightened consumer interest in premium, natural, and authentic beverage options. Producers are enhancing capacity to meet demand for organic and flavor-rich RTD cocktails. Sustainable and aesthetically appealing packaging is prioritized to cater to environmentally conscious consumers.
Distribution channels including hospitality venues, retail supermarkets, and online platforms are expanding reach effectively. The growing social drinking culture and outdoor events facilitate RTD product adoption. Producer focus on low-alcohol, healthy alternatives aligns with evolving market trends. Investment in production innovation supports quality and scalability needs. These factors collectively contribute to the structural strengthening of France’s RTD cocktail market.
Output and Capacity Growth in RTD Cocktail Market in India
Revenue from RTD cocktails in India is characterized by rapid output and capacity growth propelled by a CAGR of 7.5%, driven by urbanization and shifting social norms. Manufacturers are scaling operations to meet surging demand from a young, aspirational population. Expansion of modern retail and e-commerce channels facilitates widespread product availability.
The increasing acceptance of flavored and international RTD cocktails drives diverse product launches. Sustainable packaging and cost-effective production remain focal points for market players. Marketing efforts target millennials and Gen Z consumers through social media and experiential campaigns. Strategic partnerships with local producers optimize supply chains and production efficiency. These developments underpin India’s fast-growing and promising RTD cocktail market.
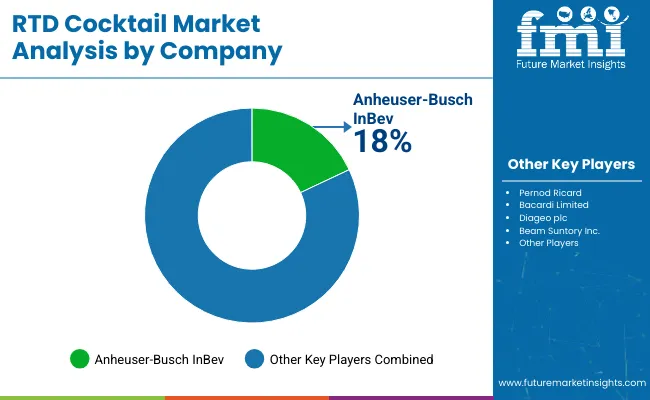
The market is highly competitive, characterized by the presence of several global beverage giants alongside innovative craft producers. Leading companies such as Anheuser-Busch InBev, Diageo plc, Pernod Ricard, Bacardi Limited, and Beam Suntory Inc. dominate the market through extensive product portfolios, strong brand recognition, and wide distribution networks. These players invest heavily in research and development to introduce new flavors, premium ingredient blends, and eco-friendly packaging innovations that cater to evolving consumer preferences.
Strategic collaborations with mixologists, celebrities, and influencers enable these companies to enhance brand visibility and connect with younger demographics, who constitute a significant consumer base for RTD cocktails. Additionally, mergers, acquisitions, and partnerships are common strategies to expand geographic reach and diversify product offerings.
Smaller craft brands and regional players are also gaining traction by focusing on niche markets with artisanal, organic, and low-alcohol variants, providing consumers with unique experiences. The rise of e-commerce and direct-to-consumer sales channels has intensified competition, prompting companies to strengthen their digital marketing and logistics capabilities.
| Items | Values |
|---|---|
| Quantitative Units (2025) | USD 36 billion |
| Sales Channel | On-trade/Food Service, Institutional Sales (Hospitality), Retail, Hypermarket/Supermarket, Convenience Store, Specialty Stores, Liquor Shop/Beverage Exclusive, Airport Retail, Online Retail |
| Product Type | Vodka, Gin, Ciders, Wine, Whiskey, Rum, Hard Seltzer, Cocktail (Bourbon, Tequila) |
| Packaging Type | Cans, Premixed Cocktail Shots, Bottles |
| Flavor | Unflavored, Flavored (Citrus, Ginger, Apple, Vanilla, Berry, Tropical, Coconut, Jerk, Mixed Fruits, Others [Plantain]) |
| Regions Covered | North America, Latin America, Europe, East Asia, South Asia, Oceania, Middle East and Africa |
| Countries Covered | United States, Canada, United Kingdom, Germany, France, China, Japan, South Korea, Brazil, Australia, and 40+ countries |
| Key Companies Profiled | Diageo plc, Pernod Ricard, Bacardi Limited, Brown-Forman Corporation, Beam Suntory Inc., Mark Anthony Brands, Pabst Brewing Company LLC, The Coca-Cola Company, Anheuser-Busch InBev, Campari Group |
| Additional Attributes | Revenue by product type, packaging, and flavor, growth in flavored and low-alcohol variants, expansion of online and modern retail channels, consumer preference for convenience and premium products, adoption of sustainable packaging, rising social occasions and urbanization driving demand |
The global RTD cocktail market is estimated to be valued at USD 36.0 billion in 2025.
The market size for RTD cocktail is projected to reach USD 57.5 billion by 2035.
The RTD cocktail market is expected to grow at a 4.8% CAGR between 2025 and 2035.
The vodka segment is projected to lead in the RTD cocktail market with 23% market share in 2025.
In terms of packaging, the cans segment is projected to command 38% share in the RTD cocktail market in 2025.


Full Research Suite comprises of:
Market outlook & trends analysis
Interviews & case studies
Strategic recommendations
Vendor profiles & capabilities analysis
5-year forecasts
8 regions and 60+ country-level data splits
Market segment data splits
12 months of continuous data updates
DELIVERED AS:
PDF EXCEL ONLINE
RTD Cocktail Shots Market Analysis by Type, Packaging Type, and Distribution Channel Through 2035
RTD Canned Cocktail Market Growth - Convenience & Mixology Trends 2025 to 2035
RTD Bottled Cocktail Market - Size, Share, and Forecast Outlook 2025 to 2035
RTD Coffee Market Size and Share Forecast Outlook 2025 to 2035
RTD Temperature Sensors Market Growth - Trends & Forecast 2025 to 2035
Pre-mixed/RTD Alcoholic Drink Market Analysis - Size, Share, and Forecast Outlook 2025 to 2035
Demand for RTD Whey Deployments for Shelf-stable Drinks in CIS Size and Share Forecast Outlook 2025 to 2035
Dairy-Free RTD Coffee Products Market
Low-calorie RTD Beverages Market Analysis by Product Type, Flavor, Distribution Channel and Region through 2035
Non Alcoholic RTD Beverages Market Size and Share Forecast Outlook 2025 to 2035
Ready to Drink (RTD) Packaging Market Size and Share Forecast Outlook 2025 to 2035
Ready To Drink (RTD) Tea Market Trends - Functional & Refreshing Beverage Growth 2025 to 2035
Demand of Heat Stable Whey for RTD Performance Drinks in EU Size and Share Forecast Outlook 2025 to 2035
Demand of MFGM-enriched Powders & RTDs in European Union Size and Share Forecast Outlook 2025 to 2035
Demand for Whey-plus-Prebiotic Stacks for RTD Shakes in CIS Analysis Size and Share Forecast Outlook 2025 to 2035
Cocktail Shakers Market Size and Share Forecast Outlook 2025 to 2035
Cocktail Syrup Market Analysis by Product Type, Flavor, and Region Through 2035
Premixed Cocktail Shots Market Growth - Consumer Trends 2024 to 2034
Premix Bottled Cocktails Market Trends - Growth & Consumer Shifts 2025 to 2035
Ready-to-Serve Cocktails Market Trends - Innovation & Demand 2025 to 2035

Thank you!
You will receive an email from our Business Development Manager. Please be sure to check your SPAM/JUNK folder too.
Chat With
MaRIA