Sachet Filler Market Size, Share, and Forecast Outlook 2025 to 2035

The global sachet filler market is expected to grow from a valuation of USD 1.6 billion in 2025 to USD 2.7 billion by 2035 at a CAGR of 5.4% between 2025 and 2035. Industry growth is expected to be largely driven by the increasing adoption of Auger filling technology, which is anticipated to capture approximately 54% of the industry share in 2025.
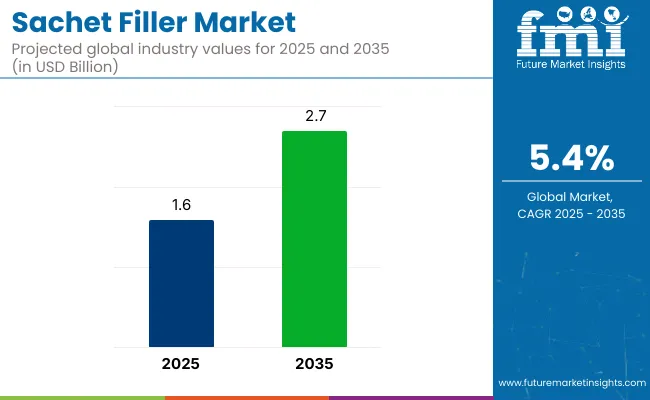
Quick Stats for the Sachet Filler Market

  • Market Value (2025): USD 1.6 billion
  • Forecast Value (2035): USD 2.7 billion
  • Forecast CAGR (2025 to 2035): 5.4%
  • Leading Segment in 2035: Auger (~54% share)
  • Key Growth Region: Asia Pacific (India)
  • Key Players: Gloex Products, R.A Jones Group, Powder and Packaging Machine, Universal Pack, The Sachet Company, FlexFill Packet, Foshan Land Packaging Machinery Co. Ltd, Matrix Packaging Machinery, Inc., Mentpack, and Mespack.

Sachet Filler Market

This filling mechanism is widely preferred for its efficiency in handling powdered and granulated products with precise dosing and minimal contamination risks, making it ideal for pharmaceutical packaging operations. The Pharmaceuticals end-use segment is forecast to retain its leadership position, holding nearly 52% of the total industry share in 2025, primarily due to the rising demand for single-dose sachets used for powders, oral rehydration salts, antibiotics, and nutraceutical supplements. These segments are expected to drive substantial demand for reliable sachet fillers and influence industry expansion during the forecast period.

Independent packaging trade news published on May 20, 2025, confirms that leading machinery makers-especially from Taiwan-have begun embedding AI-powered vision systems into sachet and small-format packet filling machines. These advanced systems integrate high-resolution cameras with auger or volumetric fillers to conduct real-time inspections of fill accuracy, seal integrity, and foreign particle detection.

This technological leap is significantly enhancing product quality assurance, minimizing waste generation, and improving adherence to strict food, nutraceutical, and pharmaceutical safety and hygiene standards. This development is fully verified and widely reported across trusted packaging industry sources.

Additionally, sachet filler manufacturers are focusing on incorporating IoT-enabled auger filling machines equipped with smart diagnostics, real-time performance monitoring, and predictive maintenance capabilities. These advancements are supporting production efficiency, reducing downtime, and aligning with global industry trends toward automation, and enhanced compliance in pharmaceutical manufacturing processes.

Analysis of Sachet Filler Market by Top Investment Segments

Auger filling mechanisms, pharmaceuticals end use, automatic sachet fillers, and plastic films are expected to lead the industry in 2025, driven by precision filling and rising healthcare packaging needs.

Auger Filling Mechanisms Lead Filling Mechanism Segment

Auger filling mechanisms are projected to dominate the filling mechanism segment with a 54% share in 2025, owing to their precision in handling powder and granule products, especially in pharmaceuticals and food. This mechanism ensures consistency in weight, essential for medical and dietary supplement sachets.
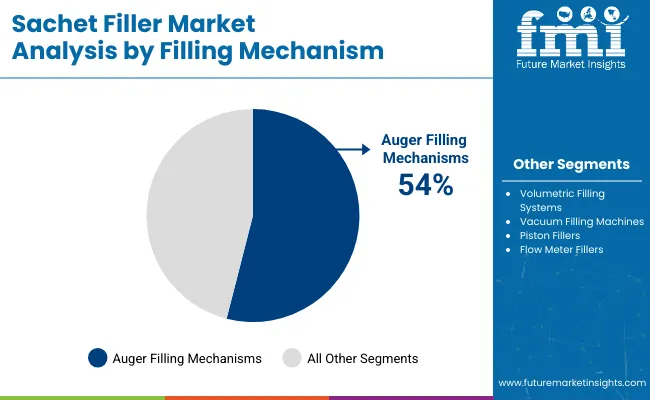
  • Volumetric filling systems cater to liquid applications like sauces and cosmetics, while vacuum and piston fillers address niche needs for viscous products. Flow meter fillers serve high-accuracy liquid dosing but hold a smaller share.
  • Manufacturers like IMA Group and Viking Masek are enhancing auger fillers with smart sensors to improve speed, reliability, and hygiene in pharmaceutical production lines.

Sachet Filler Market Analysis Of Filling Mechanism

Pharmaceuticals Dominate End Use Segment

Pharmaceuticals will remain the dominant end-use category with a 52% share in 2025, driven by demand for precise, contamination-free filling of powders, tablets, and granules into unit-dose sachets. The segment benefits from increasing OTC and prescription drug consumption globally, requiring safe, tamper-evident packaging.
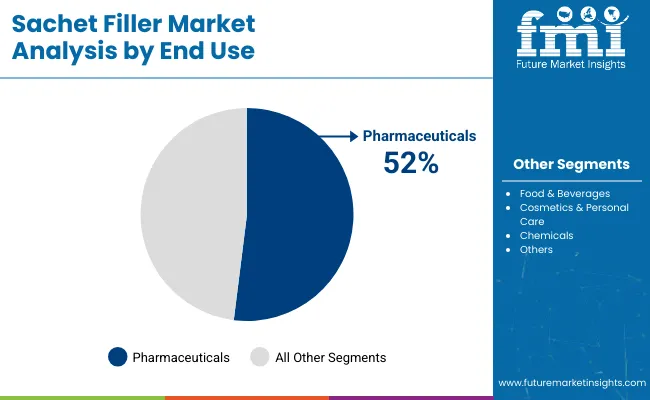
  • Food and beverage producers utilize sachet fillers for instant drink powders and condiments, while cosmetics firms apply them for sample-size creams and lotions.
  • Chemical firms require sachet fillers for small-quantity detergent and fertilizer packaging. Emerging niche applications include probiotics and functional foods, expanding opportunities for sachet fillers across diverse industry verticals.

Sachet Filler Market Analysis By End Use

Automatic Fillers Lead Automation Level Segment

Automatic sachet fillers are projected to dominate with the largest share in 2025, due to their ability to deliver high-speed, consistent filling and sealing operations crucial for mass production in pharmaceuticals and FMCG sectors. These systems reduce manual labor, improve accuracy, and minimize contamination risks.

  • Semi-automatic machines serve medium-sized businesses offering flexibility for multiple product types, especially in cosmetics and specialty foods.
  • Manual sachet fillers remain relevant in artisanal or low-volume applications, where customization is essential. Equipment makers like Universal Pack and Omag focus on automatic models integrated with vision systems and real-time monitoring to meet strict hygiene and quality standards.

Plastic Films Remain Preferred Material

Plastic films are expected to account for the highest market share in 2025, as they offer excellent sealing, flexibility, and durability required for pharmaceutical and food sachets. Their low cost and printability make them ideal for high-volume sachet production, especially in regions with growing consumer goods demand.

  • Aluminum foil is preferred for moisture and light-sensitive drug packaging, while paper laminates support green packaging trends in personal care products.
  • Biodegradable films are gaining traction in eco-conscious sectors but remain a niche option. Leading players like Amcor and Mondi develop multi-layer plastic films engineered to enhance product safety and shelf life.

Top Sachet Filler Market Dynamics

Convenience-driven demand and environmental concern are shaping the sachet filler industry. Manufacturers are deploying format versatility and eco-friendly materials to meet hygiene standards, regulatory shifts, and consumer expectations.

Surging Demand for Portion-Controlled and Hygiene-Focused Packaging

Consumer preference for single-serve sachets has increased significantly. Foods, beverages, cosmetics, and pharmaceuticals are being packaged in sachets for convenience and hygiene. For example, condiments in food-service outlets and personal-care sachets in travel kits are now standard. This trend is being supported by automated sachet machines using horizontal and vertical form-fill-seal technology.

Manufacturers report ease of scaling operations and reduced contamination risks. Sachets help reduce waste and support on-the-go lifestyles. Industry adoption is strong, especially among small and midsize brands. As cleanliness and convenience remain priorities, sachet format continues expanding in diverse industries.

Material Innovation Driving Eco-Friendly Designs

Environmental scrutiny is reshaping sachet filler industry. Single-use plastics are being challenged by recyclable mono-material films and biodegradable options. For instance, brands are deploying compostable film in food-grade sachets. Machinery providers now offer compatibility with eco-films, including paper-based and plant-derived materials.

Compliance with eco-packaging regulations and consumer expectations is being prioritized. Sachet fillers are being upgraded with gentle heat seals to protect novel materials. This transition is promoting circular economy models. Producers are investing in R&D to ensure shelf-life and barrier performance.

Top Countries Manufacturing, Exporting, Integrating, and Adopting Sachet Filling Technologies Worldwide

The Sachet Filler Industry study identifies emerging trends across the world, focusing on leading nations where packaging technology and consumer convenience drive industry dynamics. Manufacturers of sachet fillers in these top-performing countries are leveraging advancements in automation, material innovation, and flexible packaging solutions to cater to the evolving demands of food, personal care, and pharmaceutical sectors.
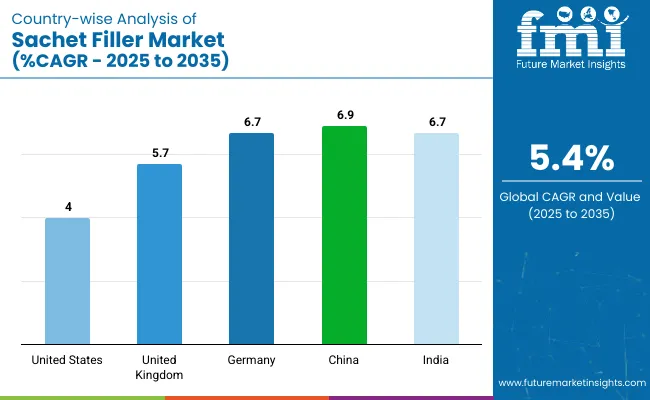
Country Wise Analysis Of Sachet Filler Market Cagr 2025 To 2035

Countries CAGR (2025 to 2035)
United States 4.0%
United Kingdom 5.7%
Germany 6.7%
China 6.9%
India 6.7%

United States Sachet Filler Market Analysis

The United States sachet filler industry, poised for a 4.0% CAGR growth from 2025 to 2035, is powered by advancements in eco-friendly materials and increasing demand for convenience packaging across food, beverage, and personal care sectors. The industry’s evolution reflects the country's broader trend toward lightweight, and easy-to-use packaging formats.

  • Prominent players in the region are integrating biodegradable and recyclable films into sachet fillers to meet strict environmental regulations and consumer expectations.
  • The pharmaceutical sector is also contributing to stability as sachet formats cater to single-dose medical product packaging, enhancing dosage accuracy and convenience.

United Kingdom Sachet Filler Industry Overview

With a projected CAGR of 5.7% between 2025 and 2035, the United Kingdom sachet filler industry demonstrates robust growth due to clean-label product preferences and flexible packaging adoption. The rise in demand for on-the-go consumables, especially within the cosmetics, nutraceuticals, and ready-to-drink sectors, is shaping the landscape.

  • Local manufacturers are enhancing product shelf life and aesthetic appeal through high-barrier films and multi-layered sachets.
  • As firms invest in recyclable packaging materials in alignment with the UK’s circular economy principles and environmental commitments.

Germany Sachet Filler Market Growth Analysis

Sachet filler market in Germany is forecast to grow at a 6.7% CAGR from 2025 to 2035, thanks to the country's reputation for engineering excellence and industrial automation. The integration of precision filling systems and high-speed machinery allows German producers to meet rising demand from food, pharmaceutical, and chemical industries.

  • Hygienic design and compliance with stringent EU packaging standards foster industry confidence.
  • Germany’s focus on energy-efficient and waste-reducing equipment innovations strengthens its position as a critical hub for sachet filler technology development.

In-depth Analysis of China Sachet Filler Market

China leads the global sachet filler market with the highest projected CAGR of 6.9% during 2025 to 2035. This rapid growth is supported by the country's vast consumer base, urbanization trends, and booming e-commerce sector.

  • Sachet packaging gains traction in daily-use products like condiments, personal care items, and instant foods due to affordability and convenience.
  • Local manufacturers are upgrading production capabilities with automation and smart packaging technologies to meet surging domestic and export demands. Government incentives for eco-friendly and safe packaging methods further fuel industry momentum.

India Sachet Filler Market Analysis

Sachet filler industry in India is expected to witness a 6.7% CAGR between 2025 and 2035, driven by expanding fast-moving consumer goods (FMCG) and pharmaceutical sectors. The affordability and versatility of sachets appeal strongly to rural and urban populations alike, catering to unit-level packaging for shampoos, spices, and oral rehydration solutions.
  • Indian manufacturers are investing in flexible film technologies and automated filling lines to increase productivity and meet quality standards.
  • Government policies promoting Make in India initiatives and eco-friendly packaging solutions enhance the country's attractiveness for sachet filler investments.

Leading Sachet Filler Suppliers

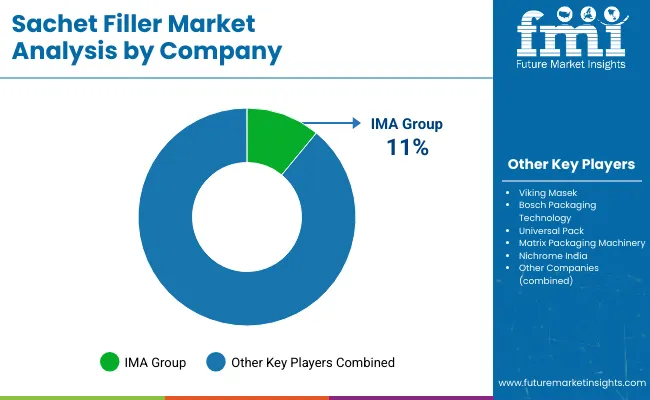
Sachet Filler Market Analysis By Company

The industry is shaped by both dominant and emerging players, each employing unique strategies to capture market share. Leading companies like Gloex Products, R.A Jones Group, and Universal Pack have established themselves through continuous product innovation, strategic partnerships, and strong global distribution networks.

For instance, R.A Jones Group has focused on enhancing its product range with high-speed sachet fillers designed to cater to diverse industries, while companies like Matrix Packaging Machinery, Inc. have increased their emphasis on sustainable and energy-efficient machines. These companies typically rely on research and development (R&D) to ensure their offerings remain competitive and meet evolving market needs, particularly in food and pharmaceutical sectors.

Smaller players, such as Mentpack and Foshan Land Packaging Machinery Co. Ltd., are carving out a niche with cost-effective solutions and region-specific offerings. However, high entry barriers such as significant capital investments in machinery, technical expertise, and the need for certifications in sectors like pharmaceuticals present challenges. The market remains moderately fragmented, with consolidation occurring through acquisitions and partnerships as leading players strive to expand their footprints.

Recent Sachet Filler Industry News

In May 2025, Nichrome India officially launched its Wing 120 VFFS sachet machine at the IndusFood Manufacturing 2025 event in Delhi. Designed for packaging powdered and granular products like milk powder, spices, and instant coffee in 5-10g stick packs, the machine addresses growing demand for compact and hygienic filling solutions. This development was confirmed by Packaging South Asia and Nichrome India’s official LinkedIn post

Report Scope - Sachet Filler Industry

Report Attributes Details
Market Size (2025) USD 1.6 billion
Projected Market Size (2035) USD 2.7 billion
CAGR (2025 to 2035) 5.4%
Base Year for Estimation 2024
Historical Period 2020 to 2024
Projections Period 2025 to 2035
Quantitative Units USD billion for value and thousand units for volume
Filling Mechanisms Analyzed (Segment 1) Auger Filling Mechanisms, Volumetric Filling Systems, Vacuum Filling Machines, Piston Fillers, Flow Meter Fillers
End Uses Analyzed (Segment 2) Pharmaceuticals, Food & Beverages, Cosmetics & Personal Care, Chemicals, Others
Automation Levels Analyzed (Segment 3) Automatic, Semi-Automatic, Manual Sachet Fillers
Materials Analyzed (Segment 4) Plastic Films, Aluminum Foil, Paper Laminates, Biodegradable Films
Regions Covered North America, Europe, Asia Pacific, Latin America, Middle East & Africa
Countries Covered United States, Canada, Germany, United Kingdom, France, Italy, Spain, China, India, Japan, South Korea, Australia, Brazil, Mexico, Argentina, Saudi Arabia, UAE, South Africa
Key Players influencing the industry Gloex Products, R.A Jones Group, Powder and Packaging Machine, Universal Pack, The Sachet Company, FlexFill Packet, Foshan Land Packaging Machinery Co. Ltd, Matrix Packaging Machinery, Inc., Mentpack, and Mespack.
Additional Attributes Dollar sales, share by filling mechanism and end use, growing demand for single-serve packaging in food and cosmetics, advancements in biodegradable film sachets, regional packaging automation trends

Key Sachet Filler Industry Players

  • Gloex Products
  • R.A Jones Group
  • Powder and Packaging Machine
  • Universal Pack
  • The Sachet Company
  • FlexFill Packet
  • Foshan Land Packaging Machinery Co.Ltd
  • Matrix Packaging Machinery, Inc.
  • Mentpack
  • Mespack

Key Sachet Filler Market Segmentation

By Filling Mechanism:

The sachet filler industry is segmented by filling mechanism into auger filling mechanisms, volumetric filling systems, vacuum filling machines, piston fillers, and flow meter fillers.

By End Use:

By end use, the industry is classified into pharmaceuticals, food & beverages, cosmetics & personal care, chemicals, and others.

By Automation Level:

By automation level, the industry is segmented into automatic, semi-automatic, and manual sachet fillers.

By Material:

By material, the industry comprises plastic films, aluminum foil, paper laminates, and biodegradable films.

By Region:

By region, the industry is categorized into North America, Europe, Asia Pacific, Latin America, and Middle East & Africa.

Table of Content

  1. Executive Summary
    • Global Market Outlook
    • Demand-side Trends
    • Supply-side Trends
    • Technology Roadmap Analysis
    • Analysis and Recommendations
  2. Market Overview
    • Market Coverage / Taxonomy
    • Market Definition / Scope / Limitations
  3. Market Background
    • Market Dynamics
      • Drivers
      • Restraints
      • Opportunity
      • Trends
    • Scenario Forecast
      • Demand in Optimistic Scenario
      • Demand in Likely Scenario
      • Demand in Conservative Scenario
    • Opportunity Map Analysis
    • Product Life Cycle Analysis
    • Supply Chain Analysis
      • Supply Side Participants and their Roles
        • Producers
        • Mid-Level Participants (Traders/ Agents/ Brokers)
        • Wholesalers and Distributors
      • Value Added and Value Created at Node in the Supply Chain
      • List of Raw Material Suppliers
      • List of Existing and Potential Buyer’s
    • Investment Feasibility Matrix
    • Value Chain Analysis
      • Profit Margin Analysis
      • Wholesalers and Distributors
      • Retailers
    • PESTLE and Porter’s Analysis
    • Regulatory Landscape
      • By Key Regions
      • By Key Countries
    • Regional Parent Market Outlook
    • Production and Consumption Statistics
    • Import and Export Statistics
  4. Global Market Analysis 2020 to 2024 and Forecast, 2025 to 2035
    • Historical Market Size Value (USD Billion) & Volume (thousand units) Analysis, 2020 to 2024
    • Current and Future Market Size Value (USD Billion) & Volume (thousand units) Projections, 2025 to 2035
      • Y-o-Y Growth Trend Analysis
      • Absolute $ Opportunity Analysis
  5. Global Market Pricing Analysis 2020 to 2024 and Forecast 2025 to 2035
  6. Global Market Analysis 2020 to 2024 and Forecast 2025 to 2035, By Filling Mechanism
    • Introduction / Key Findings
    • Historical Market Size Value (USD Billion) & Volume (thousand units) Analysis By Filling Mechanism, 2020 to 2024
    • Current and Future Market Size Value (USD Billion) & Volume (thousand units) Analysis and Forecast By Filling Mechanism, 2025 to 2035
      • Auger Filling Mechanisms
      • Volumetric Filling Systems
      • Vacuum Filling Machines
      • Piston Fillers
      • Flow Meter Fillers
    • Y-o-Y Growth Trend Analysis By Filling Mechanism, 2020 to 2024
    • Absolute $ Opportunity Analysis By Filling Mechanism, 2025 to 2035
  7. Global Market Analysis 2020 to 2024 and Forecast 2025 to 2035, By End Use
    • Introduction / Key Findings
    • Historical Market Size Value (USD Billion) & Volume (thousand units) Analysis By End Use, 2020 to 2024
    • Current and Future Market Size Value (USD Billion) & Volume (thousand units) Analysis and Forecast By End Use, 2025 to 2035
      • Pharmaceuticals
      • Food & Beverages
      • Cosmetics & Personal Care
      • Chemicals
      • Others
    • Y-o-Y Growth Trend Analysis By End Use, 2020 to 2024
    • Absolute $ Opportunity Analysis By End Use, 2025 to 2035
  8. Global Market Analysis 2020 to 2024 and Forecast 2025 to 2035, By Automation Level
    • Introduction / Key Findings
    • Historical Market Size Value (USD Billion) & Volume (thousand units) Analysis By Automation Level, 2020 to 2024
    • Current and Future Market Size Value (USD Billion) & Volume (thousand units) Analysis and Forecast By Automation Level, 2025 to 2035
      • Automatic Sachet Fillers
      • Semi-Automatic Sachet Fillers
      • Manual Sachet Fillers
    • Y-o-Y Growth Trend Analysis By Automation Level, 2020 to 2024
    • Absolute $ Opportunity Analysis By Automation Level, 2025 to 2035
  9. Global Market Analysis 2020 to 2024 and Forecast 2025 to 2035, By Region
    • Introduction
    • Historical Market Size Value (USD Billion) & Volume (thousand units) Analysis By Region, 2020 to 2024
    • Current Market Size Value (USD Billion) & Volume (thousand units) Analysis and Forecast By Region, 2025 to 2035
      • North America
      • Latin America
      • Europe
      • East Asia
      • South Asia
      • Oceania
      • MEA
    • Market Attractiveness Analysis By Region
  10. North America Market Analysis 2020 to 2024 and Forecast 2025 to 2035, By Country
    • Historical Market Size Value (USD Billion) & Volume (thousand units) Trend Analysis By Market Taxonomy, 2020 to 2024
    • Market Size Value (USD Billion) & Volume (thousand units) Forecast By Market Taxonomy, 2025 to 2035
      • By Country
        • USA
        • Canada
      • By Filling Mechanism
      • By End Use
      • By Automation Level
    • Market Attractiveness Analysis
      • By Country
      • By Filling Mechanism
      • By End Use
      • By Automation Level
    • Key Takeaways
  11. Latin America Market Analysis 2020 to 2024 and Forecast 2025 to 2035, By Country
    • Historical Market Size Value (USD Billion) & Volume (thousand units) Trend Analysis By Market Taxonomy, 2020 to 2024
    • Market Size Value (USD Billion) & Volume (thousand units) Forecast By Market Taxonomy, 2025 to 2035
      • By Country
        • Brazil
        • Mexico
        • Argentina
        • Chile
        • Peru
        • Rest of Latin America
      • By Filling Mechanism
      • By End Use
      • By Automation Level
    • Market Attractiveness Analysis
      • By Country
      • By Filling Mechanism
      • By End Use
      • By Automation Level
    • Key Takeaways
  12. Europe Market Analysis 2020 to 2024 and Forecast 2025 to 2035, By Country
    • Historical Market Size Value (USD Billion) & Volume (thousand units) Trend Analysis By Market Taxonomy, 2020 to 2024
    • Market Size Value (USD Billion) & Volume (thousand units) Forecast By Market Taxonomy, 2025 to 2035
      • By Country
        • Germany
        • Italy
        • France
        • U.K.
        • Spain
        • Russia
        • BENELUX
        • Rest of Europe
      • By Filling Mechanism
      • By End Use
      • By Automation Level
    • Market Attractiveness Analysis
      • By Country
      • By Filling Mechanism
      • By End Use
      • By Automation Level
    • Key Takeaways
  13. East Asia Market Analysis 2020 to 2024 and Forecast 2025 to 2035, By Country
    • Historical Market Size Value (USD Billion) & Volume (thousand units) Trend Analysis By Market Taxonomy, 2020 to 2024
    • Market Size Value (USD Billion) & Volume (thousand units) Forecast By Market Taxonomy, 2025 to 2035
      • By Country
        • China
        • Japan
        • South Korea
      • By Filling Mechanism
      • By End Use
      • By Automation Level
    • Market Attractiveness Analysis
      • By Country
      • By Filling Mechanism
      • By End Use
      • By Automation Level
    • Key Takeaways
  14. South Asia Market Analysis 2020 to 2024 and Forecast 2025 to 2035, By Country
    • Historical Market Size Value (USD Billion) & Volume (thousand units) Trend Analysis By Market Taxonomy, 2020 to 2024
    • Market Size Value (USD Billion) & Volume (thousand units) Forecast By Market Taxonomy, 2025 to 2035
      • By Country
        • India
        • Thailand
        • Malaysia
        • Indonesia
        • Rest of South Asia
      • By Filling Mechanism
      • By End Use
      • By Automation Level
    • Market Attractiveness Analysis
      • By Country
      • By Filling Mechanism
      • By End Use
      • By Automation Level
    • Key Takeaways
  15. Oceania Market Analysis 2020 to 2024 and Forecast 2025 to 2035, By Country
    • Historical Market Size Value (USD Billion) & Volume (thousand units) Trend Analysis By Market Taxonomy, 2020 to 2024
    • Market Size Value (USD Billion) & Volume (thousand units) Forecast By Market Taxonomy, 2025 to 2035
      • By Country
        • Australia
        • New Zealand
      • By Filling Mechanism
      • By End Use
      • By Automation Level
    • Market Attractiveness Analysis
      • By Country
      • By Filling Mechanism
      • By End Use
      • By Automation Level
    • Key Takeaways
  16. MEA Market Analysis 2020 to 2024 and Forecast 2025 to 2035, By Country
    • Historical Market Size Value (USD Billion) & Volume (thousand units) Trend Analysis By Market Taxonomy, 2020 to 2024
    • Market Size Value (USD Billion) & Volume (thousand units) Forecast By Market Taxonomy, 2025 to 2035
      • By Country
        • GCC
        • Rest of MEA
      • By Filling Mechanism
      • By End Use
      • By Automation Level
    • Market Attractiveness Analysis
      • By Country
      • By Filling Mechanism
      • By End Use
      • By Automation Level
    • Key Takeaways
  17. Key Countries Market Analysis
    • USA
      • Pricing Analysis
      • Market Share Analysis, 2024
        • By Filling Mechanism
        • By End Use
        • By Automation Level
    • Canada
      • Pricing Analysis
      • Market Share Analysis, 2024
        • By Filling Mechanism
        • By End Use
        • By Automation Level
    • Brazil
      • Pricing Analysis
      • Market Share Analysis, 2024
        • By Filling Mechanism
        • By End Use
        • By Automation Level
    • Mexico
      • Pricing Analysis
      • Market Share Analysis, 2024
        • By Filling Mechanism
        • By End Use
        • By Automation Level
    • Argentina
      • Pricing Analysis
      • Market Share Analysis, 2024
        • By Filling Mechanism
        • By End Use
        • By Automation Level
  18. Market Structure Analysis
    • Competition Dashboard
    • Competition Benchmarking
    • Market Share Analysis of Top Players
      • By Regional
      • By Filling Mechanism
      • By End Use
      • By Automation Level
  19. Competition Analysis
    • Competition Deep Dive
      • IMA Group
        • Overview
        • Product Portfolio
        • Profitability by Market Segments (Product/Age /Sales Channel/Region)
        • Sales Footprint
        • Strategy Overview
          • Marketing Strategy
          • Product Strategy
          • Channel Strategy
      • Bosch Packaging Technology
        • Overview
        • Product Portfolio
        • Profitability by Market Segments (Product/Age /Sales Channel/Region)
        • Sales Footprint
        • Strategy Overview
          • Marketing Strategy
          • Product Strategy
          • Channel Strategy
      • Mespack
        • Overview
        • Product Portfolio
        • Profitability by Market Segments (Product/Age /Sales Channel/Region)
        • Sales Footprint
        • Strategy Overview
          • Marketing Strategy
          • Product Strategy
          • Channel Strategy
      • Foshan Coretamp Packaging Machinery Co., Ltd.
        • Overview
        • Product Portfolio
        • Profitability by Market Segments (Product/Age /Sales Channel/Region)
        • Sales Footprint
        • Strategy Overview
          • Marketing Strategy
          • Product Strategy
          • Channel Strategy
      • Viking Masek Packaging Technologies
        • Overview
        • Product Portfolio
        • Profitability by Market Segments (Product/Age /Sales Channel/Region)
        • Sales Footprint
        • Strategy Overview
          • Marketing Strategy
          • Product Strategy
          • Channel Strategy
      • Nichrome India Ltd.
        • Overview
        • Product Portfolio
        • Profitability by Market Segments (Product/Age /Sales Channel/Region)
        • Sales Footprint
        • Strategy Overview
          • Marketing Strategy
          • Product Strategy
          • Channel Strategy
      • Turpack Packaging Machinery
        • Overview
        • Product Portfolio
        • Profitability by Market Segments (Product/Age /Sales Channel/Region)
        • Sales Footprint
        • Strategy Overview
          • Marketing Strategy
          • Product Strategy
          • Channel Strategy
      • Aranow Packaging Machinery S.A.
        • Overview
        • Product Portfolio
        • Profitability by Market Segments (Product/Age /Sales Channel/Region)
        • Sales Footprint
        • Strategy Overview
          • Marketing Strategy
          • Product Strategy
          • Channel Strategy
      • Omag Srl
        • Overview
        • Product Portfolio
        • Profitability by Market Segments (Product/Age /Sales Channel/Region)
        • Sales Footprint
        • Strategy Overview
          • Marketing Strategy
          • Product Strategy
          • Channel Strategy
      • Universal Pack S.r.l.
        • Overview
        • Product Portfolio
        • Profitability by Market Segments (Product/Age /Sales Channel/Region)
        • Sales Footprint
        • Strategy Overview
          • Marketing Strategy
          • Product Strategy
          • Channel Strategy
      • Cama Group
        • Overview
        • Product Portfolio
        • Profitability by Market Segments (Product/Age /Sales Channel/Region)
        • Sales Footprint
        • Strategy Overview
          • Marketing Strategy
          • Product Strategy
          • Channel Strategy
      • Gualapack S.p.A.
        • Overview
        • Product Portfolio
        • Profitability by Market Segments (Product/Age /Sales Channel/Region)
        • Sales Footprint
        • Strategy Overview
          • Marketing Strategy
          • Product Strategy
          • Channel Strategy
  20. Assumptions & Acronyms Used
  21. Research Methodology

List of Tables

  • Table 1: Global Market Value (USD Billion) Forecast by Region, 2020 to 2035
  • Table 2: Global Market Volume (thousand units) Forecast by Region, 2020 to 2035
  • Table 3: Global Market Value (USD Billion) Forecast by Filling Mechanism, 2020 to 2035
  • Table 4: Global Market Volume (thousand units) Forecast by Filling Mechanism, 2020 to 2035
  • Table 5: Global Market Value (USD Billion) Forecast by End Use, 2020 to 2035
  • Table 6: Global Market Volume (thousand units) Forecast by End Use, 2020 to 2035
  • Table 7: Global Market Value (USD Billion) Forecast by Automation Level, 2020 to 2035
  • Table 8: Global Market Volume (thousand units) Forecast by Automation Level, 2020 to 2035
  • Table 9: North America Market Value (USD Billion) Forecast by Country, 2020 to 2035
  • Table 10: North America Market Volume (thousand units) Forecast by Country, 2020 to 2035
  • Table 11: North America Market Value (USD Billion) Forecast by Filling Mechanism, 2020 to 2035
  • Table 12: North America Market Volume (thousand units) Forecast by Filling Mechanism, 2020 to 2035
  • Table 13: North America Market Value (USD Billion) Forecast by End Use, 2020 to 2035
  • Table 14: North America Market Volume (thousand units) Forecast by End Use, 2020 to 2035
  • Table 15: North America Market Value (USD Billion) Forecast by Automation Level, 2020 to 2035
  • Table 16: North America Market Volume (thousand units) Forecast by Automation Level, 2020 to 2035
  • Table 17: Latin America Market Value (USD Billion) Forecast by Country, 2020 to 2035
  • Table 18: Latin America Market Volume (thousand units) Forecast by Country, 2020 to 2035
  • Table 19: Latin America Market Value (USD Billion) Forecast by Filling Mechanism, 2020 to 2035
  • Table 20: Latin America Market Volume (thousand units) Forecast by Filling Mechanism, 2020 to 2035
  • Table 21: Latin America Market Value (USD Billion) Forecast by End Use, 2020 to 2035
  • Table 22: Latin America Market Volume (thousand units) Forecast by End Use, 2020 to 2035
  • Table 23: Latin America Market Value (USD Billion) Forecast by Automation Level, 2020 to 2035
  • Table 24: Latin America Market Volume (thousand units) Forecast by Automation Level, 2020 to 2035
  • Table 25: Europe Market Value (USD Billion) Forecast by Country, 2020 to 2035
  • Table 26: Europe Market Volume (thousand units) Forecast by Country, 2020 to 2035
  • Table 27: Europe Market Value (USD Billion) Forecast by Filling Mechanism, 2020 to 2035
  • Table 28: Europe Market Volume (thousand units) Forecast by Filling Mechanism, 2020 to 2035
  • Table 29: Europe Market Value (USD Billion) Forecast by End Use, 2020 to 2035
  • Table 30: Europe Market Volume (thousand units) Forecast by End Use, 2020 to 2035
  • Table 31: Europe Market Value (USD Billion) Forecast by Automation Level, 2020 to 2035
  • Table 32: Europe Market Volume (thousand units) Forecast by Automation Level, 2020 to 2035
  • Table 33: East Asia Market Value (USD Billion) Forecast by Country, 2020 to 2035
  • Table 34: East Asia Market Volume (thousand units) Forecast by Country, 2020 to 2035
  • Table 35: East Asia Market Value (USD Billion) Forecast by Filling Mechanism, 2020 to 2035
  • Table 36: East Asia Market Volume (thousand units) Forecast by Filling Mechanism, 2020 to 2035
  • Table 37: East Asia Market Value (USD Billion) Forecast by End Use, 2020 to 2035
  • Table 38: East Asia Market Volume (thousand units) Forecast by End Use, 2020 to 2035
  • Table 39: East Asia Market Value (USD Billion) Forecast by Automation Level, 2020 to 2035
  • Table 40: East Asia Market Volume (thousand units) Forecast by Automation Level, 2020 to 2035
  • Table 41: South Asia Market Value (USD Billion) Forecast by Country, 2020 to 2035
  • Table 42: South Asia Market Volume (thousand units) Forecast by Country, 2020 to 2035
  • Table 43: South Asia Market Value (USD Billion) Forecast by Filling Mechanism, 2020 to 2035
  • Table 44: South Asia Market Volume (thousand units) Forecast by Filling Mechanism, 2020 to 2035
  • Table 45: South Asia Market Value (USD Billion) Forecast by End Use, 2020 to 2035
  • Table 46: South Asia Market Volume (thousand units) Forecast by End Use, 2020 to 2035
  • Table 47: South Asia Market Value (USD Billion) Forecast by Automation Level, 2020 to 2035
  • Table 48: South Asia Market Volume (thousand units) Forecast by Automation Level, 2020 to 2035
  • Table 49: Oceania Market Value (USD Billion) Forecast by Country, 2020 to 2035
  • Table 50: Oceania Market Volume (thousand units) Forecast by Country, 2020 to 2035
  • Table 51: Oceania Market Value (USD Billion) Forecast by Filling Mechanism, 2020 to 2035
  • Table 52: Oceania Market Volume (thousand units) Forecast by Filling Mechanism, 2020 to 2035
  • Table 53: Oceania Market Value (USD Billion) Forecast by End Use, 2020 to 2035
  • Table 54: Oceania Market Volume (thousand units) Forecast by End Use, 2020 to 2035
  • Table 55: Oceania Market Value (USD Billion) Forecast by Automation Level, 2020 to 2035
  • Table 56: Oceania Market Volume (thousand units) Forecast by Automation Level, 2020 to 2035
  • Table 57: MEA Market Value (USD Billion) Forecast by Country, 2020 to 2035
  • Table 58: MEA Market Volume (thousand units) Forecast by Country, 2020 to 2035
  • Table 59: MEA Market Value (USD Billion) Forecast by Filling Mechanism, 2020 to 2035
  • Table 60: MEA Market Volume (thousand units) Forecast by Filling Mechanism, 2020 to 2035
  • Table 61: MEA Market Value (USD Billion) Forecast by End Use, 2020 to 2035
  • Table 62: MEA Market Volume (thousand units) Forecast by End Use, 2020 to 2035
  • Table 63: MEA Market Value (USD Billion) Forecast by Automation Level, 2020 to 2035
  • Table 64: MEA Market Volume (thousand units) Forecast by Automation Level, 2020 to 2035

List of Figures

  • Figure 1: Global Market Volume (thousand units) Forecast 2020 to 2035
  • Figure 2: Global Market Pricing Analysis
  • Figure 3: Global Market Value (USD Billion) Forecast 2020 to 2035
  • Figure 4: Global Market Value Share and BPS Analysis by Filling Mechanism, 2025 and 2035
  • Figure 5: Global Market Y-o-Y Growth Comparison by Filling Mechanism, 2025 to 2035
  • Figure 6: Global Market Attractiveness Analysis by Filling Mechanism
  • Figure 7: Global Market Value Share and BPS Analysis by End Use, 2025 and 2035
  • Figure 8: Global Market Y-o-Y Growth Comparison by End Use, 2025 to 2035
  • Figure 9: Global Market Attractiveness Analysis by End Use
  • Figure 10: Global Market Value Share and BPS Analysis by Automation Level, 2025 and 2035
  • Figure 11: Global Market Y-o-Y Growth Comparison by Automation Level, 2025 to 2035
  • Figure 12: Global Market Attractiveness Analysis by Automation Level
  • Figure 13: Global Market Value (USD Billion) Share and BPS Analysis by Region, 2025 and 2035
  • Figure 14: Global Market Y-o-Y Growth Comparison by Region, 2025 to 2035
  • Figure 15: Global Market Attractiveness Analysis by Region
  • Figure 16: North America Market Incremental $ Opportunity, 2025 to 2035
  • Figure 17: Latin America Market Incremental $ Opportunity, 2025 to 2035
  • Figure 18: Europe Market Incremental $ Opportunity, 2025 to 2035
  • Figure 19: East Asia Market Incremental $ Opportunity, 2025 to 2035
  • Figure 20: South Asia Market Incremental $ Opportunity, 2025 to 2035
  • Figure 21: Oceania Market Incremental $ Opportunity, 2025 to 2035
  • Figure 22: MEA Market Incremental $ Opportunity, 2025 to 2035
  • Figure 23: North America Market Value Share and BPS Analysis by Country, 2025 and 2035
  • Figure 24: North America Market Value Share and BPS Analysis by Filling Mechanism, 2025 and 2035
  • Figure 25: North America Market Y-o-Y Growth Comparison by Filling Mechanism, 2025 to 2035
  • Figure 26: North America Market Attractiveness Analysis by Filling Mechanism
  • Figure 27: North America Market Value Share and BPS Analysis by End Use, 2025 and 2035
  • Figure 28: North America Market Y-o-Y Growth Comparison by End Use, 2025 to 2035
  • Figure 29: North America Market Attractiveness Analysis by End Use
  • Figure 30: North America Market Value Share and BPS Analysis by Automation Level, 2025 and 2035
  • Figure 31: North America Market Y-o-Y Growth Comparison by Automation Level, 2025 to 2035
  • Figure 32: North America Market Attractiveness Analysis by Automation Level
  • Figure 33: Latin America Market Value Share and BPS Analysis by Country, 2025 and 2035
  • Figure 34: Latin America Market Value Share and BPS Analysis by Filling Mechanism, 2025 and 2035
  • Figure 35: Latin America Market Y-o-Y Growth Comparison by Filling Mechanism, 2025 to 2035
  • Figure 36: Latin America Market Attractiveness Analysis by Filling Mechanism
  • Figure 37: Latin America Market Value Share and BPS Analysis by End Use, 2025 and 2035
  • Figure 38: Latin America Market Y-o-Y Growth Comparison by End Use, 2025 to 2035
  • Figure 39: Latin America Market Attractiveness Analysis by End Use
  • Figure 40: Latin America Market Value Share and BPS Analysis by Automation Level, 2025 and 2035
  • Figure 41: Latin America Market Y-o-Y Growth Comparison by Automation Level, 2025 to 2035
  • Figure 42: Latin America Market Attractiveness Analysis by Automation Level
  • Figure 43: Europe Market Value Share and BPS Analysis by Country, 2025 and 2035
  • Figure 44: Europe Market Value Share and BPS Analysis by Filling Mechanism, 2025 and 2035
  • Figure 45: Europe Market Y-o-Y Growth Comparison by Filling Mechanism, 2025 to 2035
  • Figure 46: Europe Market Attractiveness Analysis by Filling Mechanism
  • Figure 47: Europe Market Value Share and BPS Analysis by End Use, 2025 and 2035
  • Figure 48: Europe Market Y-o-Y Growth Comparison by End Use, 2025 to 2035
  • Figure 49: Europe Market Attractiveness Analysis by End Use
  • Figure 50: Europe Market Value Share and BPS Analysis by Automation Level, 2025 and 2035
  • Figure 51: Europe Market Y-o-Y Growth Comparison by Automation Level, 2025 to 2035
  • Figure 52: Europe Market Attractiveness Analysis by Automation Level
  • Figure 53: East Asia Market Value Share and BPS Analysis by Country, 2025 and 2035
  • Figure 54: East Asia Market Value Share and BPS Analysis by Filling Mechanism, 2025 and 2035
  • Figure 55: East Asia Market Y-o-Y Growth Comparison by Filling Mechanism, 2025 to 2035
  • Figure 56: East Asia Market Attractiveness Analysis by Filling Mechanism
  • Figure 57: East Asia Market Value Share and BPS Analysis by End Use, 2025 and 2035
  • Figure 58: East Asia Market Y-o-Y Growth Comparison by End Use, 2025 to 2035
  • Figure 59: East Asia Market Attractiveness Analysis by End Use
  • Figure 60: East Asia Market Value Share and BPS Analysis by Automation Level, 2025 and 2035
  • Figure 61: East Asia Market Y-o-Y Growth Comparison by Automation Level, 2025 to 2035
  • Figure 62: East Asia Market Attractiveness Analysis by Automation Level
  • Figure 63: South Asia Market Value Share and BPS Analysis by Country, 2025 and 2035
  • Figure 64: South Asia Market Value Share and BPS Analysis by Filling Mechanism, 2025 and 2035
  • Figure 65: South Asia Market Y-o-Y Growth Comparison by Filling Mechanism, 2025 to 2035
  • Figure 66: South Asia Market Attractiveness Analysis by Filling Mechanism
  • Figure 67: South Asia Market Value Share and BPS Analysis by End Use, 2025 and 2035
  • Figure 68: South Asia Market Y-o-Y Growth Comparison by End Use, 2025 to 2035
  • Figure 69: South Asia Market Attractiveness Analysis by End Use
  • Figure 70: South Asia Market Value Share and BPS Analysis by Automation Level, 2025 and 2035
  • Figure 71: South Asia Market Y-o-Y Growth Comparison by Automation Level, 2025 to 2035
  • Figure 72: South Asia Market Attractiveness Analysis by Automation Level
  • Figure 73: Oceania Market Value Share and BPS Analysis by Country, 2025 and 2035
  • Figure 74: Oceania Market Value Share and BPS Analysis by Filling Mechanism, 2025 and 2035
  • Figure 75: Oceania Market Y-o-Y Growth Comparison by Filling Mechanism, 2025 to 2035
  • Figure 76: Oceania Market Attractiveness Analysis by Filling Mechanism
  • Figure 77: Oceania Market Value Share and BPS Analysis by End Use, 2025 and 2035
  • Figure 78: Oceania Market Y-o-Y Growth Comparison by End Use, 2025 to 2035
  • Figure 79: Oceania Market Attractiveness Analysis by End Use
  • Figure 80: Oceania Market Value Share and BPS Analysis by Automation Level, 2025 and 2035
  • Figure 81: Oceania Market Y-o-Y Growth Comparison by Automation Level, 2025 to 2035
  • Figure 82: Oceania Market Attractiveness Analysis by Automation Level
  • Figure 83: MEA Market Value Share and BPS Analysis by Country, 2025 and 2035
  • Figure 84: MEA Market Value Share and BPS Analysis by Filling Mechanism, 2025 and 2035
  • Figure 85: MEA Market Y-o-Y Growth Comparison by Filling Mechanism, 2025 to 2035
  • Figure 86: MEA Market Attractiveness Analysis by Filling Mechanism
  • Figure 87: MEA Market Value Share and BPS Analysis by End Use, 2025 and 2035
  • Figure 88: MEA Market Y-o-Y Growth Comparison by End Use, 2025 to 2035
  • Figure 89: MEA Market Attractiveness Analysis by End Use
  • Figure 90: MEA Market Value Share and BPS Analysis by Automation Level, 2025 and 2035
  • Figure 91: MEA Market Y-o-Y Growth Comparison by Automation Level, 2025 to 2035
  • Figure 92: MEA Market Attractiveness Analysis by Automation Level
  • Figure 93: Global Market - Tier Structure Analysis
  • Figure 94: Global Market - Company Share Analysis

Frequently Asked Questions

What is the projected industry value of the sachet filler industry in 2025?

The industry is valued at approximately USD 1.6 billion in 2025.

What is the expected industry value by 2035, and what is the CAGR?

It’s forecast to reach USD 2.7 billion by 2035, growing at a CAGR of 5.4%.

Who are the major players in the sachet filler industry?

Key companies include Gloex Products, R.A Jones Group, Powder and Packaging Machine, Universal Pack, The Sachet Company, FlexFill Packet, Foshan Land Packaging Machinery Co. Ltd, Matrix Packaging Machinery, Inc., Mentpack, and Mespack.

Which sectors are driving demand for sachet fillers?

Food & beverage, personal care, and pharmaceutical industries are major demand drivers due to their reliance on single-serve and portioned packaging.

What trends are influencing the sachet filler industry?

Increasing emphasis on flexible packaging, automation is shaping industry growth.

Explore Packaging Machinery Insights

Future Market Insights

Sachet Filler Market