Server Security Market
Market Insights on Server Security covering sales outlook, demand forecast & up-to-date key trends
Server Security Market By Solution, Deployment, Enterprise Size, Industry & Region | Forecast 2022 to 2032
Server Security Market Outlook (2022 to 2032)
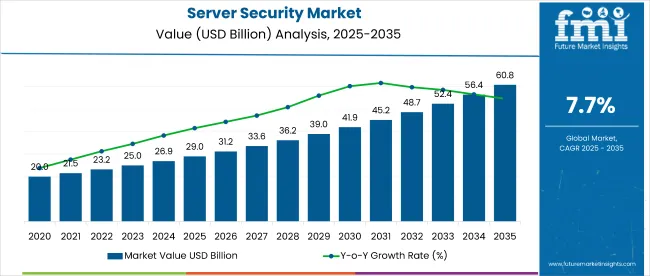
The global server security market was worth US$ 24.7 Billion in 2021. The server security market is expected to reach US$ 51.7 Billion by 2032, growing at a CAGR of 7.1% from 2022 to 2032.
Attribute |
Key Statistics |
Global Server Security Market Estimated Size (2022E) |
US$ 26.1 Billion |
Projected Market Valuation (2032F) |
US$ 51.7 Billion |
Value-based CAGR (2022 to 2032) |
7.1% |
Collective Value Share: Top 5 Companies (2022E) |
Around 45% |
Server security focuses on network protection and resources held on the servers, as well as physical server protection. In recent years, hackers are coming up with more sophisticated and advanced tools to execute cyber-attacks across private and public networks.
These types of network attacks are negatively impacting a company’s revenue, performance, customer relationships, and corresponding trust between the customer and the system. To avoid such losses, demand for server security solutions is increasing continuously in the global market. On account of this, server security currently holds nearly 35% of the global cybersecurity market share.
Don't pay for what you don't need
Customize your report by selecting specific countries or regions and save 30%!
2017 to 2021 Server Security Demand Outlook Compared to 2022 to 2032 Forecast
Demand for server security solutions is estimated to grow at 7.1% CAGR between 2022 and 2032, as compared to 5.0% CAGR during the historic period (2017 to 2021). Growth is attributed to the increasing number of cyber-attacks and online frauds across SMEs and large-scale industries.
Also, the adoption of network security solutions was prominent during the historic period. With the help of server security solutions, organizations can protect their entire network infrastructure from sophisticated cyber-attacks like denial-of-service (DoS), distributed denial-of-service (DDOS) attacks, TCP SYN flood attacks, botnets, and session hijacking.
In recent years, rising internet penetration globally has led to a significant surge in the incidence of network-based attacks. Due to the expansion of the cyber threat landscape, cybersecurity has become a major concern for both public and private industries.
Many servers such as web, email, database, infrastructure management, and file servers process or store sensitive information for organizations. Thus, for protecting their confidential data, organizations will continue to adopt server security software, including network firewalls, unified threat management solutions, DDoS mitigation solutions, endpoint protection platforms, and other network security solutions.
Spurred by the aforementioned factors, sales of server security solutions are expected to surge in the upcoming decade.
Country-wise Insights
How is the USA Server Security Solutions Market Progressing?
Rising Number of Server-based Attacks to Push Growth in the USA
The USA is expected to account for about 81% of the North America server security market in 2022. Early adoption of server security solutions and the presence of major vendors in the country is expected to drive the market in the USA
Also, an increasing number of sophisticated cyber-attacks, cyber thefts, and online frauds is set to boost growth in the country. Rising awareness about cyber-security across the country is expected to create new opportunities for companies in the server security market.
For instance, in March 2022, the USA government published a statement for public and private organizations to improve their cyber-security policies on the back of the Russia and Ukraine conflict. In addition to that, the government is planning to refurbish its current cyber security policies to protect private and public network infrastructures from malicious actions during the forecast period.
Why is the Adoption of Server Security Solutions Increasing in India?
Increasing Ransomware Attacks in Various Industries to Aid Growth
The India server security market is expected to hold nearly 30.4% of the South Asia & Pacific market share throughout 2032. An increasing number of state-of-the-art cyber-attacks and data thefts in industries such as IT & telecom, healthcare, banking, e-commerce, and retail is projected to aid growth.
As per FMI, in 2021, more than 80% of Indian enterprises experienced ransomware attacks, and 10% of companies witnessed data thefts by cyber-criminals. Thus, government agencies are conducting awareness programs to educate people regarding the importance of a robust network security system, which is set to drive sales of server security solutions in India.
What is the South Korea Server Security Market Outlook?
Companies Are Adopting Novel Solutions to Protect their Network Infrastructure
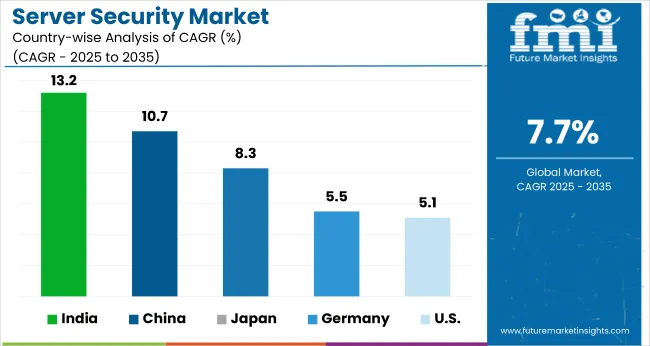
The server security market in South Korea is estimated to grow at 11.9% CAGR between 2022 and 2032. It is considered to be one of the most digitally connected countries in the world.
Various well-established industries, including electronics, telecommunications, automobiles, chemicals, shipbuilding, and steel are expected to adopt advanced technologies like industrial software solutions to improve their business performance.
The implementation of stringent cybersecurity policies in South Korea to strengthen its institutional resilience is likely to boost the adoption of server security solutions such as network firewalls and DDoS mitigation solutions.
Find your sweet spots for generating winning opportunities in this market.
Talk to AnalystCategory-wise Insights
Which is the Most Preferred Server Security Solution in the Global Market?
Network Firewalls to Gain Traction in the Global Market by 2032
By solution, the network firewalls sub-segment under the software segment is expected to be driven by high demand for advanced privacy and network security solutions. Ongoing digital transformation and cyber-attacks in the IT & telecom industry, the introduction of administrative regulations, and the need for real-time server monitoring are also set to spur the demand for network security firewalls.
Further, increasing adoption of web applications, cloud technologies, and web servers is projected to aid the segment. High demand for cybersecurity services across various industries to reduce the risk of cyber-attacks, online frauds, and data thefts is also driving growth in the network firewalls sub-segment.
Why Are Small and Mid-Sized Enterprises (SMEs) Installing Server Security Solutions?
SMEs to Adopt Robust Security Solutions to Avoid Server-based Attacks
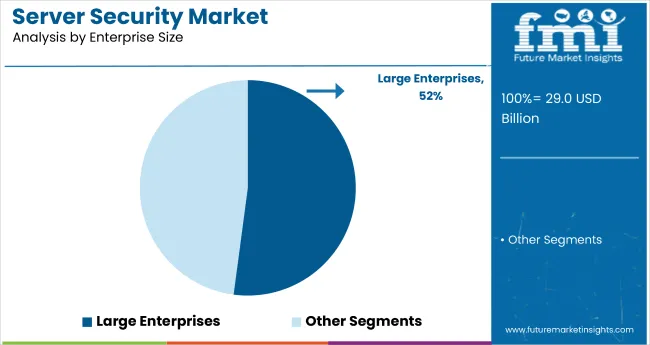
By enterprise size, the small and mid-sized enterprises (SMEs) segment is expected to grow 2.3x in the forecast period in the global server security market. Rising awareness of network security and an increasing number of cyber-attacks across various industries are expected to drive demand for server security solutions in SMEs.
Cyber-criminals often target servers as the majority of the sensitive information of companies is maintained and stored on them. Malware and phishing attacks are considered to be the major threats to SMEs. To protect their network and data on servers from cyber-criminals, SMEs are expected to continue to adopt server security solutions across the globe.
Why is the Deployment of Server Security Solutions Increasing in the Healthcare Industry?
Urgent Need for Real-time Server Monitoring to Fuel Growth
Increasing adoption of innovative technologies such as IoT devices in the healthcare industry for creating or maintaining patient profiles and accessing disease and treatment-related data is set to surge healthcare cyber security issues. The healthcare industry is thus expected to adopt server security solutions to protect sensitive information from cyber-criminals and avoid software downtime, as well as financial losses.
Competitive Landscape
Leading server security solution providers are focusing on various strategies to increase their Drivers, Restraints, Opportunities, and Threats investments. They are striving to improve their technology and expand their product portfolios to meet numerous market requirements.
Meanwhile, some of the other firms are acquiring and forming partnerships with start-up companies in order to create their own server security solutions for catering to the high consumer demand.
- In March 2021, Microsoft launched the next-generation server security solution, Windows Server 2022. It comes with security improvements and offers a safe platform for the Windows server. The new server also enhances hybrid server management in the Windows admin center by boosting performance monitoring and event alerting.
- In February 2020, Memset announced a new server line that combines flexible server capacity with data security. The new server line offers data security and can handle a large volume of data. It can also support busy websites and provide an entire suite of Memset security solutions, including intrusion detection, vulnerability management, external firewall, penetration testing, assuring comprehensive 24/7/365 protection, server safety, and data locking down.
Get the data you need at a Fraction of the cost
Personalize your report by choosing insights you need
and save 40%!
Scope of the Report
Attribute |
Details |
Estimated Market Size (2022) |
US$ 26.1 Billion |
Projected Market Valuation (2032) |
US$ 51.7 Billion |
Value-based CAGR (2022 to 2032) |
7.1% |
Forecast Period |
2022 to 2032 |
Historical Data Available for |
2017 to 2021 |
Market Analysis |
US$ Billion for Value |
Key Regions Covered |
North America, Latin America, Europe, East Asia, South Asia & Pacific, and the Middle East & Africa |
Key Countries Covered |
USA, Canada, Germany, United Kingdom, France, Italy, Spain, Russia, China, Japan, South Korea, India, Malaysia, Indonesia, Singapore, Australia & New Zealand, GCC Countries, Turkey, North Africa, and South Africa |
Key Segments Covered |
The solution, Deployment, Enterprise Size, Industry, and Region |
Key Companies Profiled |
|
Report Coverage |
Market forecast, company share analysis, competition intelligence, Drivers, Restraints, Opportunities and Threats analysis, market dynamics and challenges, and strategic growth initiatives |
Global Server Security Market Outlook by Category
By Solution:
- Software
- Network Firewalls
- Unified Threat Management Solution
- DDoS Mitigation Solution
- Endpoint Protection Platforms
- Others
- Services
- Professional Services
- Security Consulting
- Implementation Services
- Integration Services
- Support & maintenance
- Managed Services
- Professional Services
By Deployment:
- On-Premises
- Cloud-based
By Enterprise Size:
- Large Enterprises
- Small and Mid-Sized Enterprises (SMEs)
By Industry:
- IT & Telecom
- BFSI
- Government & Defense
- Healthcare
- Retail
- Manufacturing
- Education
- Others
By Region:
- North America
- Latin America
- Europe
- East Asia
- South Asia & Pacific
- Middle East and Africa
Frequently Asked Questions
Which region is expected to showcase high growth in server security market?
South Asia & Pacific is projected to register high growth in the market and exhibit a CAGR of nearly 10.2% during the forecast period.
How much is the global server security market worth?
The global server security market was valued at US$ 24.7 billion in 2021 and is estimated to grow at an exceptional pace with a CAGR of 7.1% from 2022 to 2032.
What will be the demand outlook for the server security market?
Sales of server security solutions are expected to total US$ 26.1 Billion by the end of 2022 and are likely to reach US$ 51.7 Billion by 2032.
What was the CAGR of the global server security market in the historic period?
The global server security market grew at a CAGR of 5.0% in the historic period (2017 to 2021).
Which factor is driving the demand for server security solutions?
A growing number of cyber-attacks across the IoT ecosystem is driving demand for server security solutions.
Which are the top 5 countries in the server security market?
The top 5 countries in the server security market are the USA, India, Indonesia, South Korea, and Germany.
What is the Germany server security market outlook?
Germany is expected to account for nearly 6.2% of the Europe market share through 2032.
What is the South Korea and Japan server security market outlook?
The server security market in Japan and South Korea was valued at US$ 1,552.5 Million and US$ 1,219.5 Million in 2021, respectively.
Who are some of the leading companies offering server security solutions?
Some of the leading companies in the server security market are IBM, Sophos, Palo Alto Networks, DDoS-Guard, Nexusguard, Fortinet, Barracuda Networks, and WatchGuard.
Table of Content
1. Executive Summary | Server Security Market 1.1. Global Market Outlook 1.2. Demand Side Trends 1.3. Supply Side Trends 1.4. Analysis and Recommendations 2. Market Overview 2.1. Market Coverage / Taxonomy 2.2. Market Definition / Scope / Limitations 3. Key Market Trends 3.1. Key Trends Impacting the Market 3.2. Product Innovation / Development Trends 4. Pricing Analysis 4.1. Pricing Analysis, By Solution 4.2. Global Average Pricing Analysis Benchmark 5. Global Market Demand (in Value in US$ Billion) Analysis 2017 to 2021 and Forecast, 2022 to 2032 5.1. Historical Market Value (US$ Billion) Analysis, 2017 to 2021 5.2. Current and Future Market Value (US$ Billion) Projections, 2022 to 2032 5.2.1. Y-o-Y Growth Trend Analysis 5.2.2. Absolute $ Opportunity Analysis 6. Market Background 6.1. Macro-Economic Factors 6.2. Forecast Factors - Relevance & Impact 6.3. Value Chain Analysis 6.4. COVID-19 Crisis - Impact Assessment 6.4.1. Current Statistics 6.4.2. Short-Mid-Long Term Outlook 6.4.3. Likely Rebound 6.5. Market Dynamics 6.5.1. Drivers 6.5.2. Restraints 6.5.3. Opportunities 7. Global Market Analysis 2017 to 2021 and Forecast 2022 to 2032, By Solution 7.1. Introduction / Key Findings 7.2. Historical Market Size (US$ Billion) Analysis By Solution, 2017 to 2021 7.3. Current and Future Market Size (US$ Billion) Analysis and Forecast by Solution, 2022 to 2032 7.3.1. Software 7.3.1.1. Network Firewalls 7.3.1.2. Unified Threat Management Solution 7.3.1.3. DDoS Mitigation Solution 7.3.1.4. Endpoint Protection Platforms 7.3.1.5. Others 7.3.2. Services 7.3.2.1. Professional Services 7.3.2.1.1. Security Consulting 7.3.2.1.2. Implementation Services 7.3.2.1.3. Integration Services 7.3.2.1.4. Support & Maintenance 7.3.2.2. Managed Services 7.4. Market Attractiveness Analysis by Solution 8. Global Market Analysis 2017 to 2021 and Forecast 2022 to 2032, By Deployment 8.1. Introduction / Key Findings 8.2. Historical Market Size (US$ Billion) Analysis by Deployment, 2017 to 2021 8.3. Current and Future Market Size (US$ Billion) Analysis and Forecast by Deployment, 2022 to 2032 8.3.1. Cloud-based 8.3.2. On-premises 8.4. Market Attractiveness Analysis By Deployment 9. Global Market Analysis 2017 to 2021 and Forecast 2022 to 2032, By Enterprise Size 9.1. Introduction / Key Findings 9.2. Historical Market Size (US$ Billion) Analysis by Enterprise Size, 2017 to 2021 9.3. Current and Future Market Size (US$ Billion) Analysis and Forecast by Enterprise Size, 2022 to 2032 9.3.1. Large Enterprises 9.3.2. Small and Mid-Sized Enterprises (SMEs) 9.4. Market Attractiveness Analysis by Enterprise Size 10. Global Market Analysis 2017 to 2021 and Forecast 2022 to 2032, By Industry 10.1. Introduction / Key Findings 10.2. Historical Market Size (US$ Billion) Analysis by Industry, 2017 to 2021 10.3. Current and Future Market Size (US$ Billion) Analysis and Forecast by Industry, 2022 to 2032 10.3.1. IT & Telecom 10.3.2. BFSI 10.3.3. Healthcare 10.3.4. Retail 10.3.5. Manufacturing 10.3.6. Government & Defence 10.3.7. Education 10.3.8. Others 10.4. Market Attractiveness Analysis by Industry 11. Global Market Analysis 2017 to 2021 and Forecast 2022 to 2032, by Region 11.1. Introduction / Key Findings 11.2. Historical Market Size (US$ Billion) Analysis by Region, 2017 to 2021 11.3. Current Market Size (US$ Billion) Analysis and Forecast by Region, 2022 to 2032 11.3.1. North America 11.3.2. Latin America 11.3.3. Europe 11.3.4. East Asia 11.3.5. South Asia & Pacific 11.3.6. Middle East and Africa 11.4. Market Attractiveness Analysis by Region 12. North America Market Analysis 2017 to 2021 and Forecast 2022 to 2032 12.1. Introduction / Key Findings 12.2. Historical Market Size (US$ Billion) Analysis by Market Taxonomy, 2017 to 2021 12.3. Market Size (US$ Billion) Forecast by Market Taxonomy, 2022 to 2032 12.3.1. By Country 12.3.1.1. USA 12.3.1.2. Canada 12.3.2. By Solution 12.3.3. By Deployment 12.3.4. By Enterprise Size 12.3.5. By Industry 12.4. Market Attractiveness Analysis 12.4.1. By Country 12.4.2. By Solution 12.4.3. By Deployment 12.4.4. By Enterprise Size 12.4.5. By Industry 13. Latin America Market Analysis 2017 to 2021 and Forecast 2022 to 2032 13.1. Introduction / Key Findings 13.2. Historical Market Size (US$ Billion) Analysis by Market Taxonomy, 2017 to 2021 13.3. Market Size (US$ Billion) Forecast by Market Taxonomy, 2022 to 2032 13.3.1. By Country 13.3.1.1. Brazil 13.3.1.2. Mexico 13.3.1.3. Rest of Latin America 13.3.2. By Solution 13.3.3. By Deployment 13.3.4. By Enterprise Size 13.3.5. By Industry 13.4. Market Attractiveness Analysis 13.4.1. By Country 13.4.2. By Solution 13.4.3. By Deployment 13.4.4. By Enterprise Size 13.4.5. By Industry 14. Europe Market Analysis 2017 to 2021 and Forecast 2022 to 2032 14.1. Introduction / Key Findings 14.2. Historical Market Size (US$ Billion) Analysis by Market Taxonomy, 2017 to 2021 14.3. Market Size (US$ Billion) Forecast by Market Taxonomy, 2022 to 2032 14.3.1. By Country 14.3.1.1. United Kingdom 14.3.1.2. France 14.3.1.3. Germany 14.3.1.4. Italy 14.3.1.5. Spain 14.3.1.6. BENELUX 14.3.1.7. Russia 14.3.1.8. Rest of Europe 14.3.2. By Solution 14.3.3. By Deployment 14.3.4. By Enterprise Size 14.3.5. By Industry 14.4. Market Attractiveness Analysis 14.4.1. By Country 14.4.2. By Solution 14.4.3. By Deployment 14.4.4. By Enterprise Size 14.4.5. By Industry 15. East Asia Market Analysis 2017 to 2021 and Forecast 2022 to 2032 15.1. Introduction / Key Findings 15.2. Historical Market Size (US$ Billion) Analysis by Market Taxonomy, 2017 to 2021 15.3. Market Size (US$ Billion) Forecast by Market Taxonomy, 2022 to 2032 15.3.1. By Country 15.3.1.1. China 15.3.1.2. Japan 15.3.1.3. South Korea 15.3.2. By Solution 15.3.3. By Deployment 15.3.4. By Enterprise Size 15.3.5. By Industry 15.4. Market Attractiveness Analysis 15.4.1. By Country 15.4.2. By Solution 15.4.3. By Deployment 15.4.4. By Enterprise Size 15.4.5. By Industry 16. South Asia & Pacific Market Analysis 2017 to 2021 and Forecast 2022 to 2032 16.1. Introduction / Key Findings 16.2. Historical Market Size (US$ Billion) Analysis by Market Taxonomy, 2017 to 2021 16.3. Market Size (US$ Billion) Forecast by Market Taxonomy, 2022 to 2032 16.3.1. By Country 16.3.1.1. India 16.3.1.2. ASEAN 16.3.1.3. Australia & New Zealand 16.3.1.4. Rest of South Asia & Pacific 16.3.2. By Solution 16.3.3. By Deployment 16.3.4. By Enterprise Size 16.3.5. By Industry 16.4. Market Attractiveness Analysis 16.4.1. By Country 16.4.2. By Solution 16.4.3. By Deployment 16.4.4. By Enterprise Size 16.4.5. By Industry 17. Middle East and Africa Market Analysis 2017 to 2021 and Forecast 2022 to 2032 17.1. Introduction / Key Findings 17.2. Historical Market Size (US$ Billion) Analysis by Market Taxonomy, 2017 to 2021 17.3. Market Size (US$ Billion) Forecast by Market Taxonomy, 2022 to 2032 17.3.1. By Country 17.3.1.1. GCC Countries 17.3.1.2. Turkey 17.3.1.3. South Africa 17.3.1.4. Rest of Middle East and Africa 17.3.2. By Solution 17.3.3. By Deployment 17.3.4. By Enterprise Size 17.3.5. By Industry 17.4. Market Attractiveness Analysis 17.4.1. By Country 17.4.2. By Solution 17.4.3. By Deployment 17.4.4. By Enterprise Size 17.4.5. By Industry 18. Key Country Analysis- Market Analysis 18.1. USA Market 18.1.1. By Solution 18.1.2. By Deployment 18.1.3. By Enterprise Size 18.1.4. By Industry 18.2. Canada Market 18.2.1. By Solution 18.2.2. By Deployment 18.2.3. By Enterprise Size 18.2.4. By Industry 18.3. Brazil Market 18.3.1. By Solution 18.3.2. By Deployment 18.3.3. By Enterprise Size 18.3.4. By Industry 18.4. Mexico Market 18.4.1. By Solution 18.4.2. By Deployment 18.4.3. By Enterprise Size 18.4.4. By Industry 18.5. United Kingdom Market 18.5.1. By Solution 18.5.2. By Deployment 18.5.3. By Enterprise Size 18.5.4. By Industry 18.6. Germany Market 18.6.1. By Solution 18.6.2. By Deployment 18.6.3. By Enterprise Size 18.6.4. By Industry 18.7. France Market 18.7.1. By Solution 18.7.2. By Deployment 18.7.3. By Enterprise Size 18.7.4. By Industry 18.8. Spain Market 18.8.1. By Solution 18.8.2. By Deployment 18.8.3. By Enterprise Size 18.8.4. By Industry 18.9. Italy Market 18.9.1. By Solution 18.9.2. By Deployment 18.9.3. By Enterprise Size 18.9.4. By Industry 18.10. BENELUX Market 18.10.1. By Solution 18.10.2. By Deployment 18.10.3. By Enterprise Size 18.10.4. By Industry 18.11. Russia Market 18.11.1. By Solution 18.11.2. By Deployment 18.11.3. By Enterprise Size 18.11.4. By Industry 18.12. China Market 18.12.1. By Solution 18.12.2. By Deployment 18.12.3. By Enterprise Size 18.12.4. By Industry 18.13. Japan Market 18.13.1. By Solution 18.13.2. By Deployment 18.13.3. By Enterprise Size 18.13.4. By Industry 18.14. South Korea Market 18.14.1. By Solution 18.14.2. By Deployment 18.14.3. By Enterprise Size 18.14.4. By Industry 18.15. India Market 18.15.1. By Solution 18.15.2. By Deployment 18.15.3. By Enterprise Size 18.15.4. By Industry 18.16. ASEAN Market 18.16.1. By Solution 18.16.2. By Deployment 18.16.3. By Enterprise Size 18.16.4. By Industry 18.17. Australia & New Zealand Market 18.17.1. By Solution 18.17.2. By Deployment 18.17.3. By Enterprise Size 18.17.4. By Industry 18.18. GCC Countries Market 18.18.1. By Solution 18.18.2. By Deployment 18.18.3. By Enterprise Size 18.18.4. By Industry 18.19. Turkey Market 18.19.1. By Solution 18.19.2. By Deployment 18.19.3. By Enterprise Size 18.19.4. By Industry 18.20. South Africa Market 18.20.1. By Solution 18.20.2. By Deployment 18.20.3. By Enterprise Size 18.20.4. By Industry 19. Market Structure Analysis 19.1. Market Analysis by Tier of Companies 19.2. Market Share Analysis of Top Players 19.3. Market Presence Analysis, Regional footprint by Players 20. Competition Analysis 20.1. Competition Dashboard 20.2. Competition Deep Dive 20.2.1. IBM 20.2.1.1. Business Overview 20.2.1.2. Product/Service Portfolio 20.2.1.3. Profitability by Market Segments (Business Segment/Region) 20.2.1.4. Sales Footprint 20.2.1.5. Strategy Overview 20.2.2. Sophos 20.2.2.1. Business Overview 20.2.2.2. Product/Service Portfolio 20.2.2.3. Profitability by Market Segments (Business Segment/Region) 20.2.2.4. Sales Footprint 20.2.2.5. Strategy Overview 20.2.3. Palo Alto Networks 20.2.3.1. Business Overview 20.2.3.2. Product/Service Portfolio 20.2.3.3. Profitability by Market Segments (Business Segment/Region) 20.2.3.4. Sales Footprint 20.2.3.5. Strategy Overview 20.2.4. Cloudflare 20.2.4.1. Business Overview 20.2.4.2. Product/Service Portfolio 20.2.4.3. Profitability by Market Segments (Business Segment/Region) 20.2.4.4. Sales Footprint 20.2.4.5. Strategy Overview 20.2.5. DDoS-Guard 20.2.5.1. Business Overview 20.2.5.2. Product/Service Portfolio 20.2.5.3. Profitability by Market Segments (Business Segment/Region) 20.2.5.4. Sales Footprint 20.2.5.5. Strategy Overview 20.2.6. HaltDos 20.2.6.1. Business Overview 20.2.6.2. Product/Service Portfolio 20.2.6.3. Profitability by Market Segments (Business Segment/Region) 20.2.6.4. Sales Footprint 20.2.6.5. Strategy Overview 20.2.7. Endgame 20.2.7.1. Business Overview 20.2.7.2. Product/Service Portfolio 20.2.7.3. Profitability by Market Segments (Business Segment/Region) 20.2.7.4. Sales Footprint 20.2.7.5. Strategy Overview 20.2.8. Comodo 20.2.8.1. Business Overview 20.2.8.2. Product/Service Portfolio 20.2.8.3. Profitability by Market Segments (Business Segment/Region) 20.2.8.4. Sales Footprint 20.2.8.5. Strategy Overview 20.2.9. Cisco 20.2.9.1. Business Overview 20.2.9.2. Product/Service Portfolio 20.2.9.3. Profitability by Market Segments (Business Segment/Region) 20.2.9.4. Sales Footprint 20.2.9.5. Strategy Overview 20.2.10. Nexusguard 20.2.10.1. Business Overview 20.2.10.2. Product/Service Portfolio 20.2.10.3. Profitability by Market Segments (Business Segment/Region) 20.2.10.4. Sales Footprint 20.2.10.5. Strategy Overview 20.2.11. Fortinet 20.2.11.1. Business Overview 20.2.11.2. Product/Service Portfolio 20.2.11.3. Profitability by Market Segments (Business Segment/Region) 20.2.11.4. Sales Footprint 20.2.11.5. Strategy Overview 20.2.12. Orange 20.2.12.1. Business Overview 20.2.12.2. Product/Service Portfolio 20.2.12.3. Profitability by Market Segments (Business Segment/Region) 20.2.12.4. Sales Footprint 20.2.12.5. Strategy Overview 20.2.13. Tata Communication 20.2.13.1. Business Overview 20.2.13.2. Product/Service Portfolio 20.2.13.3. Profitability by Market Segments (Business Segment/Region) 20.2.13.4. Sales Footprint 20.2.13.5. Strategy Overview 20.2.14. Checkpoint Software 20.2.14.1. Business Overview 20.2.14.2. Product/Service Portfolio 20.2.14.3. Profitability by Market Segments (Business Segment/Region) 20.2.14.4. Sales Footprint 20.2.14.5. Strategy Overview 20.2.15. SAP 20.2.15.1. Business Overview 20.2.15.2. Product/Service Portfolio 20.2.15.3. Profitability by Market Segments (Business Segment/Region) 20.2.15.4. Sales Footprint 20.2.15.5. Strategy Overview 20.2.16. Openmind Networks 20.2.16.1. Business Overview 20.2.16.2. Product/Service Portfolio 20.2.16.3. Profitability by Market Segments (Business Segment/Region) 20.2.16.4. Sales Footprint 20.2.16.5. Strategy Overview 20.2.17. Barracuda Networks 20.2.17.1. Business Overview 20.2.17.2. Product/Service Portfolio 20.2.17.3. Profitability by Market Segments (Business Segment/Region) 20.2.17.4. Sales Footprint 20.2.17.5. Strategy Overview 20.2.18. Cisco 20.2.18.1. Business Overview 20.2.18.2. Product/Service Portfolio 20.2.18.3. Profitability by Market Segments (Business Segment/Region) 20.2.18.4. Sales Footprint 20.2.18.5. Strategy Overview 20.2.19. Dell Sonicwall 20.2.19.1. Business Overview 20.2.19.2. Product/Service Portfolio 20.2.19.3. Profitability by Market Segments (Business Segment/Region) 20.2.19.4. Sales Footprint 20.2.19.5. Strategy Overview 20.2.20. Watchguard 20.2.20.1. Business Overview 20.2.20.2. Product/Service Portfolio 20.2.20.3. Profitability by Market Segments (Business Segment/Region) 20.2.20.4. Sales Footprint 20.2.20.5. Strategy Overview 21. Assumptions and Acronyms Used 22. Research Methodolog
Don't pay for what you don't need
Customize your report by selecting specific countries or regions and save 30%!
List of Tables
Table 1: Global Market Value (US$ Billion) Analysis (2017 to 2021) by Solution Table 2: Global Market Value (US$ Billion) Analysis (2022 to 2032) by Solution Table 3: Global Market Value (US$ Billion) Analysis (2017 to 2021) by Deployment Table 4: Global Market Value (US$ Billion) Analysis (2022 to 2032) by Deployment Table 5: Global Market Value (US$ Billion) Analysis (2017 to 2021) by Enterprise Size Table 6: Global Market Value (US$ Billion) Analysis (2022 to 2032) by Enterprise Size Table 7: Global Market Value (US$ Billion) Analysis (2017 to 2021) by Industry Table 8: Global Market Value (US$ Billion) Analysis (2022 to 2032) by Industry Table 9: Global Market Value (US$ Billion) Analysis (2017 to 2021) by Region Table 10: Global Market Value (US$ Billion) Analysis (2022 to 2032) by Region Table 11: North America Market Value (US$ Billion) Analysis (2017 to 2021) by Solution Table 12: North America Market Value (US$ Billion) Analysis (2022 to 2032) by Solution Table 13: North America Market Value (US$ Billion) Analysis (2017 to 2021) by Deployment Table 14: North America Market Value (US$ Billion) Analysis (2022 to 2032) by Deployment Table 15: North America Market Value (US$ Billion) Analysis (2017 to 2021) by Enterprise Size Table 16: North America Market Value (US$ Billion) Analysis (2022 to 2032) by Enterprise Size Table 17: North America Market Value (US$ Billion) Analysis (2017 to 2021) by Industry Table 18: North America Market Value (US$ Billion) Analysis (2022 to 2032) by Industry Table 19: North America Market Value (US$ Billion) Analysis (2017 to 2021) by Country Table 20: North America Market Value (US$ Billion) Analysis (2022 to 2032) by Country Table 21: Latin America Market Value (US$ Billion) Analysis (2017 to 2021) by Solution Table 22: Latin America Market Value (US$ Billion) Analysis (2022 to 2032) by Solution Table 23: Latin America Market Value (US$ Billion) Analysis (2017 to 2021) by Deployment Table 24: Latin America Market Value (US$ Billion) Analysis (2022 to 2032) by Deployment Table 25: Latin America Market Value (US$ Billion) Analysis (2017 to 2021) by Enterprise Size Table 26: Latin America Market Value (US$ Billion) Analysis (2022 to 2032) by Enterprise Size Table 27: Latin America Market Value (US$ Billion) Analysis (2017 to 2021) by Industry Table 28: Latin America Market Value (US$ Billion) Analysis (2022 to 2032) by Industry Table 29: Latin America Market Value (US$ Billion) Analysis (2017 to 2021) by Country Table 30: Latin America Market Value (US$ Billion) Analysis (2022 to 2032) by Country Table 31: Europe Market Value (US$ Billion) Analysis (2017 to 2021) by Solution Table 32: Europe Market Value (US$ Billion) Analysis (2022 to 2032) by Solution Table 33: Europe Market Value (US$ Billion) Analysis (2017 to 2021) by Deployment Table 34: Europe Market Value (US$ Billion) Analysis (2022 to 2032) by Deployment Table 35: Europe Market Value (US$ Billion) Analysis (2017 to 2021) by Enterprise Size Table 36: Europe Market Value (US$ Billion) Analysis (2022 to 2032) by Enterprise Size Table 37: Europe Market Value (US$ Billion) Analysis (2017 to 2021) by Industry Table 38: Europe Market Value (US$ Billion) Analysis (2022 to 2032) by Industry Table 39: Europe Market Value (US$ Billion) Analysis (2017 to 2021) by Country Table 40: Europe Market Value (US$ Billion) Analysis (2022 to 2032) by Country Table 41: East Asia Market Value (US$ Billion) Analysis (2017 to 2021) by Solution Table 42: East Asia Market Value (US$ Billion) Analysis (2022 to 2032) by Solution Table 43: East Asia Market Value (US$ Billion) Analysis (2017 to 2021) by Deployment Table 44: East Asia Market Value (US$ Billion) Analysis (2022 to 2032) by Deployment Table 45: East Asia Market Value (US$ Billion) Analysis (2017 to 2021) by Enterprise Size Table 46: East Asia Market Value (US$ Billion) Analysis (2022 to 2032) by Enterprise Size Table 47: East Asia Market Value (US$ Billion) Analysis (2017 to 2021) by Industry Table 48: East Asia Market Value (US$ Billion) Analysis (2022 to 2032) by Industry Table 49: East Asia Market Value (US$ Billion) Analysis (2017 to 2021) by Country Table 50: East Asia Market Value (US$ Billion) Analysis (2022 to 2032) by Country Table 51: South Asia & Pacific Market Value (US$ Billion) Analysis (2017 to 2021) by Solution Table 52: South Asia & Pacific Market Value (US$ Billion) Analysis (2022 to 2032) by Solution Table 53: South Asia & Pacific Market Value (US$ Billion) Analysis (2017 to 2021) by Deployment Table 54: South Asia & Pacific Market Value (US$ Billion) Analysis (2022 to 2032) by Deployment Table 55: South Asia & Pacific Market Value (US$ Billion) Analysis (2017 to 2021) by Enterprise Size Table 56: South Asia & Pacific Market Value (US$ Billion) Analysis (2022 to 2032) by Enterprise Size Table 57: South Asia & Pacific Market Value (US$ Billion) Analysis (2017 to 2021) by Industry Table 58: South Asia & Pacific Market Value (US$ Billion) Analysis (2022 to 2032) by Industry Table 59: South Asia & Pacific Market Value (US$ Billion) Analysis (2017 to 2021) by Country Table 60: South Asia & Pacific Market Value (US$ Billion) Analysis (2022 to 2032) by Country Table 61: Middle East & Africa Market Value (US$ Billion) Analysis (2017 to 2021) by Solution Table 62: Middle East & Africa Market Value (US$ Billion) Analysis (2022 to 2032) by Solution Table 63: Middle East & Africa Market Value (US$ Billion) Analysis (2017 to 2021) by Deployment Table 64: Middle East & Africa Market Value (US$ Billion) Analysis (2022 to 2032) by Deployment Table 65: Middle East & Africa Market Value (US$ Billion) Analysis (2017 to 2021) by Enterprise Size Table 66: Middle East & Africa Market Value (US$ Billion) Analysis (2022 to 2032) by Enterprise Size Table 67: Middle East & Africa Market Value (US$ Billion) Analysis (2017 to 2021) by Industry Table 68: Middle East & Africa Market Value (US$ Billion) Analysis (2022 to 2032) by Industry Table 69: Middle East & Africa Market Value (US$ Billion) Analysis (2017 to 2021) by Country Table 70: Middle East & Africa Market Value (US$ Billion) Analysis (2022 to 2032) by Country
Find your sweet spots for generating winning opportunities in this market.
Talk to AnalystList of Charts
Figure 01: Global Market Value (US$ Billion), 2017 to 2021 Figure 02: Global Market Value (US$ Billion), 2022 to 2032 Figure 03: Global Market Size (US$ Billion) and Y-o-Y Growth Rate from 2022 to 2032 Figure 04: Global Market Size and Y-o-Y Growth Rate from 2022 to 2032 Figure 05: Global Market Value Y-o-Y Growth Trend Analysis (2019 to 2032) by Solution Figure 06: Global Market Value Share Analysis (2022 to 2032) by Solution Figure 07: Global Market Attractiveness by Solution Figure 08: Global Market Value Y-o-Y Growth Trend Analysis (2019 to 2032) by Deployment Figure 09: Global Market Value Share Analysis (2022 to 2032) by Deployment Figure 10: Global Market Attractiveness by Deployment Figure 11: Global Market Value Y-o-Y Growth Trend Analysis (2019 to 2032) by Enterprise Size Figure 12: Global Market Value Share Analysis (2022 to 2032) by Enterprise Size Figure 13: Global Market Attractiveness by Enterprise Size Figure 14: Global Market Value Y-o-Y Growth Trend Analysis (2019 to 2032) by Industry Figure 15: Global Market Value Share Analysis (2022 to 2032) by Industry Figure 16: Global Market Attractiveness by Industry Figure 17: Global Market Value Y-o-Y Growth Trend Analysis (2019 to 2032) by Region Figure 18: Global Market Value Share Analysis (2022 to 2032) by Region Figure 19: Global Market Attractiveness by Region Figure 20: North America Market Absolute $ Opportunity (US$ Billion), 2017 to 2032 Figure 21: Latin America Market Absolute $ Opportunity (US$ Billion), 2017 to 2032 Figure 22: Europe Market Absolute $ Opportunity (US$ Billion), 2017 to 2032 Figure 23: East Asia Market Absolute $ Opportunity (US$ Billion), 2017 to 2032 Figure 24: South Asia & Pacific Market Absolute $ Opportunity (US$ Billion), 2017 to 2032 Figure 25: Middle East & Africa Market Absolute $ Opportunity (US$ Billion), 2017 to 2032 Figure 26: North America Market Value (US$ Billion), 2017 to 2021 Figure 27: North America Market Value (US$ Billion), 2022 to 2032 Figure 28: North America Market Value Y-o-Y Growth Trend Analysis (2019 to 2032) by Solution Figure 29: North America Market Value Share Analysis (2022 to 2032) by Solution Figure 30: North America Market Attractiveness by Solution Figure 31: North America Market Value Y-o-Y Growth Trend Analysis (2019 to 2032) by Deployment Figure 32: North America Market Value Share Analysis (2022 to 2032) by Deployment Figure 33: North America Market Attractiveness by Deployment Figure 34: North America Market Value Y-o-Y Growth Trend Analysis (2019 to 2032) by Enterprise Size Figure 35: North America Market Value Share Analysis (2022 to 2032) by Enterprise Size Figure 36: North America Market Attractiveness by Enterprise Size Figure 37: North America Market Value Y-o-Y Growth Trend Analysis (2019 to 2032) by Industry Figure 38: North America Market Value Share Analysis (2022 to 2032) by Industry Figure 39: North America Market Attractiveness by Industry Figure 40: North America Market Value Y-o-Y Growth Trend Analysis (2019 to 2032) by Country Figure 41: North America Market Value Share Analysis (2022 to 2032) by Country Figure 42: North America Market Attractiveness by Country Figure 43: USA Market Absolute $ Opportunity (US$ Billion), 2017 to 2032 Figure 44: Canada Market Absolute $ Opportunity (US$ Billion), 2017 to 2032 Figure 45: Latin America Market Value (US$ Billion), 2017 to 2021 Figure 46: Latin America Market Value (US$ Billion), 2022 to 2032 Figure 47: Latin America Market Value Y-o-Y Growth Trend Analysis (2019 to 2032) by Solution Figure 48: Latin America Market Value Share Analysis (2022 to 2032) by Solution Figure 49: Latin America Market Attractiveness by Solution Figure 50: Latin America Market Value Y-o-Y Growth Trend Analysis (2019 to 2032) by Deployment Figure 51: Latin America Market Value Share Analysis (2022 to 2032) by Deployment Figure 52: Latin America Market Attractiveness by Deployment Figure 53: Latin America Market Value Y-o-Y Growth Trend Analysis (2019 to 2032) by Enterprise Size Figure 54: Latin America Market Value Share Analysis (2022 to 2032) by Enterprise Size Figure 55: Latin America Market Attractiveness by Enterprise Size Figure 56: Latin America Market Value Y-o-Y Growth Trend Analysis (2019 to 2032) by Industry Figure 57: Latin America Market Value Share Analysis (2022 to 2032) by Industry Figure 58: Latin America Market Attractiveness by Industry Figure 59: Latin America Market Value Y-o-Y Growth Trend Analysis (2019 to 2032) by Country Figure 60: Latin America Market Value Share Analysis (2022 to 2032) by Country Figure 61: Latin America Market Attractiveness by Country Figure 62: Brazil Market Absolute $ Opportunity (US$ Billion), 2017 to 2032 Figure 63: Mexico Market Absolute $ Opportunity (US$ Billion), 2017 to 2032 Figure 64: Rest of Latin America Market Absolute $ Opportunity (US$ Billion), 2017 to 2032 Figure 65: Europe Market Value (US$ Billion), 2017 to 2021 Figure 66: Europe Market Value (US$ Billion), 2022 to 2032 Figure 67: Europe Market Value Y-o-Y Growth Trend Analysis (2019 to 2032) by Solution Figure 68: Europe Market Value Share Analysis (2022 to 2032) by Solution Figure 69: Europe Market Attractiveness by Solution Figure 70: Europe Market Value Y-o-Y Growth Trend Analysis (2019 to 2032) by Deployment Figure 71: Europe Market Value Share Analysis (2022 to 2032) by Deployment Figure 72: Europe Market Attractiveness by Deployment Figure 73: Europe Market Value Y-o-Y Growth Trend Analysis (2019 to 2032) by Enterprise Size Figure 74: Europe Market Value Share Analysis (2022 to 2032) by Enterprise Size Figure 75: Europe Market Attractiveness by Enterprise Size Figure 76: Europe Market Value Y-o-Y Growth Trend Analysis (2019 to 2032) by Industry Figure 77: Europe Market Value Share Analysis (2022 to 2032) by Industry Figure 78: Europe Market Attractiveness by Industry Figure 79: Europe Market Value Y-o-Y Growth Trend Analysis (2019 to 2032) by Country Figure 80: Europe Market Value Share Analysis (2022 to 2032) by Country Figure 81: Europe Market Attractiveness by Country Figure 82: Germany Market Absolute $ Opportunity (US$ Billion), 2017 to 2032 Figure 83: Italy Market Absolute $ Opportunity (US$ Billion), 2017 to 2032 Figure 84: France Market Absolute $ Opportunity (US$ Billion), 2017 to 2032 Figure 85: United Kingdom. Market Absolute $ Opportunity (US$ Billion), 2017 to 2032 Figure 86: Spain Market Absolute $ Opportunity (US$ Billion), 2017 to 2032 Figure 87: BENELUX Market Absolute $ Opportunity (US$ Billion), 2017 to 2032 Figure 88: Russia Market Absolute $ Opportunity (US$ Billion), 2017 to 2032 Figure 89: Rest of Europe Market Absolute $ Opportunity (US$ Billion), 2017 to 2032 Figure 90: East Asia Market Value (US$ Billion), 2017 to 2021 Figure 91: East Asia Market Value (US$ Billion), 2022 to 2032 Figure 92: East Asia Market Value Y-o-Y Growth Trend Analysis (2019 to 2032) by Solution Figure 93: East Asia Market Value Share Analysis (2022 to 2032) by Solution Figure 94: East Asia Market Attractiveness by Solution Figure 95: East Asia Market Value Y-o-Y Growth Trend Analysis (2019 to 2032) by Deployment Figure 96: East Asia Market Value Share Analysis (2022 to 2032) by Deployment Figure 97: East Asia Market Attractiveness by Deployment Figure 98: East Asia Market Value Y-o-Y Growth Trend Analysis (2019 to 2032) by Enterprise Size Figure 99: East Asia Market Value Share Analysis (2022 to 2032) by Enterprise Size Figure 100: East Asia Market Attractiveness by Enterprise Size Figure 101: East Asia Market Value Y-o-Y Growth Trend Analysis (2019 to 2032) by Industry Figure 102: East Asia Market Value Share Analysis (2022 to 2032) by Industry Figure 103: East Asia Market Attractiveness by Industry Figure 104: East Asia Market Value Y-o-Y Growth Trend Analysis (2019 to 2032) by Country Figure 105: East Asia Market Value Share Analysis (2022 to 2032) by Country Figure 106: East Asia Market Attractiveness by Country Figure 107: China Market Absolute $ Opportunity (US$ Billion), 2017 to 2032 Figure 108: Japan Market Absolute $ Opportunity (US$ Billion), 2017 to 2032 Figure 109: South Korea Market Absolute $ Opportunity (US$ Billion), 2017 to 2032 Figure 110: South Asia & Pacific Market Value (US$ Billion), 2017 to 2021 Figure 111: South Asia & Pacific Market Value (US$ Billion), 2022 to 2032 Figure 112: South Asia & Pacific Market Value Y-o-Y Growth Trend Analysis (2019 to 2032) by Solution Figure 113: South Asia & Pacific Market Value Share Analysis (2022 to 2032) by Solution Figure 114: South Asia & Pacific Market Attractiveness by Solution Figure 115: South Asia & Pacific Market Value Y-o-Y Growth Trend Analysis (2019 to 2032) by Deployment Figure 116: South Asia & Pacific Market Value Share Analysis (2022 to 2032) by Deployment Figure 117: South Asia & Pacific Market Attractiveness by Deployment Figure 118: South Asia & Pacific Market Value Y-o-Y Growth Trend Analysis (2019 to 2032) by Enterprise Size Figure 119: South Asia & Pacific Market Value Share Analysis (2022 to 2032) by Enterprise Size Figure 120: South Asia & Pacific Market Attractiveness by Enterprise Size Figure 121: South Asia & Pacific Market Value Y-o-Y Growth Trend Analysis (2019 to 2032) by Industry Figure 122: South Asia & Pacific Market Value Share Analysis (2022 to 2032) by Industry Figure 123: South Asia & Pacific Market Attractiveness by Industry Figure 124: South Asia & Pacific Market Value Y-o-Y Growth Trend Analysis (2019 to 2032) by Country Figure 125: South Asia & Pacific Market Value Share Analysis (2022 to 2032) by Country Figure 126: South Asia & Pacific Market Attractiveness by Country Figure 127: India Market Absolute $ Opportunity (US$ Billion), 2017 to 2032 Figure 128: ASEAN Market Absolute $ Opportunity (US$ Billion), 2017 to 2032 Figure 129: Australia & New Zealand Market Absolute $ Opportunity (US$ Billion), 2017 to 2032 Figure 130: Rest of South Asia & Pacific Market Absolute $ Opportunity (US$ Billion), 2017 to 2032 Figure 131: Middle East & Africa Market Value (US$ Billion), 2017 to 2021 Figure 132: Middle East & Africa Market Value (US$ Billion), 2022 to 2032 Figure 133: Middle East & Africa Market Value Y-o-Y Growth Trend Analysis (2019 to 2032) by Solution Figure 134: Middle East & Africa Market Value Share Analysis (2022 to 2032) by Solution Figure 135: Middle East & Africa Market Attractiveness by Solution Figure 136: Middle East & Africa Market Value Y-o-Y Growth Trend Analysis (2019 to 2032) by Deployment Figure 137: Middle East & Africa Market Value Share Analysis (2022 to 2032) by Deployment Figure 138: Middle East & Africa Market Attractiveness by Deployment Figure 139: Middle East & Africa Market Value Y-o-Y Growth Trend Analysis (2019 to 2032) by Enterprise Size Figure 140: Middle East & Africa Market Value Share Analysis (2022 to 2032) by Enterprise Size Figure 141: Middle East & Africa Market Attractiveness by Enterprise Size Figure 142: Middle East & Africa Market Value Y-o-Y Growth Trend Analysis (2019 to 2032) by Industry Figure 143: Middle East & Africa Market Value Share Analysis (2022 to 2032) by Industry Figure 144: Middle East & Africa Market Attractiveness by Industry Figure 145: Middle East & Africa Market Value Y-o-Y Growth Trend Analysis (2019 to 2032) by Country Figure 146: Middle East & Africa Market Value Share Analysis (2022 to 2032) by Country Figure 147: Middle East & Africa Market Attractiveness by Country Figure 148: GCC Countries Market Absolute $ Opportunity (US$ Billion), 2017 to 2032 Figure 149: North Africa Market Absolute $ Opportunity (US$ Billion), 2017 to 2032 Figure 150: South Africa Market Absolute $ Opportunity (US$ Billion), 2017 to 2032 Figure 151: Turkey Market Absolute $ Opportunity (US$ Billion), 2017 to 2032 Figure 152: Rest of Middle East & Africa Market Absolute $ Opportunity (US$ Billion), 2017 to 2032
Recommendations
Explore Technology Insights
View Reports