SQL Server Transformation Market Outlook (2022 to 2029)

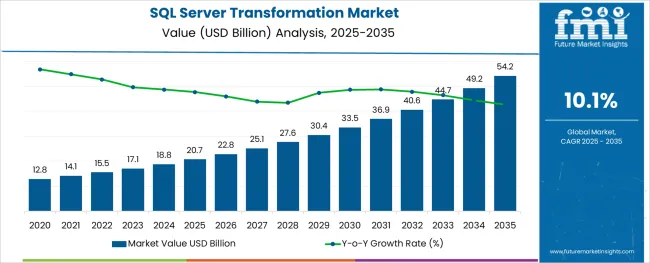
The worldwide SQL server transformation market is anticipated to surge at an impressive CAGR of 10.1% from 2022 to 2029. At present, industry revenue stands at USD 15.5 Billion, which is expected to rise to USD 30.4 billion by the end of 2029.

Report Attributes Details
SQL Server Transformation Market Size (2022) USD 15.5 Billion
Estimated Net Worth (2029) USD 30.4 Billion
Predicted Growth Rate (2022 to 2029) 10.1% CAGR
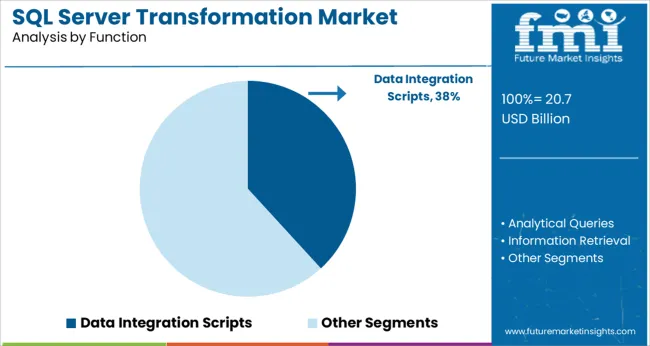
Largest Function Segment Data Integration Scripts - 35.9%

Revenue from SQL server transformation accounts for a 15% share of the global system integration market. Increasing technological proliferation has led to a surge in the deployment of SQL servers to manage databases that govern large data volumes.

How The Market Progressed Till June 2022?

Market Statistics Details
H1,2021 (A) 8.3%
H1,2022 Projected (P) 8.9%
H1,2022 Outlook (O) 8.5%
BPS Change : H1,2022 (O) - H1,2022 (P) (-) 40 ↓
BPS Change : H1,2022 (O) - H1,2021 (A) (+) 20 ↑

A decrease of 40 units in BPS values was observed in the SQL server transformation market in H1, 2022 - Outlook (O) over H1, 2022 Projected (P), as per FMI analysis. Some relational database management systems have limits on their field lengths.

When the database is being designed, the developer has to specify the amount of data the client can fit into a field. Some search queries are shorter than the actual data fed into the database, and this leads to data loss. Thereby such technical limitations are restraining the solution adoption and impact market growth.

However, compared to H1, 2021 (A), the SQL server transformation market increased by 20 BPS in H1 -2022. In the healthcare, financial, educational, and IT sectors, SQL server transformation-based systems are crucial for exporting and importing data and delivering audit information with gradually changing dimensions.

Business intelligence tasks including data cleaning, text mining, and performing data mining prediction queries are carried out via SQL server transformation, which is likely to drive market growth.

Consumption Analysis of SQL Server Transformation (2014 to 2021) Vs Future Market Statistics (2022 to 2029)

Rising technological proliferation in multiple regions has created a widespread trend of digitization leading to an increase in the deployment of multiple servers and databases for data management. Demand for SQL server transformation rose at a CAGR of 7.2% from 2014 to 2021.

SQL server transformation systems also add an extra layer of security to database software, and many new SQL server transformation solutions add easy-to-use features to enable the convenient administration of databases.

Increasing focus on the digitization of businesses, rising technological proliferation, widespread digitization of multiple verticals, increasing data volume, rising demand for efficient database management, and increasing speed of SQL server transformation are some major factors that guide the SQL server transformation market potential over the forecast period.

The SQL server transformation market is anticipated to rise at a stellar CAGR of 10.1% from 2022 to 2029.

What Trends Could SQL Server Transformation Providers Benefit From?

Increasing Adoption of SQL Server Transformation in Education & Retail

Digital transformation across major industry verticals has become a common trend in the past few years but this trend is evolving with verticals like education and retail providing huge opportunities for SQL server transformation. The IT sector remains a dominant industry vertical for SQL server transformation providers but they can also invest in capitalizing on the new opportunities that the retail and education sectors are predicted to offer.

Rising Popularity of NewSQL Databases to Provide New Opportunities

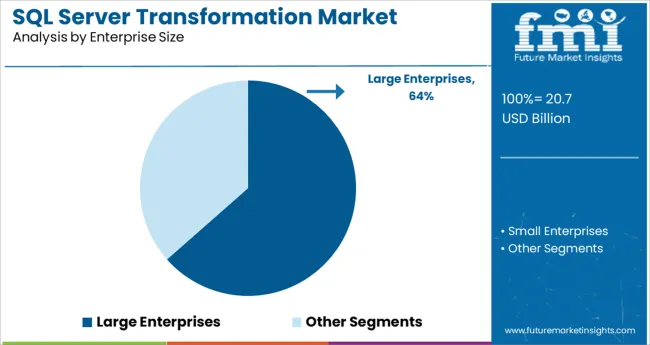
NewSQL solutions are addressing shortcomings of the current database software and solutions in handling a large volume of data. Large enterprises that utilize structured data are anticipated to lead the adoption of NewSQL databases. With more organizations moving towards these new databases, SQL server transformation providers are expected to have more new opportunities to cash in in the global marketplace.

What Could Hamper SQL Server Transformation Market Potential?

Complexity & Lack of Efficiency to Negatively Influence SQL Server Transformation Demand

SQL server transformation processes were complex from the very first but have become more complex as technology has advanced in recent years. Lack of efficiency, high complexity, and lack of availability of appropriate solutions are major restraining factors that adversely impact SQL server transformation demand.
What is the Regional Outlook for the SQL Server Transformation Industry?

North America to Hold Dominant Market Share in Global Landscape

Regions such as North America, Latin America, Europe, East Asia, South Asia & Pacific, and the Middle East & Africa (MEA) have been assessed in this SQL server transformation market report by FMI.

The market for SQL server transformation in North America is anticipated to hold a dominant stance over the forecast period owing to rising technological advancements in the region. The USA is anticipated to be the most prominent country in this region for SQL server transformation providers. Increasing adoption of intelligent technologies such as AI, IoT, machine learning, etc.

Demand for SQL server transformation in Europe is also expected to be significant over the forecast period. Increasing adoption of cloud technology from large enterprises and SMEs is anticipated to increase the deployment of SQL servers.

Rapid digitization in regions such as East Asia, South Asia, and the Pacific regions are anticipated to guide SQL server transformation market potential over the forecast period. Increasing use of data warehousing solutions in these regions is anticipated to primarily facilitate opportunities for SQL server transformation solution providers.

The SQL server transformation market in the MEA region is predicted to provide a lucrative setting for SQL server transformation vendors. Adoption of high-performance SQL server transformation (Relational Database Management System) RDBMS in this region is expected to majorly provide lucrative opportunities for SQL server transformation companies.
Country-wise Analysis

What Opportunities Does the India SQL Server Transformation Market Have to Offer?

Rapid Urbanization & Digitization Expected to Boost Demand for SQL Server Transformation

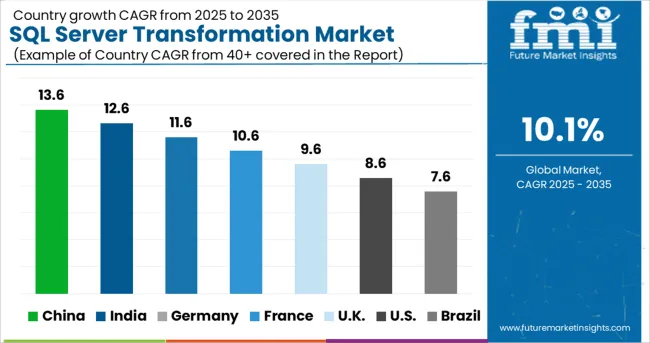
India is a developing economy and has proved to be a massively important market for many companies. SQL server transformation market in India is expected to have a bright outlook owing to the increase in digitization of multiple large enterprises and SME businesses. Rising technological proliferation, rapidly advancing digital transformation, and increasing adoption of cloud technologies are expected to boost market potential in India over the forecast.

Data warehousing demand is on an upward trend in India and this is anticipated to propel the adoption of SQL server transformation solutions and services.

Is the USA a Lucrative Market for SQL Server Transformation Service Vendors?

Presence of Key SQL Server Transformation Companies to Make USA a Rewarding Market

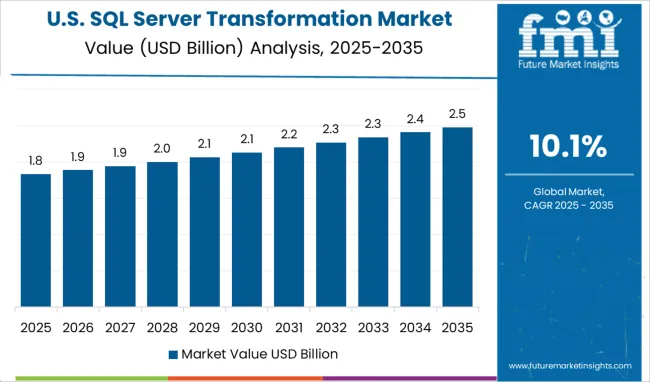
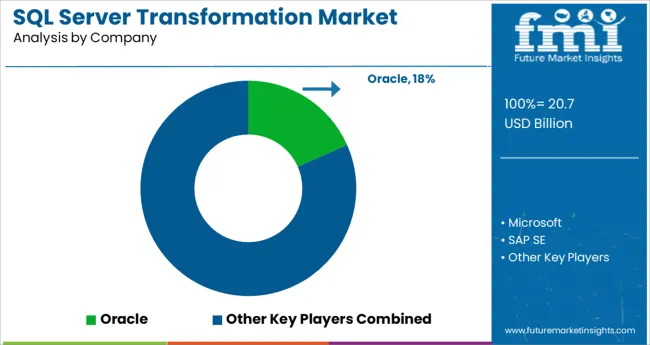
The USA is a highly rewarding market for all technologies due to the presence of major tech giants. The increasing need for data management has led to a substantial increase in the adoption of SQL server transformation solutions. The presence of key SQL server transformation providers like Microsoft and Oracle also favors market potential in the USA

Category-wise Analysis

How is the Market Segmented on the Basis of Function?

Data Integration Scripts to Have Dominant Outlook

In 2022, data integration scripts hold a huge market share of 35.9% in the global SQL server transformation market landscape and are currently the dominant sub-segment in the function segment.

Second to this is the information retrieval segment with a market share of 29.8%, which is closely followed by the analytical queries segment accounting for 26.4% in the global SQL server transformation landscape.
Competitive Landscape

SQL server transformation providers are investing in the expansion of their service offerings to cater to the changing trends of large enterprises and SMEs. SQL server transformation vendors are also expected to focus on the rising popularity of NewSQL databases and develop new solutions specific to them.

  • In December 2021, Netapp a data-centric software firm announced the launch of its new NetApp® AFF A900 along with a new portfolio of all-flash storage systems. AFF A900 is proficient in handling essential database software like Oracle, Microsoft SQL Server, etc.

SQL Server Transformation Industry Report Scope

Attribute Details
Forecast Period 2022 to 2029
Historical Data Available for 2014 to 2021
Market Analysis USD Million for Value
Key Regions Covered North America; Latin America; Europe; East Asia; South Asia & Pacific; Middle East & Africa (MEA)
Key Countries Covered USA, Canada, Brazil, Mexico, Germany, United Kingdom, France, Spain, Italy, China, Japan, South Korea, India, Indonesia, Malaysia, Singapore, Australia, New Zealand, Turkey, South Africa, and GCC Countries
Key Market Segments Covered Enterprise Size, Function, Use Case, Vertical, Region
Key Companies Profiled Oracle; Microsoft; SAP SE; IBM; Alphabet; Amazon Web Services Inc.; Teradata; NuoDB Inc.; MemSQL Inc.; Actian Corporation
Pricing Available upon Request

Key Segments of SQL Server Transformation Industry Survey

By Enterprise Size:

  • Large Enterprises
  • Small Enterprises

By Function:

  • Data Integration Scripts
  • Analytical Queries
  • Information Retrieval
  • Other Applications

By Use Case:

  • Business Operations
  • Enterprise Data Warehousing

By Vertical:

  • IT and Services
  • Healthcare
  • Financial Services
  • Professional Services
  • Education
  • Retail
  • Construction

By Region:

  • North America
  • Latin America
  • Europe
  • East Asia
  • South Asia & Pacific
  • Middle East & Africa (MEA)

Table of Content

  • 1. Executive Summary
  • 2. Market Overview
  • 3. Key Market Trends
  • 4. Market Background
  • 5. Global Market Demand (in Value or Size in USD Million) Analysis 2014 to 2021 and Forecast, 2022 to 2029
  • 6. Global Market Analysis 2014 to 2021 and Forecast 2022 to 2029, by Enterprise Size
    • 6.1. Large Enterprises
    • 6.2. Small and Medium Sized Enterprises (SMEs)
  • 7. Global Market Analysis 2014 to 2021 and Forecast 2022 to 2029, by Function
    • 7.1. Data Integration Scripts
    • 7.2. Analytical Queries
    • 7.3. Information Retrieval
    • 7.4. Other Applications
  • 8. Global Market Analysis 2014 to 2021 and Forecast 2022 to 2029, by Use of Case
    • 8.1. Business Operations
    • 8.2. Enterprise Data Warehousing
  • 9. Global Market Analysis 2014 to 2021 and Forecast 2022 to 2029, by Vertical
    • 9.1. IT and Services
    • 9.2. Healthcare
    • 9.3. Financial Services
    • 9.4. Professional Services
    • 9.5. Education
    • 9.6. Retail
    • 9.7. Construction
  • 10. Global Market Analysis 2014 to 2021 and Forecast 2022 to 2029, by Region
    • 10.1. North America
    • 10.2. Latin America
    • 10.3. Western Europe
    • 10.4. Eastern Europe
    • 10.5. Asia Pacific Excluding Japan (APEJ)
    • 10.6. Japan
    • 10.7. Middle East and Africa (MEA)
  • 11. North America Market Analysis 2014 to 2021 and Forecast 2022 to 2029
  • 12. Latin America Market Analysis 2014 to 2021 and Forecast 2022 to 2029
  • 13. Western Europe Market Analysis 2014 to 2021 and Forecast 2022 to 2029
  • 14. Eastern Europe Market Analysis 2014 to 2021 and Forecast 2022 to 2029
  • 15. Asia Pacific excluding Japan Market Analysis 2014 to 2021 and Forecast 2022 to 2029
  • 16. Japan Market Analysis 2014 to 2021 and Forecast 2022 to 2029
  • 17. Middle East and Africa Market Analysis 2014 to 2021 and Forecast 2022 to 2029
  • 18. Market Structure Analysis
  • 19. Competition Analysis
    • 19.1. Oracle
    • 19.2. Microsoft
    • 19.3. SAP SE
    • 19.4. IBM
    • 19.5. Alphabet
    • 19.6. Amazon Web Services, Inc.
    • 19.7. Teradata
    • 19.8. NuoDB, Inc.
    • 19.9. MemSQL, Inc.
    • 19.10. Actian Corporation
  • 20. Assumptions and Acronyms Used
  • 21. Research Methodology

List of Tables

Table 01: Top 15 DBMS Providers

Table 02: Top 5 Commercial Licensed DBMS Providers

Table 03: Top 5 Open Source DBMS Providers

Table 04: Global Average License Pricing Analysis as per Oracle Named User Plus Subscription Model

Table 05: Global Average License Pricing Analysis as per Oracle Processor License Subscription Model

Table 06: Global Market Value (US$ Million) Analysis by Enterprise Size, 2014 to 2021

Table 07: Global Market Value (US$ Million) Analysis by Enterprise Size, 2022 to 2029

Table 08: Global Market Value (US$ Million) Analysis by Function, 2014 to 2021

Table 09: Global Market Value (US$ Million) Analysis by Function, 2022 to 2029

Table 10: Global Market Value (US$ Million) Analysis by Use Case, 2014 to 2021

Table 11: Global Market Value (US$ Million) Analysis by Use Case, 2022 to 2029

Table 12: Global Market Value (US$ Million) Analysis by Vertical, 2014 to 2021

Table 13: Global Market Value (US$ Million) Analysis by Vertical, 2022 to 2029

Table 14: Global Market Value (US$ Million) Analysis by Region, 2014 to 2021

Table 15: Global Market Value (US$ Million) Analysis by Region, 2022 to 2029

Table 16: North America Market Value (US$ Million) Analysis by Country, 2014 to 2021

Table 17: North America Market Value (US$ Million) Analysis by Country, 2022 to 2029

Table 18: North America Market Value (US$ Million) Analysis by Enterprise Size, 2014 to 2021

Table 19: North America Market Value (US$ Million) Analysis by Enterprise Size, 2022 to 2029

Table 20: North America Market Value (US$ Million) Analysis by Function, 2014 to 2021

Table 21: North America Market Value (US$ Million) Analysis by Function, 2022 to 2029

Table 22: North America Market Value (US$ Million) Analysis by Use Case, 2014 to 2021

Table 23: North America Market Value (US$ Million) Analysis by Use Case, 2022 to 2029

Table 24: North America Market Value (US$ Million) Analysis by Vertical, 2014 to 2021

Table 25: North America Market Value (US$ Million) Analysis by Vertical, 2022 to 2029

Table 26: Latin America Market Value (US$ Million) Analysis by Country, 2014 to 2021

Table 27: Latin America Market Value (US$ Million) Analysis by Country, 2022 to 2029

Table 28: Latin America Market Value (US$ Million) Analysis by Enterprise Size, 2014 to 2021

Table 29: Latin America Market Value (US$ Million) Analysis by Enterprise Size, 2022 to 2029

Table 30: Latin America Market Value (US$ Million) Analysis by Function, 2014 to 2021

Table 31: Latin America Market Value (US$ Million) Analysis by Function, 2022 to 2029

Table 32: Latin America Market Value (US$ Million) Analysis by Use Case, 2014 to 2021

Table 33: Latin America Market Value (US$ Million) Analysis by Use Case, 2022 to 2029

Table 34: Latin America Market Value (US$ Million) Analysis by Vertical, 2014 to 2021

Table 35: Latin America Market Value (US$ Million) Analysis by Vertical, 2022 to 2029

Table 36: Western Europe Market Value (US$ Million) Analysis by Country, 2014 to 2021

Table 37: Western Europe Market Value (US$ Million) Analysis by Country, 2022 to 2029

Table 38: Western Europe Market Value (US$ Million) Analysis by Enterprise Size, 2014 to 2021

Table 39: Western Europe Market Value (US$ Million) Analysis by Enterprise Size, 2022 to 2029

Table 40: Western Europe Market Value (US$ Million) Analysis by Function, 2014 to 2021

Table 41: Western Europe Market Value (US$ Million) Analysis by Function, 2022 to 2029

Table 42: Western Europe Market Value (US$ Million) Analysis by Use Case, 2014 to 2021

Table 43: Western Europe Market Value (US$ Million) Analysis by Use Case, 2022 to 2029

Table 44: Western Europe Market Value (US$ Million) Analysis by Vertical, 2014 to 2021

Table 45: Western Europe Market Value (US$ Million) Analysis by Vertical, 2022 to 2029

Table 46: Eastern Europe Market Value (US$ Million) Analysis by Country, 2014 to 2021

Table 47: Eastern Europe Market Value (US$ Million) Analysis by Country, 2022 to 2029

Table 48: Eastern Europe Market Value (US$ Million) Analysis by Enterprise Size, 2014 to 2021

Table 49: Eastern Europe Market Value (US$ Million) Analysis by Enterprise Size, 2022 to 2029

Table 50: Eastern Europe Market Value (US$ Million) Analysis by Function, 2014 to 2021

Table 51: Eastern Europe Market Value (US$ Million) Analysis by Function, 2022 to 2029

Table 52: Eastern Europe Market Value (US$ Million) Analysis by Use Case, 2014 to 2021

Table 53: Eastern Europe Market Value (US$ Million) Analysis by Use Case, 2022 to 2029

Table 54: Eastern Europe Market Value (US$ Million) Analysis by Vertical, 2014 to 2021

Table 55: Eastern Europe Market Value (US$ Million) Analysis by Vertical, 2022 to 2029

Table 56: Asia Pacific Excluding Japan Market Value (US$ Million) Analysis by Country, 2014 to 2021

Table 57: Asia Pacific Excluding Japan Market Value (US$ Million) Analysis by Country, 2022 to 2029

Table 58: Asia Pacific Excluding Japan Market Value (US$ Million) Analysis by Enterprise Size, 2014 to 2021

Table 59: Asia Pacific Excluding Japan Market Value (US$ Million) Analysis by Enterprise Size, 2022 to 2029

Table 60: Asia Pacific Excluding Japan Market Value (US$ Million) Analysis by Function, 2014 to 2021

Table 61: Asia Pacific Excluding Japan Market Value (US$ Million) Analysis by Function, 2022 to 2029

Table 62: Asia Pacific Excluding Japan Market Value (US$ Million) Analysis by Use Case, 2014 to 2021

Table 63: Asia Pacific Excluding Japan Market Value (US$ Million) Analysis by Use Case, 2022 to 2029

Table 64: Asia Pacific Excluding Japan Market Value (US$ Million) Analysis by Vertical, 2014 to 2021

Table 65: Asia Pacific Excluding Japan Market Value (US$ Million) Analysis by Vertical, 2022 to 2029

Table 66: Japan Market Value (US$ Million) Analysis by Enterprise Size, 2014 to 2021

Table 67: Japan Market Value (US$ Million) Analysis by Enterprise Size, 2022 to 2029

Table 68: Japan Market Value (US$ Million) Analysis by Function, 2014 to 2021

Table 69: Japan Market Value (US$ Million) Analysis by Function, 2022 to 2029

Table 70: Japan Market Value (US$ Million) Analysis by Use Case, 2014 to 2021

Table 71: Japan Market Value (US$ Million) Analysis by Use Case, 2022 to 2029

Table 72: Japan Market Value (US$ Million) Analysis by Vertical, 2014 to 2021

Table 73: Japan Market Value (US$ Million) Analysis by Vertical, 2022 to 2029

Table 74: Middle East and Africa Market Value (US$ Million) Analysis by Country, 2014 to 2021

Table 75: Middle East and Africa Market Value (US$ Million) Analysis by Country, 2022 to 2029

Table 76: Middle East and Africa Market Value (US$ Million) Analysis by Enterprise Size, 2014 to 2021

Table 77: Middle East and Africa Market Value (US$ Million) Analysis by Enterprise Size, 2022 to 2029

Table 78: Middle East and Africa Market Value (US$ Million) Analysis by Function, 2014 to 2021

Table 79: Middle East and Africa Market Value (US$ Million) Analysis by Function, 2022 to 2029

Table 80: Middle East and Africa Market Value (US$ Million) Analysis by Use Case, 2014 to 2021

Table 81: Middle East and Africa Market Value (US$ Million) Analysis by Use Case, 2022 to 2029

Table 82: Middle East and Africa Market Value (US$ Million) Analysis by Vertical, 2014 to 2021

Table 83: Middle East and Africa Market Value (US$ Million) Analysis by Vertical, 2022 to 2029

List of Figures

Figure 01: Commercial License DBMS versus Open Source License DMS Popularity Trend, January 2013 to December 2022

Figure 02: Popularity by Database Model, December 2022

Figure 03: Volume (in Zetabytes) of Data Created Worldwide from 2010 to 2025

Figure 04: Enterprise-grade Spending on Software (US$ Billion)

Figure 05: Internet Users in Major Countries

Figure 06: Number of Internet Users (Million Users) in Major Countries

Figure 07: Internet World Penetration Rate (%) by Region, December 2017

Figure 08: Global Internet User Distribution (%), 2017

Figure 09: Global Market Size (US$ Million) and Y-o-Y Growth Rate (%) from 2022 to 2029

Figure 10: Global Market Absolute $ Opportunity (US$ Million), 2022 to 2029

Figure 11: Global Market Incremental Opportunity (US$ Million) Analysis by Enterprise Size

Figure 12: Global Market Incremental Opportunity (US$ Million) Analysis by Function

Figure 13: Global Market Incremental Opportunity (US$ Million) Analysis by Use Case

Figure 14: Global Market Incremental Opportunity (US$ Million) Analysis by Vertical

Figure 15: Global Market Incremental Opportunity (US$ Million) Analysis by Region

Figure 16: Global Market Share Analysis by Enterprise Size – 2022 & 2029

Figure 17: Global Market Y-o-Y Growth by Enterprise Size, 2022 to 2029

Figure 18: Global Market Attractiveness Analysis by Enterprise Size, 2022 to 2029

Figure 19: Global Market Share Analysis by Function – 2022 & 2029

Figure 20: Global Market Y-o-Y Growth by Function, 2022 to 2029

Figure 21: Global Market Attractiveness Analysis by Function, 2022 to 2029

Figure 22: Global Market Share Analysis by Use Case – 2022 & 2029

Figure 23: Global Market Y-o-Y Growth by Use Case, 2022 to 2029

Figure 24: Global Market Attractiveness Analysis by Use Case, 2022 to 2029

Figure 25: Global Market Share Analysis by Vertical – 2022 & 2029

Figure 26: Global Market Y-o-Y Growth by Vertical, 2022 to 2029

Figure 27: Global Market Attractiveness Analysis by Vertical, 2022 to 2029

Figure 28: Global Market Share Analysis by Region – 2022 & 2029

Figure 29: Global Market Y-o-Y Growth by Region, 2022 to 2029

Figure 30: Global Market Attractiveness Analysis by Region, 2022 to 2029

Figure 31: North America Market Absolute $ Opportunity (US$ Million) Analysis, 2021 to 2029

Figure 32: Latin America Market Absolute $ Opportunity (US$ Million) Analysis, 2021 to 2029

Figure 33: Western Europe Market Absolute $ Opportunity (US$ Million) Analysis, 2021 to 2029

Figure 34: Eastern Europe Market Absolute $ Opportunity (US$ Million) Analysis, 2021 to 2029

Figure 35: Asia Pacific Excluding Japan Market Absolute $ Opportunity (US$ Million) Analysis, 2021 to 2029

Figure 36: Japan Market Absolute $ Opportunity (US$ Million) Analysis, 2021 to 2029

Figure 37: Middle East and Africa Market Absolute $ Opportunity (US$ Million) Analysis, 2021 to 2029

Figure 38: North America Market Size (US$ Million) and Y-o-Y Growth Rate (%) from 2022 to 2029

Figure 39: North America Market Absolute $ Opportunity (US$ Million), 2022 to 2029

Figure 40: North America Market Share Analysis by Country – 2022 & 2029

Figure 41: North America Market Y-o-Y Growth by Country, 2022 to 2029

Figure 42: North America Market Attractiveness Analysis by Country, 2022 to 2029

Figure 43: USA Market Absolute $ Opportunity (US$ Million) Analysis, 2021 to 2029

Figure 44: Canada Market Absolute $ Opportunity (US$ Million) Analysis, 2021 to 2029

Figure 45: North America Market Share Analysis by Enterprise Size – 2022 & 2029

Figure 46: North America Market Y-o-Y Growth by Enterprise Size, 2022 to 2029

Figure 47: North America Market Attractiveness Analysis by Enterprise Size, 2022 to 2029

Figure 48: North America Market Share Analysis by Function – 2022 & 2029

Figure 49: North America Market Y-o-Y Growth by Function, 2022 to 2029

Figure 50: North America Market Attractiveness Analysis by Function, 2022 to 2029

Figure 51: North America Market Share Analysis by Use Case – 2022 & 2029

Figure 52: North America Market Y-o-Y Growth by Use Case, 2022 to 2029

Figure 53: North America Market Attractiveness Analysis by Use Case, 2022 to 2029

Figure 54: North America Market Share Analysis by Vertical – 2022 & 2029

Figure 55: North America Market Y-o-Y Growth by Vertical, 2022 to 2029

Figure 56: North America Market Attractiveness Analysis by Vertical, 2022 to 2029

Figure 57: Latin America Market Size (US$ Million) and Y-o-Y Growth Rate (%) from 2022 to 2029

Figure 58: Latin America Market Absolute $ Opportunity (US$ Million), 2022 to 2029

Figure 59: Latin America Market Share Analysis by Country – 2022 & 2029

Figure 60: Latin America Market Y-o-Y Growth by Country, 2022 to 2029

Figure 61: Latin America Market Attractiveness Analysis by Country, 2022 to 2029

Figure 62: Brazil Market Absolute $ Opportunity (US$ Million) Analysis, 2021 to 2029

Figure 63: Mexico Market Absolute $ Opportunity (US$ Million) Analysis, 2021 to 2029

Figure 64: Rest of Latin America Market Absolute $ Opportunity (US$ Million) Analysis, 2021 to 2029

Figure 65: Latin America Market Share Analysis by Enterprise Size – 2022 & 2029

Figure 66: Latin America Market Y-o-Y Growth by Enterprise Size, 2022 to 2029

Figure 67: Latin America Market Attractiveness Analysis by Enterprise Size, 2022 to 2029

Figure 68: Latin America Market Share Analysis by Function – 2022 & 2029

Figure 69: Latin America Market Y-o-Y Growth by Function, 2022 to 2029

Figure 70: Latin America Market Attractiveness Analysis by Function, 2022 to 2029

Figure 71: Latin America Market Share Analysis by Use Case – 2022 & 2029

Figure 72: Latin America Market Y-o-Y Growth by Use Case, 2022 to 2029

Figure 73: Latin America Market Attractiveness Analysis by Use Case, 2022 to 2029

Figure 74: Latin America Market Share Analysis by Vertical – 2022 & 2029

Figure 75: Latin America Market Y-o-Y Growth by Vertical, 2022 to 2029

Figure 76: Latin America Market Attractiveness Analysis by Vertical, 2022 to 2029

Figure 77: Western Europe Market Size (US$ Million) and Y-o-Y Growth Rate (%) from 2022 to 2029

Figure 78: Western Europe Market Absolute $ Opportunity (US$ Million), 2022 to 2029

Figure 79: Western Europe Market Share Analysis by Country – 2022 & 2029

Figure 80: Western Europe Market Y-o-Y Growth by Country, 2022 to 2029

Figure 81: Western Europe Market Attractiveness Analysis by Country, 2022 to 2029

Figure 82: Germany Market Absolute $ Opportunity (US$ Million) Analysis, 2021 to 2029

Figure 83: Italy Market Absolute $ Opportunity (US$ Million) Analysis, 2021 to 2029

Figure 84: France Market Absolute $ Opportunity (US$ Million) Analysis, 2021 to 2029

Figure 85: United Kingdom Market Absolute $ Opportunity (US$ Million) Analysis, 2021 to 2029

Figure 86: Spain Market Absolute $ Opportunity (US$ Million) Analysis, 2021 to 2029

Figure 87: BENELUX Market Absolute $ Opportunity (US$ Million) Analysis, 2021 to 2029

Figure 88: Rest of Western Europe Market Absolute $ Opportunity (US$ Million) Analysis, 2021 to 2029

Figure 89: Western Europe Market Share Analysis by Enterprise Size – 2022 & 2029

Figure 90: Western Europe Market Y-o-Y Growth by Enterprise Size, 2022 to 2029

Figure 91: Western Europe Market Attractiveness Analysis by Enterprise Size, 2022 to 2029

Figure 92: Western Europe Market Share Analysis by Function – 2022 & 2029

Figure 93: Western Europe Market Y-o-Y Growth by Function, 2022 to 2029

Figure 94: Western Europe Market Attractiveness Analysis by Function, 2022 to 2029

Figure 95: Western Europe Market Share Analysis by Use Case – 2022 & 2029

Figure 96: Western Europe Market Y-o-Y Growth by Use Case, 2022 to 2029

Figure 97: Western Europe Market Attractiveness Analysis by Use Case, 2022 to 2029

Figure 98: Western Europe Market Share Analysis by Vertical – 2022 & 2029

Figure 99: Western Europe Market Y-o-Y Growth by Vertical, 2022 to 2029

Figure 100: Western Europe Market Attractiveness Analysis by Vertical, 2022 to 2029

Figure 101: Eastern Europe Market Size (US$ Million) and Y-o-Y Growth Rate (%) from 2022 to 2029

Figure 102: Eastern Europe Market Absolute $ Opportunity (US$ Million), 2022 to 2029

Figure 103: Eastern Europe Market Share Analysis by Country – 2022 & 2029

Figure 104: Eastern Europe Market Y-o-Y Growth by Country, 2022 to 2029

Figure 105: Eastern Europe Market Attractiveness Analysis by Country, 2022 to 2029

Figure 106: Russia Market Absolute $ Opportunity (US$ Million) Analysis, 2021 to 2029

Figure 107: Poland Market Absolute $ Opportunity (US$ Million) Analysis, 2021 to 2029

Figure 108: Rest of Eastern Europe Market Absolute $ Opportunity (US$ Million) Analysis, 2021 to 2029

Figure 109: Eastern Europe Market Share Analysis by Enterprise Size – 2022 & 2029

Figure 110: Eastern Europe Market Y-o-Y Growth by Enterprise Size, 2022 to 2029

Figure 111: Eastern Europe Market Attractiveness Analysis by Enterprise Size, 2022 to 2029

Figure 112: Eastern Europe Market Share Analysis by Function – 2022 & 2029

Figure 113: Eastern Europe Market Y-o-Y Growth by Function, 2022 to 2029

Figure 114: Eastern Europe Market Attractiveness Analysis by Function, 2022 to 2029

Figure 115: Eastern Europe Market Share Analysis by Use Case – 2022 & 2029

Figure 116: Eastern Europe Market Y-o-Y Growth by Use Case, 2022 to 2029

Figure 117: Eastern Europe Market Attractiveness Analysis by Use Case, 2022 to 2029

Figure 118: Eastern Europe Market Share Analysis by Vertical – 2022 & 2029

Figure 119: Eastern Europe Market Y-o-Y Growth by Vertical, 2022 to 2029

Figure 120: Eastern Europe Market Attractiveness Analysis by Vertical, 2022 to 2029

Figure 121: Asia Pacific excluding Japan Market Size (US$ Million) and Y-o-Y Growth Rate (%) from 2022 to 2029

Figure 122: Asia Pacific excluding Japan Market Absolute $ Opportunity (US$ Million), 2022 to 2029

Figure 123: Asia Pacific Excluding Japan Market Share Analysis by Country – 2022 & 2029

Figure 124: Asia Pacific excluding Japan Market Y-o-Y Growth by Country, 2022 to 2029

Figure 125: Asia Pacific Excluding Japan Market Attractiveness Analysis by Country, 2022 to 2029

Figure 126: China Market Absolute $ Opportunity (US$ Million) Analysis, 2021 to 2029

Figure 127: India Market Absolute $ Opportunity (US$ Million) Analysis, 2021 to 2029

Figure 128: ASEAN Market Absolute $ Opportunity (US$ Million) Analysis, 2021 to 2029

Figure 129: Australia and New Zealand Market Absolute $ Opportunity (US$ Million) Analysis, 2021 to 2029

Figure 130: Rest of Asia Pacific excluding Japan Market Absolute $ Opportunity (US$ Million) Analysis, 2021 to 2029

Figure 131: Asia Pacific Excluding Japan Market Share Analysis by Enterprise Size – 2022 & 2029

Figure 132: Asia Pacific Excluding Japan Market Y-o-Y Growth by Enterprise Size, 2022 to 2029

Figure 133: Asia Pacific Excluding Japan Market Attractiveness Analysis by Enterprise Size, 2022 to 2029

Figure 134: Asia Pacific Excluding Japan Market Share Analysis by Function – 2022 & 2029

Figure 135: Asia Pacific excluding Japan Market Y-o-Y Growth by Function, 2022 to 2029

Figure 136: Asia Pacific Excluding Japan Market Attractiveness Analysis by Function, 2022 to 2029

Figure 137: Asia Pacific Excluding Japan Market Share Analysis by Use Case – 2022 & 2029

Figure 138: Asia Pacific excluding Japan Market Y-o-Y Growth by Use Case, 2022 to 2029

Figure 139: Asia Pacific Excluding Japan Market Attractiveness Analysis by Use Case, 2022 to 2029

Figure 140: Asia Pacific Excluding Japan Market Share Analysis by Vertical – 2022 & 2029

Figure 141: Asia Pacific Excluding Japan Market Y-o-Y Growth by Vertical, 2022 to 2029

Figure 142: Asia Pacific Excluding Japan Market Attractiveness Analysis by Vertical, 2022 to 2029

Figure 143: Japan Market Size (US$ Million) and Y-o-Y Growth Rate (%) from 2022 to 2029

Figure 144: Japan Market Absolute $ Opportunity (US$ Million), 2022 to 2029

Figure 145: Japan Market Share Analysis by Enterprise Size – 2022 & 2029

Figure 146: Japan Market Y-o-Y Growth by Enterprise Size, 2022 to 2029

Figure 147: Japan Market Attractiveness Analysis by Enterprise Size, 2022 to 2029

Figure 148: Japan Market Share Analysis by Function – 2022 & 2029

Figure 149: Japan Market Y-o-Y Growth by Function, 2022 to 2029

Figure 150: Japan Market Attractiveness Analysis by Function, 2022 to 2029

Figure 151: Japan Market Share Analysis by Use Case – 2022 & 2029

Figure 152: Japan Market Y-o-Y Growth by Use Case, 2022 to 2029

Figure 153: Japan Market Attractiveness Analysis by Use Case, 2022 to 2029

Figure 154: Japan Market Share Analysis by Vertical – 2022 & 2029

Figure 155: Japan Market Y-o-Y Growth by Vertical, 2022 to 2029

Figure 156: Japan Market Attractiveness Analysis by Vertical, 2022 to 2029

Figure 157: Middle East and Africa Market Size (US$ Million) and Y-o-Y Growth Rate (%) from 2022 to 2029

Figure 158: Middle East and Africa Market Absolute $ Opportunity (US$ Million), 2022 to 2029

Figure 159: Middle East and Africa Market Share Analysis by Country – 2022 & 2029

Figure 160: Middle East and Africa Market Y-o-Y Growth by Country, 2022 to 2029

Figure 161: Middle East and Africa Market Attractiveness Analysis by Country, 2022 to 2029

Figure 162: GCC Countries Market Absolute $ Opportunity (US$ Million) Analysis, 2021 to 2029

Figure 163: Northern Africa Market Absolute $ Opportunity (US$ Million) Analysis, 2021 to 2029

Figure 164: South Africa Market Absolute $ Opportunity (US$ Million) Analysis, 2021 to 2029

Figure 165: Turkey Market Absolute $ Opportunity (US$ Million) Analysis, 2021 to 2029

Figure 166: Israel Market Absolute $ Opportunity (US$ Million) Analysis, 2021 to 2029

Figure 167: Rest of Middle East and Africa Market Absolute $ Opportunity (US$ Million) Analysis, 2021 to 2029

Figure 168: Middle East and Africa Market Share Analysis by Enterprise Size – 2022 & 2029

Figure 169: Middle East and Africa Market Y-o-Y Growth by Enterprise Size, 2022 to 2029

Figure 170: Middle East and Africa Market Attractiveness Analysis by Enterprise Size, 2022 to 2029

Figure 171: Middle East and Africa Market Share Analysis by Function – 2022 & 2029

Figure 172: Middle East and Africa Market Y-o-Y Growth by Function, 2022 to 2029

Figure 173: Middle East and Africa Market Attractiveness Analysis by Function, 2022 to 2029

Figure 174: Middle East and Africa Market Share Analysis by Use Case – 2022 & 2029

Figure 175: Middle East and Africa Market Y-o-Y Growth by Use Case, 2022 to 2029

Figure 176: Middle East and Africa Market Attractiveness Analysis by Use Case, 2022 to 2029

Figure 177: Middle East and Africa Market Share Analysis by Vertical – 2022 & 2029

Figure 178: Middle East and Africa Market Y-o-Y Growth by Vertical, 2022 to 2029

Figure 179: Middle East and Africa Market Attractiveness Analysis by Vertical, 2022 to 2029

Figure 180: Global Market Share Analysis of Key Players

Frequently Asked Questions

What is the SQL server transformation market value in 2022?

In 2022, the global SQL server transformation market is worth USD 15.5 Billion.

In terms of CAGR, how is the SQL server transformation market projected to rise through 2029?

From 2022 to 2029, the global SQL server transformation market is projected to evolve at a stellar CAGR of 10.1%.

Which SQL server transformation companies are profiled in this research?

Key SQL server transformation providers are Oracle, Microsoft, SAP SE, IBM, Alphabet, Amazon Web Services Inc., and Teradata.

As per this SQL server transformation industry research survey, what are the metrics for 2029?

By 2029, SQL server transformation market revenue is anticipated to reach USD 30.4 Billion.

Which function holds a major market share?

Data integration scripts account for a dominant market share of 35.9%.

Explore Similar Insights

Future Market Insights

SQL Server Transformation Market