Shrink Sleeve Label Applicator Market
Market Insights on Shrink Sleeve Label Applicator covering sales outlook, demand forecast & up-to-date key trends
Shrink Sleeve Label Applicator Market by Automation (Semi-Automatic and Automatic), Labelling Speed (Up to 200 BPM, 200 BPM to 400 BPM, 400 BPM to 600 BPM), Container Diameter (Up to 50 mm, 50 to 100 mm, 100 mm to 150 mm),& Region - Forecast to 2022-2030
Shrink Sleeve Label Applicator Market Snapshot
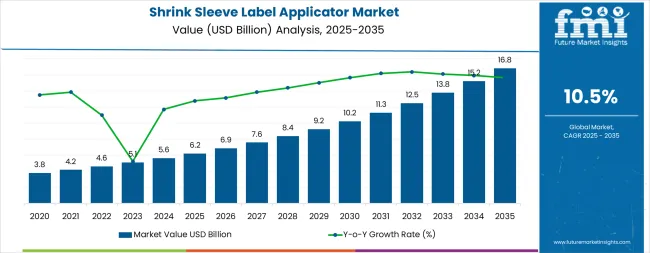
[237 Pages Report] The global shrink sleeve label applicator market is estimated to value at US$ 1.1 billion in 2022 and is projected to reach US$ 1.6 billion by 2030, at a CAGR of 5.0%.
Market Size 2022 |
US$ 1.1 Bn |
Market Size 2030 |
US$ 1.6 Bn |
Value CAGR (2022E-2030F) |
5.0% |
Top 3 Countries Market Share (2022) |
33% |
In the shrink sleeve label applicator market, food and beverages segments are collectively generating revenue of US$ 614 million in 2022, according to the annual market analysis conducted by Future Market Insights.
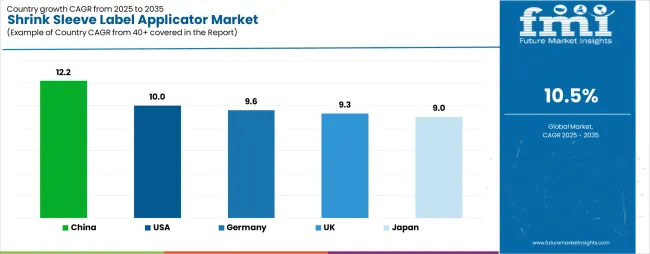
In 2022, the China shrink sleeve label applicator market expected to grow by 4.1% year on year, bucking initial skepticism about how the market would perform during a global pandemic. Total sales of shrink sleeve label applicator in China is estimated to clock US$ 144 million revenue in 2022.
Let us know your requirement to get
100% FREE customization
Historic and Forecast Market Outlook for Shrink Sleeve Label Applicator
The global shrink sleeve label applicator market is estimated to witness significant rise during the forecasted period due to its additional key benefits of shrink sleeve label applicators such as PLC scale control operation, touch screen HMI, operator-friendly interface, servo feed drive mechanism, and high speed operation attract substantial portion of manufacturers in the market and is projected to rise at 5.0% CAGR during the forecast period in comparison to the 3.0% CAGR during historical period.
Shrink sleeve label applicators are highly automated packaging machines predominantly used in several end-use industries for labelling applications. These applicators have ability to offer precise label casting for different sizes of containers with high level of accuracy.
The ability of these shrink sleeve label applicators to label thousands of containers with variety of diameters in lesser time makes them relevant and popular among end-use industry players. There are two types of shrink sleeve label applicators such as semi-automatic and automatic shrink sleeve label applicators available in the market. In this report, the global shrink sleeve label applicator market has been segmented on the basis of automation, labelling speed, container diameter, and end-use industry.
How does the Stringent Regulatory Requirements for Labelling to Uplift Market Growth?
Labelling on products is essential part of any industry as it provides required information about the products. Depending on the specific industry that a player operates in, there are various rules and regulations associated with packaging as well as labelling.
For instance, food and beverage, pharmaceutical, medical and chemical & fertilizers industries have strict labelling requirements prescribing product-specific labels, barcode standards for logistics and shipping bottles, containers, and many more. Failure to comply with any of these regulations and standards can result in fines. On the back of these factors, all manufacturers operating in the market are adopting labels for regulatory purposes.
The packaging and labelling industry has been impacted by many governmental decisions and regulations, from the original Food and Drug Act of 1906 [that banned interstate trade of adulterated and misbranded foods, drinks, and drugs] to the Dietary Supplement Health and Education Act of 1994 (DSHEA) (which established specific Labelling requirements for dietary supplements), and several others.
Stringent regulatory requirement associated with labeling, especially in food, beverage, and pharmaceutical industries drives the shrink sleeve label applicator market growth substantially.
How Modernization of Packaging Machinery Industry to Shape Shrink Sleeve Label Applicator Market Growth?
Technological advancement associated with packaging machineries is one of the crucial factors that propels the demand for shrink sleeve label applicators in the market. Consistently rising production output from food, beverage, pharmaceutical, personal care industries led manufacturers across the globe to utilize and adopt shrink sleeve label applicators for labelling purpose on bottles.
Additional key features such as touch panel control system, human machine interface (HMI) control, PLC control system, and others attract substantial portion of manufacturers in the market. Furthermore, availability of both fully automatic and semi-automatic shrink sleeve label applicators in the market ultimately facilitates and fulfills the labelling requirements of manufacturers.
Along with this, manufacturers are increasingly automating their production and packaging and labelling processes to reduce unnecessary labor cost. All these factors are likely to push the demand for shrink sleeve label applicators upwards during the foreseeable future.
Find your sweet spots for generating winning opportunities in this market.
Talk to AnalystWhat is the Impact of COVID-19 Pandemic on the Global Shrink Sleeve Label Applicator Market?
Rapid spread of COVID-19 has induced considerable impact on the shrink sleeve label applicator market. Fluctuation in demand for shrink sleeve label applicators from end use industries such as food, beverages and cosmetics and personal care has changed the sales pattern of shrink sleeve label applicators in last few months.
Post spread of COVID-19, food and beverages companies are witnessing the changing eating and drinking patterns of consumers and also facing considerably reduced consumption of food and beverages items which eventually affects the demand for shrink sleeve label applicators. Nevertheless, as things are getting back on track, the demand for shrink sleeve label applicators is likely to pick momentum in the beginning of 2021.
Country-wise Insights
How will the Booming Manufacturing Sector in India Drive the Demand for Bagging Equipment?
The shrink sleeve label applicator spending in the India is projected to expand at a CAGR of 8.6% during forecast period. The growing manufacturing sectors also increases the demand for efficient packaging solutions. According to the Packaging Industry Association of India (PIAI), the packaging market of the country is expected to reach US$ 2014.81 Bn by the end of 2025, registering a CAGR of 26.7% during the period 2020-2025. This significant growth of the packaging market and the Indian manufacturing sector is anticipated to drive the demand for shrink sleeve label applicator in the country.
How the Expansion of Food & Beverage Industry Fuel Demand for Shrink Sleeve Label Applicator Market in United Kingdom?
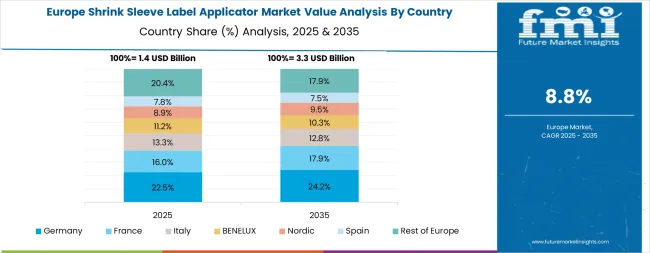
According to The Food and Drink Federation, the food and drink industry is the UK’s largest manufacturing sector. The U.K. is anticipated to hold market share of 15% in the shrink sleeve label applicator market in 2022. The food and drink industry contributing USD 33 billion to the economy annually and are a key part of the nation’s USD 135.4 billion ‘farm to fork’ food chain.
The FDF's economic reporting is a key avenue for ensuring that the economic importance of the UK food and drink industry is widely recognized, as well as its potential for growth and productivity improvements.

A unified Market Research Subscription Platform, built for today's disparate research needs.
Category-wise Insights
Which Type of Automation will Addition Substantial Traction for Shrink Sleeve Label Applicator Market?
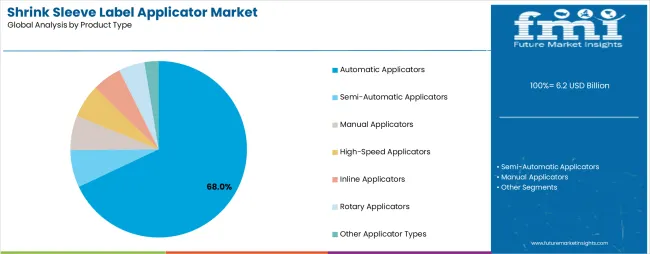
FMI team estimates that the industry players operating in the global food, beverage, pharmaceuticals, and cosmetic industries are opting for automatic shrink sleeve label applicators owing to its ability to provide precise labelling coupled with high labelling speed. Therefore, it is estimated that sales of shrink sleeve label applicator automatic will gain significant traction in near future and are expected to capture nearly 84% value share in the global market.
Which Foremost Segment based on End Use Industry is Fuelling the Growth of Shrink Sleeve Label Applicator Market?
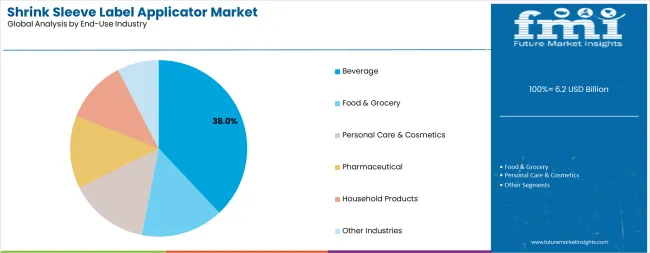
Based on end use industry, a substantial portion of the global shrink sleeve label applicator market is captured by the food and beverages industry and shall grow at a CAGR of 4.8% and 5.5% respectively during the forecast period. These industries are the prime end user of shrink sleeve label applicator and expected to create gratifying opportunities for manufacturers in the coming years.
Which Labelling Speed is Mostly Preferred for Shrink Sleeve Label Applicator by the End Users?
The rapid expansion of packaging has led to growth in consumption of shrink sleeve label applicator with a speed of 400 BPM to 600 BPM which is projected to hold the major share of the market with 34% in 2022.
Competitive Landscape
The key manufacturers operating in shrink sleeve label applicator market are focusing on increasing their production capacity to meet the increasing demand for shrink sleeve label applicator. Moreover, the key players are increasing their product portfolio to cater for the growing shrink sleeve label applicator market.
- In 2021, a company known as BW Packaging Systems changing its shrink sleeve technology. Downgauging has become a popular trend in shrink sleeve films and upgrade their software to increase end user accessibility.
- In 2021, a company named The Fresh Factory a mission-driven platform for plant-based and clean-label food and beverage brands, is excited to announce a partnership with Inovar Packaging and the installation of a new high-speed shrink-sleeve labeling machine, enabling the Company to expand its capabilities and growing list of services.
- In 2021, AB Graphic International (ABG) has rebranded a range of Enprom Solutions’ smart shrink sleeve machines to expand its offering.
Scope of Report
Attribute |
Details |
Forecast Period |
2022-2030 |
Historical Data Available for |
2015-2021 |
Market Analysis |
US$ Million for Value and Units for Volume |
Key Regions Covered |
North America, Latin America, Europe, East Asia, South Asia, the Middle East & Africa, and Oceania |
Key Countries Covered |
US, Canada, Brazil, Mexico, Germany, Italy, France, U.K., Spain, Russia, GCC Countries, China, India, Australia & New Zealand, and ASEAN |
Key Segments Covered |
Automation, Labelling Speed, Container Diameter, End Use Industry and Region |
Key Companies Profiled |
|
Report Coverage |
Market Forecast, Company Share Analysis, Competition Intelligence, DROT Analysis, Market Dynamics and Challenges, and Strategic Growth Initiatives |
Customization & Pricing |
Available upon Request |
Shrink Sleeve Label Applicator Market by Category
By Automation, Shrink Sleeve Label Applicator Market is Segmented as:
- Semi-Automatic
- Automatic
By Labelling Speed, Shrink Sleeve Label Applicator Market is Segmented as:
- Up to 200 BPM
- 200 BPM to 400 BPM
- 400 BPM to 600 BPM
- Above 600 BPM
By Container Diameter, Shrink Sleeve Label Applicator Market is Segmented as:
- Up to 50 mm
- 50 to 100 mm
- 100 mm to 150 mm
- Above 150 mm
By End Use Industry, Shrink Sleeve Label Applicator Market is Segmented as:
- Food
- Beverages
- Pharmaceutical
- Chemical & Fertilizers
- Cosmetics & Personal Care
- Construction
- Automotive
- Other Consumer Goods
By Region, Shrink Sleeve Label Applicator Market is Segmented as:
- North America
- Latin America
- Europe
- East Asia
- South Asia
- Middle East and Africa (MEA)
- Oceania
Frequently Asked Questions
The shrink sleeve label applicator market is projected to grow at a rate of 4.4%. Growing demand for innovative packaging solutions, especially, in the food and beverage industry, is likely to create substantial opportunities for market players.
The food and beverage industry continues to be a lucrative market, owing to its relentless need for product packaging. The beverage industry holds the maximum shares of the shrink sleeve label applicator packaging.
The list of top companies in this market comprise American Film & Machinery, Axon, LLC., Shanghai Keno Industrial Co., Ltd., Pack Leader USA, LLC., Shanghai Leadworld Machinery Technology Co., Ltd., MPI Label Systems, Inc., Multi Pack Machinery Company, , Maurti Machines Pvt. Ltd., PDC, Maharshi International and more.
The shrink sleeve label applicator has a few drawbacks which have always proven to be challenging, the fact that’s it’s not friendly to the environment doesn’t help. Social activism and innovative technology are proving to be obstacles.
Table of Content
1. Executive Summary
1.1. Global Market Analysis
1.2. Global Market Outlook
1.3. Analysis and Recommendations
2. Market Overview
2.1. Market Definition
2.2. Market Coverage
3. Key Market Trends
3.1. Key Trends Impacting the Market
3.2. Product Innovation / Development Trends
4. Key Success Factors
4.1. Product Adoption Analysis
4.2. Product USPs / Features
5. Global Sleeve Label Applicator Market Demand Analysis 2015-2021 and Forecast, 2022-2030
5.1. Historical Market Volume (Units) Analysis, 2015-2021
5.2. Current and Future Market Volume (Units) Projections, 2022-2030
5.3. Y-o-Y Growth Trend Analysis
6. Global Sleeve Label Applicator Market - Pricing Analysis
6.1. Regional Pricing Analysis, by Automation
6.2. Pricing Break-up
6.3. Global Average Pricing Analysis Benchmark
7. Global Sleeve Label Applicator Market Demand (US$ Mn) Analysis 2015-2021 and Forecast, 2022-2030
7.1. Historical Market Value (US$ Mn) Analysis, 2015-2021
7.2. Current and Future Market Value (US$ Mn) Projections, 2022-2030
7.2.1. Y-o-Y Growth Trend Analysis
7.2.2. Absolute $ Opportunity Analysis
8. Market Background
8.1. Global Packaging Market Overview
8.2. Global Chemical Industry Market Overview
8.3. Macro-Economic Factors & Co-relation Analysis
8.3.1. Manufacturing Value Added
8.3.2. Packaging Industry
8.3.3. Growth of Cosmetics & Personal Care Products
8.4. Forecast Factors - Relevance & Impact
8.4.1. Manufacturing Value Added
8.4.2. Segmental Revenue Growth of Key Players
8.4.3. Packaging Industry Growth and Market Assessment
8.4.4. Food & Beverage Industry Growth and Market Assessment
8.4.5. Pharmaceutical Industry Growth and Market Assessment
8.4.6. Chemical & Fertilizers Industry Growth
8.5. Value Chain Analysis
8.5.1. Key Participants
8.5.1.1. Raw Automation Suppliers
8.5.1.2. Sleeve Label Applicator Manufacturers
8.5.1.3. Distributors
8.5.1.4. End Users
8.5.2. Profitability Margin
8.6. Market Dynamics
8.6.1. Drivers
8.6.2. Restraints
8.6.3. Opportunity Analysis
9. Impact of COVID-19
9.1. Current Statistics and Probable Future Impact
9.2. Impact of COVID-19 on Sleeve Label Applicator Market
10. Global Sleeve Label Applicator Market Analysis 2015-2021 and Forecast 2022-2030, By Automation
10.1. Introduction
10.2. Historical Market Size (US$ Mn) and Volume (Units) Analysis, By Automation, 2015-2021
10.3. Current and Future Market Size (US$ Mn) and Volume (Units) Analysis and Forecast, By Automation, 2022-2030
10.3.1. Semi-Automatic
10.3.2. Automatic
10.4. Market Attractiveness Analysis, By Automation
11. Global Sleeve Label Applicator Market Analysis 2015-2021 and Forecast 2022-2030, By Labelling Speed
11.1. Introduction
11.2. Historical Market Size (US$ Mn) and Volume (Units) Analysis, By Labelling Speed, 2015-2021
11.3. Current and Future Market Size (US$ Mn) and Volume (Units) Analysis and Forecast, By Labelling Speed, 2022-2030
11.3.1. Up to 200 BPM
11.3.2. 200 BPM to 400 BPM
11.3.3. 400 BPM to 600 BPM
11.3.4. Above 600 BPM
11.4. Market Attractiveness Analysis, By Labelling Speed
12. Global Sleeve Label Applicator Market Analysis 2015-2021 and Forecast 2022-2030, By Container Diameter
12.1. Introduction
12.2. Historical Market Size (US$ Mn) and Volume (Units) Analysis, By Container Diameter, 2015-2021
12.3. Current and Future Market Size (US$ Mn) and Volume (Units) Analysis and Forecast, By Container Diameter, 2022-2030
12.3.1. Up to 50 mm
12.3.2. 50 to 100 mm
12.3.3. 100 mm to 150 mm
12.3.4. Above 150 mm
12.4. Market Attractiveness Analysis, By Container Diameter
13. Global Sleeve Label Applicator Market Analysis 2015-2021 and Forecast 2022-2030, By End Use Industry
13.1. Introduction
13.2. Historical Market Size (US$ Mn) and Volume (Units) Analysis, By End Use Industry, 2015-2021
13.3. Current and Future Market Size (US$ Mn) and Volume (Units) Analysis and Forecast, By End Use Industry, 2022-2030
13.3.1. Food
13.3.2. Beverages
13.3.3. Pharmaceutical
13.3.4. Chemical & Fertilizers
13.3.5. Cosmetics & Personal Care
13.3.6. Construction
13.3.7. Automotive
13.3.8. Other Consumer Goods
13.4. Market Attractiveness Analysis, By End Use Industry
14. Global Sleeve Label Applicator Market Analysis 2015-2021 and Forecast 2022-2030, by Region
14.1. Introduction
14.2. Historical Market Size (US$ Mn) and Volume (Units) Analysis, by Region, 2015-2021
14.3. Current Market Size (US$ Mn) and Volume (Units) Analysis and Forecast, by Region, 2022-2030
14.3.1. North America
14.3.2. Latin America
14.3.3. Europe
14.3.4. East Asia
14.3.5. South Asia
14.3.6. Middle East and Africa (MEA)
14.3.7. Oceania
14.4. Market Attractiveness Analysis, by Region
15. North America Sleeve Label Applicator Market Analysis 2015-2021 and Forecast 2022-2030
15.1. Introduction
15.2. Historical Market Size (US$ Mn) and Volume (Units) Trend Analysis, by Market Taxonomy, 2015-2021
15.3. Market Size (US$ Mn) and Volume (Units) Forecast, by Market Taxonomy, 2022-2030
15.3.1. By Country
15.3.1.1. U.S.
15.3.1.2. Canada
15.3.2. By Automation
15.3.3. By Labelling Speed
15.3.4. By Container Diameter
15.3.5. By End Use Industry
15.4. Market Attractiveness Analysis
15.4.1. By Country
15.4.2. By Automation
15.4.3. By Labelling Speed
15.4.4. By Container Diameter
15.4.5. By End Use Industry
15.5. Key Market Participants – Intensity Mapping
16. Latin America Sleeve Label Applicator Market Analysis 2015-2021 and Forecast 2022-2030
16.1. Introduction
16.2. Historical Market Size (US$ Mn) and Volume (Units) Trend Analysis, by Market Taxonomy, 2015-2021
16.3. Market Size (US$ Mn) and Volume (Units) Forecast, by Market Taxonomy, 2022-2030
16.3.1. By Country
16.3.1.1. Brazil
16.3.1.2. Mexico
16.3.1.3. Argentina
16.3.1.4. Rest of Latin America
16.3.2. By Automation
16.3.3. By Labelling Speed
16.3.4. By Container Diameter
16.3.5. By End Use Industry
16.4. Market Attractiveness Analysis
16.4.1. By Country
16.4.2. By Automation
16.4.3. By Labelling Speed
16.4.4. By Container Diameter
16.4.5. By End Use Industry
16.5. Key Market Participants – Intensity Mapping
17. Europe Sleeve Label Applicator Market Analysis 2015-2021 and Forecast 2022-2030
17.1. Introduction
17.2. Historical Market Size (US$ Mn) and Volume (Units) Trend Analysis, by Market Taxonomy, 2015-2021
17.3. Market Size (US$ Mn) and Volume (Units) Forecast, by Market Taxonomy, 2022-2030
17.3.1. By Country
17.3.1.1. Germany
17.3.1.2. Italy
17.3.1.3. France
17.3.1.4. UK
17.3.1.5. Spain
17.3.1.6. BENELUX
17.3.1.7. Russia
17.3.1.8. Rest of Europe
17.3.2. By Automation
17.3.3. By Labelling Speed
17.3.4. By Container Diameter
17.3.5. By End Use Industry
17.4. Market Attractiveness Analysis
17.4.1. By Country
17.4.2. By Automation
17.4.3. By Labelling Speed
17.4.4. By Container Diameter
17.4.5. By End Use Industry
17.5. Key Market Participants – Intensity Mapping
18. East Asia Sleeve Label Applicator Market Analysis 2015-2021 and Forecast 2022-2030
18.1. Introduction
18.2. Historical Market Size (US$ Mn) and Volume (Units) Trend Analysis, by Market Taxonomy, 2015-2021
18.3. Market Size (US$ Mn) and Volume (Units) Forecast, by Market Taxonomy, 2022-2030
18.3.1. By Country
18.3.1.1. China
18.3.1.2. Japan
18.3.1.3. Taiwan
18.3.1.4. South Korea
18.3.2. By Automation
18.3.3. By Labelling Speed
18.3.4. By Container Diameter
18.3.5. By End Use Industry
18.4. Market Attractiveness Analysis
18.4.1. By Country
18.4.2. By Automation
18.4.3. By Labelling Speed
18.4.4. By Container Diameter
18.4.5. By End Use Industry
18.5. Key Market Participants – Intensity Mapping
19. South Asia Sleeve Label Applicator Market Analysis 2015-2021 and Forecast 2022-2030
19.1. Introduction
19.2. Historical Market Size (US$ Mn) and Volume (Units) Trend Analysis, by Market Taxonomy, 2015-2021
19.3. Market Size (US$ Mn) and Volume (Units) Forecast, by Market Taxonomy, 2022-2030
19.3.1. By Country
19.3.1.1. India
19.3.1.2. Thailand
19.3.1.3. Indonesia
19.3.1.4. Vietnam
19.3.1.5. Malaysia
19.3.1.6. Rest of South Asia
19.3.2. By Automation
19.3.3. By Labelling Speed
19.3.4. By Container Diameter
19.3.5. By End Use Industry
19.4. Market Attractiveness Analysis
19.4.1. By Country
19.4.2. By Automation
19.4.3. By Labelling Speed
19.4.4. By Container Diameter
19.4.5. By End Use Industry
19.5. Key Market Participants – Intensity Mapping
20. Oceania Sleeve Label Applicator Market Analysis 2015-2021 and Forecast 2022-2030
20.1. Introduction
20.2. Historical Market Size (US$ Mn) and Volume (Units) Trend Analysis, by Market Taxonomy, 2015-2021
20.3. Market Size (US$ Mn) and Volume (Units) Forecast, by Market Taxonomy, 2022-2030
20.3.1. By Country
20.3.1.1. Australia
20.3.1.2. New Zealand
20.3.2. By Automation
20.3.3. By Labelling Speed
20.3.4. By Container Diameter
20.3.5. By End Use Industry
20.4. Market Attractiveness Analysis
20.4.1. By Country
20.4.2. By Automation
20.4.3. By Labelling Speed
20.4.4. By Container Diameter
20.4.5. By End Use Industry
20.5. Key Market Participants – Intensity Mapping
21. Middle East and Africa Sleeve Label Applicator Market Analysis 2015-2021 and Forecast 2022-2030
21.1. Introduction
21.2. Historical Market Size (US$ Mn) and Volume (Units) Trend Analysis, by Market Taxonomy, 2015-2021
21.3. Market Size (US$ Mn) and Volume (Units) Forecast, by Market Taxonomy, 2022-2030
21.3.1. By Country
21.3.1.1. GCC
21.3.1.2. Turkey
21.3.1.3. South Africa
21.3.1.4. North Africa
21.3.1.5. Rest of Middle East and Africa
21.3.2. By Automation
21.3.3. By Labelling Speed
21.3.4. By Container Diameter
21.3.5. By End Use Industry
21.4. Market Attractiveness Analysis
21.4.1. By Country
21.4.2. By Automation
21.4.3. By Labelling Speed
21.4.4. By Container Diameter
21.4.5. By End Use Industry
21.5. Key Market Participants – Intensity Mapping
22. Sleeve Label Applicator Market Country wise Analysis 2022 & 2030
22.1. U.S. Sleeve Label Applicator Market Analysis
22.1.1. Introduction
22.1.2. Market Value Proportion Analysis, by Market Taxonomy
22.1.3. Market Volume (Units) and Value (US$ Mn) Analysis and Forecast, by Market Taxonomy
22.1.3.1. By Automation
22.1.3.2. By Labelling Speed
22.1.3.3. By Container Diameter
22.1.3.4. By End Use Industry
22.2. Canada Sleeve Label Applicator Market Analysis
22.2.1. Introduction
22.2.2. Market Value Proportion Analysis, by Market Taxonomy
22.2.3. Market Volume (Units) and Value (US$ Mn) Analysis and Forecast, by Market Taxonomy
22.2.3.1. By Automation
22.2.3.2. By Labelling Speed
22.2.3.3. By Container Diameter
22.2.3.4. By End Use Industry
22.3. Brazil Sleeve Label Applicator Market Analysis
22.3.1. Introduction
22.3.2. Market Value Proportion Analysis, by Market Taxonomy
22.3.3. Market Volume (Units) and Value (US$ Mn) Analysis and Forecast, by Market Taxonomy
22.3.3.1. By Automation
22.3.3.2. By Labelling Speed
22.3.3.3. By Container Diameter
22.3.3.4. By End Use Industry
22.4. Mexico Sleeve Label Applicator Market Analysis
22.4.1. Introduction
22.4.2. Market Value Proportion Analysis, by Market Taxonomy
22.4.3. Market Volume (Units) and Value (US$ Mn) Analysis and Forecast, by Market Taxonomy
22.4.3.1. By Automation
22.4.3.2. By Labelling Speed
22.4.3.3. By Container Diameter
22.4.3.4. By End Use Industry
22.5. Germany Sleeve Label Applicator Market Analysis
22.5.1. Introduction
22.5.2. Market Value Proportion Analysis, by Market Taxonomy
22.5.3. Market Volume (Units) and Value (US$ Mn) Analysis and Forecast, by Market Taxonomy
22.5.3.1. By Automation
22.5.3.2. By Labelling Speed
22.5.3.3. By Container Diameter
22.5.3.4. By End Use Industry
22.6. Italy Sleeve Label Applicator Market Analysis
22.6.1. Introduction
22.6.2. Market Value Proportion Analysis, by Market Taxonomy
22.6.3. Market Volume (Units) and Value (US$ Mn) Analysis and Forecast, by Market Taxonomy
22.6.3.1. By Automation
22.6.3.2. By Labelling Speed
22.6.3.3. By Container Diameter
22.6.3.4. By End Use Industry
22.7. France Sleeve Label Applicator Market Analysis
22.7.1. Introduction
22.7.2. Market Value Proportion Analysis, by Market Taxonomy
22.7.3. Market Volume (Units) and Value (US$ Mn) Analysis and Forecast, by Market Taxonomy
22.7.3.1. By Automation
22.7.3.2. By Labelling Speed
22.7.3.3. By Container Diameter
22.7.3.4. By End Use Industry
22.8. U.K. Sleeve Label Applicator Market Analysis
22.8.1. Introduction
22.8.2. Market Value Proportion Analysis, by Market Taxonomy
22.8.3. Market Volume (Units) and Value (US$ Mn) Analysis and Forecast, by Market Taxonomy
22.8.3.1. By Automation
22.8.3.2. By Labelling Speed
22.8.3.3. By Container Diameter
22.8.3.4. By End Use Industry
22.9. Spain Sleeve Label Applicator Market Analysis
22.9.1. Introduction
22.9.2. Market Value Proportion Analysis, by Market Taxonomy
22.9.3. Market Volume (Units) and Value (US$ Mn) Analysis and Forecast, by Market Taxonomy
22.9.3.1. By Automation
22.9.3.2. By Labelling Speed
22.9.3.3. By Container Diameter
22.9.3.4. By End Use Industry
22.10. Russia Sleeve Label Applicator Market Analysis
22.10.1. Introduction
22.10.2. Market Value Proportion Analysis, by Market Taxonomy
22.10.3. Market Volume (Units) and Value (US$ Mn) Analysis and Forecast, by Market Taxonomy
22.10.3.1. By Automation
22.10.3.2. By Labelling Speed
22.10.3.3. By Container Diameter
22.10.3.4. By End Use Industry
22.11. GCC Countries Sleeve Label Applicator Market Analysis
22.11.1. Introduction
22.11.2. Market Value Proportion Analysis, by Market Taxonomy
22.11.3. Market Volume (Units) and Value (US$ Mn) Analysis and Forecast, by Market Taxonomy
22.11.3.1. By Automation
22.11.3.2. By Labelling Speed
22.11.3.3. By Container Diameter
22.11.3.4. By End Use Industry
22.12. China Sleeve Label Applicator Market Analysis
22.12.1. Introduction
22.12.2. Market Value Proportion Analysis, by Market Taxonomy
22.12.3. Market Volume (Units) and Value (US$ Mn) Analysis and Forecast, by Market Taxonomy
22.12.3.1. By Automation
22.12.3.2. By Labelling Speed
22.12.3.3. By Container Diameter
22.12.3.4. By End Use Industry
22.13. India Sleeve Label Applicator Market Analysis
22.13.1. Introduction
22.13.2. Market Value Proportion Analysis, by Market Taxonomy
22.13.3. Market Volume (Units) and Value (US$ Mn) Analysis and Forecast, by Market Taxonomy
22.13.3.1. By Automation
22.13.3.2. By Labelling Speed
22.13.3.3. By Container Diameter
22.13.3.4. By End Use Industry
22.14. Australia & New Zealand Sleeve Label Applicator Market Analysis
22.14.1. Introduction
22.14.2. Market Value Proportion Analysis, by Market Taxonomy
22.14.3. Market Volume (Units) and Value (US$ Mn) Analysis and Forecast, by Market Taxonomy
22.14.3.1. By Automation
22.14.3.2. By Labelling Speed
22.14.3.3. By Container Diameter
22.14.3.4. By End Use Industry
23. Market Structure Analysis
23.1. Market Analysis, by Tier of Sleeve Label Applicator Companies
23.2. Market Share Analysis of Top Players
23.3. Market Presence Analysis
24. Competition Analysis
24.1. Competition Dashboard
24.2. Competition Benchmarking
24.3. Competition Deep Dive
24.3.1. Fuji Seal International, Inc.
24.3.1.1. hOverview
24.3.1.2. Product Portfolio
24.3.1.3. Profitability by Market Segments
24.3.1.4. Sales Footprint
24.3.1.5. Strategy Overview
24.3.1.5.1. Marketing Strategy
24.3.1.5.2. Product Strategy
24.3.1.5.3. Channel Strategy
24.3.2. Krones
24.3.2.1. Overview
24.3.2.2. Product Portfolio
24.3.2.3. Profitability by Market Segments
24.3.2.4. Sales Footprint
24.3.2.5. Strategy Overview
24.3.2.5.1. Marketing Strategy
24.3.2.5.2. Product Strategy
24.3.2.5.3. Channel Strategy
24.3.3. KARALILLE
24.3.3.1. Overview
24.3.3.2. Product Portfolio
24.3.3.3. Profitability by Market Segments
24.3.3.4. Sales Footprint
24.3.3.5. Strategy Overview
24.3.3.5.1. Marketing Strategy
24.3.3.5.2. Product Strategy
24.3.3.5.3. Channel Strategy
24.3.4. FINPAC
24.3.4.1. Overview
24.3.4.2. Product Portfolio
24.3.4.3. Profitability by Market Segments
24.3.4.4. Sales Footprint
24.3.4.5. Strategy Overview
24.3.4.5.1. Marketing Strategy
24.3.4.5.2. Product Strategy
24.3.4.5.3. Channel Strategy
24.3.5. DASE-SING
24.3.5.1. Overview
24.3.5.2. Product Portfolio
24.3.5.3. Profitability by Market Segments
24.3.5.4. Sales Footprint
24.3.5.5. Strategy Overview
24.3.5.5.1. Marketing Strategy
24.3.5.5.2. Product Strategy
24.3.5.5.3. Channel Strategy
24.3.6. XYP
24.3.6.1. Overview
24.3.6.2. Product Portfolio
24.3.6.3. Profitability by Market Segments
24.3.6.4. Sales Footprint
24.3.6.5. Strategy Overview
24.3.6.5.1. Marketing Strategy
24.3.6.5.2. Product Strategy
24.3.6.5.3. Channel Strategy
24.3.7. Esleeve
24.3.7.1. Overview
24.3.7.2. Product Portfolio
24.3.7.3. Profitability by Market Segments
24.3.7.4. Sales Footprint
24.3.7.5. Strategy Overview
24.3.7.5.1. Marketing Strategy
24.3.7.5.2. Product Strategy
24.3.7.5.3. Channel Strategy
24.3.8. Pack Leader
24.3.8.1. Overview
24.3.8.2. Product Portfolio
24.3.8.3. Profitability by Market Segments
24.3.8.4. Sales Footprint
24.3.8.5. Strategy Overview
24.3.8.5.1. Marketing Strategy
24.3.8.5.2. Product Strategy
24.3.8.5.3. Channel Strategy
24.3.9. King Hong
24.3.9.1. Overview
24.3.9.2. Product Portfolio
24.3.9.3. Profitability by Market Segments
24.3.9.4. Sales Footprint
24.3.9.5. Strategy Overview
24.3.9.5.1. Marketing Strategy
24.3.9.5.2. Product Strategy
24.3.9.5.3. Channel Strategy
24.3.10. DELMAX MACHINERY
24.3.10.1. Overview
24.3.10.2. Product Portfolio
24.3.10.3. Profitability by Market Segments
24.3.10.4. Sales Footprint
24.3.10.5. Strategy Overview
24.3.10.5.1. Marketing Strategy
24.3.10.5.2. Product Strategy
24.3.10.5.3. Channel Strategy
24.3.11. Benison
24.3.11.1. Overview
24.3.11.2. Product Portfolio
24.3.11.3. Profitability by Market Segments
24.3.11.4. Sales Footprint
24.3.11.5. Strategy Overview
24.3.11.5.1. Marketing Strategy
24.3.11.5.2. Product Strategy
24.3.11.5.3. Channel Strategy
24.3.12. MAGIC SPECIAL PURPOSE MACHINERIES PVT. LTD.
24.3.12.1. Overview
24.3.12.2. Product Portfolio
24.3.12.3. Profitability by Market Segments
24.3.12.4. Sales Footprint
24.3.12.5. Strategy Overview
24.3.12.5.1. Marketing Strategy
24.3.12.5.2. Product Strategy
24.3.12.5.3. Channel Strategy
24.3.13. Maharshi
24.3.13.1. Overview
24.3.13.2. Product Portfolio
24.3.13.3. Profitability by Market Segments
24.3.13.4. Sales Footprint
24.3.13.5. Strategy Overview
24.3.13.5.1. Marketing Strategy
24.3.13.5.2. Product Strategy
24.3.13.5.3. Channel Strategy
24.3.14. PDC
24.3.14.1. Overview
24.3.14.2. Product Portfolio
24.3.14.3. Profitability by Market Segments
24.3.14.4. Sales Footprint
24.3.14.5. Strategy Overview
24.3.14.5.1. Marketing Strategy
24.3.14.5.2. Product Strategy
24.3.14.5.3. Channel Strategy
24.3.15. Sleever international
24.3.15.1. Overview
24.3.15.2. Product Portfolio
24.3.15.3. Profitability by Market Segments
24.3.15.4. Sales Footprint
24.3.15.5. Strategy Overview
24.3.15.5.1. Marketing Strategy
24.3.15.5.2. Product Strategy
24.3.15.5.3. Channel Strategy
24.3.16. Axon
24.3.16.1. Overview
24.3.16.2. Product Portfolio
24.3.16.3. Profitability by Market Segments
24.3.16.4. Sales Footprint
24.3.16.5. Strategy Overview
24.3.16.5.1. Marketing Strategy
24.3.16.5.2. Product Strategy
24.3.16.5.3. Channel Strategy
24.3.17. Label-Aire, Inc.
24.3.17.1. Overview
24.3.17.2. Product Portfolio
24.3.17.3. Profitability by Market Segments
24.3.17.4. Sales Footprint
24.3.17.5. Strategy Overview
24.3.17.5.1. Marketing Strategy
24.3.17.5.2. Product Strategy
24.3.17.5.3. Channel Strategy
24.3.18. Sleeve Technology
24.3.18.1. Overview
24.3.18.2. Product Portfolio
24.3.18.3. Profitability by Market Segments
24.3.18.4. Sales Footprint
24.3.18.5. Strategy Overview
24.3.18.5.1. Marketing Strategy
24.3.18.5.2. Product Strategy
24.3.18.5.3. Channel Strategy
24.3.19. Scaligera
24.3.19.1. Overview
24.3.19.2. Product Portfolio
24.3.19.3. Profitability by Market Segments
24.3.19.4. Sales Footprint
24.3.19.5. Strategy Overview
24.3.19.5.1. Marketing Strategy
24.3.19.5.2. Product Strategy
24.3.19.5.3. Channel Strategy
24.3.20. Accraply
24.3.20.1. Overview
24.3.20.2. Product Portfolio
24.3.20.3. Profitability by Market Segments
24.3.20.4. Sales Footprint
24.3.20.5. Strategy Overview
24.3.20.5.1. Marketing Strategy
24.3.20.5.2. Product Strategy
24.3.20.5.3. Channel Strategy
24.3.21. Tripack
24.3.21.1. Overview
24.3.21.2. Product Portfolio
24.3.21.3. Profitability by Market Segments
24.3.21.4. Sales Footprint
24.3.21.5. Strategy Overview
24.3.21.5.1. Marketing Strategy
24.3.21.5.2. Product Strategy
24.3.21.5.3. Channel Strategy
25. Assumptions and Acronyms Used
26. Research Methodology
Let us know your requirement to get
100% FREE customization
List of Tables
Table 01: Global Sleeve Label Applicator Market Volume (Units) Analysis, by Automation 2015(H)-2030(F)
Table 02: Global Sleeve Label Applicator Market Value (US$ Mn) Analysis, by Automation 2015(H)-2030(F)
Table 03: Global Sleeve Label Applicator Market Volume (Units) Analysis, by Labelling Speed 2015(H)-2030(F)
Table 04: Global Sleeve Label Applicator Market Value (US$ Mn) Analysis, by Labelling Speed 2015(H)-2030(F)
Table 05: Global Sleeve Label Applicator Market Volume (Units) Analysis, by Container Diameter 2015(H)-2030(F)
Table 06: Global Sleeve Label Applicator Market Value (US$ Mn) Analysis, by Container Diameter 2015(H)-2030(F)
Table 07: Global Sleeve Label Applicator Market Volume (Units) Analysis, by End Use Industry 2015(H)-2030(F)
Table 08: Global Sleeve Label Applicator Market Value (US$ Mn) Analysis, by End Use Industry 2015(H)-2030(F)
Table 09: Global Sleeve Label Applicator Market Volume (Units) Analysis, by Region 2015(H)-2030(F)
Table 10: Global Sleeve Label Applicator Market Value (US$ Mn) Analysis, by Region 2015(H)-2030(F)
Table 11: North America Sleeve Label Applicator Market Volume (Units) Analysis, by Automation 2015(H)-2030(F)
Table 12: North America Sleeve Label Applicator Market Value (US$ Mn) Analysis, by Automation 2015(H)-2030(F)
Table 13: North America Sleeve Label Applicator Market Volume (Units) Analysis, by Labelling Speed 2015(H)-2030(F)
Table 14: North America Sleeve Label Applicator Market Value (US$ Mn) Analysis, by Labelling Speed 2015(H)-2030(F)
Table 15: North America Sleeve Label Applicator Market Volume (Units) Analysis, by Container Diameter 2015(H)-2030(F)
Table 16: North America Sleeve Label Applicator Market Value (US$ Mn) Analysis, by Container Diameter 2015(H)-2030(F)
Table 17: North America Sleeve Label Applicator Market Volume (Units) Analysis, by End Use Industry 2015(H)-2030(F)
Table 18: North America Sleeve Label Applicator Market Value (US$ Mn) Analysis, by End Use Industry 2015(H)-2030(F)
Table 19: North America Sleeve Label Applicator Market Volume (Units) Analysis, by Country 2015(H)-2030(F)
Table 20: North America Sleeve Label Applicator Market Value (US$ Mn) Analysis, by Country 2015(H)-2030(F)
Table 21: Latin America Sleeve Label Applicator Market Volume (Units) Analysis, by Automation 2015(H)-2030(F)
Table 22: Latin America Sleeve Label Applicator Market Value (US$ Mn) Analysis, by Automation 2015(H)-2030(F)
Table 23: Latin America Sleeve Label Applicator Market Volume (Units) Analysis, by Labelling Speed 2015(H)-2030(F)
Table 24: Latin America Sleeve Label Applicator Market Value (US$ Mn) Analysis, by Labelling Speed 2015(H)-2030(F)
Table 25: Latin America Sleeve Label Applicator Market Volume (Units) Analysis, by Container Diameter 2015(H)-2030(F)
Table 26: Latin America Sleeve Label Applicator Market Value (US$ Mn) Analysis, by Container Diameter 2015(H)-2030(F)
Table 27: Latin America Sleeve Label Applicator Market Volume (Units) Analysis, by End Use Industry 2015(H)-2030(F)
Table 28: Latin America Sleeve Label Applicator Market Value (US$ Mn) Analysis, by End Use Industry 2015(H)-2030(F)
Table 29: Latin America Sleeve Label Applicator Market Volume (Units) Analysis, by Country 2015(H)-2030(F)
Table 30: Latin America Sleeve Label Applicator Market Value (US$ Mn) Analysis, by Country 2015(H)-2030(F)
Table 31: Europe Sleeve Label Applicator Market Volume (Units) Analysis, by Automation 2015(H)-2030(F)
Table 32: Europe Sleeve Label Applicator Market Value (US$ Mn) Analysis, by Automation 2015(H)-2030(F)
Table 33: Europe Sleeve Label Applicator Market Volume (Units) Analysis, by Labelling Speed 2015(H)-2030(F)
Table 34: Europe Sleeve Label Applicator Market Value (US$ Mn) Analysis, by Labelling Speed 2015(H)-2030(F)
Table 35: Europe Sleeve Label Applicator Market Volume (Units) Analysis, by Container Diameter 2015(H)-2030(F)
Table 36: Europe Sleeve Label Applicator Market Value (US$ Mn) Analysis, by Container Diameter 2015(H)-2030(F)
Table 37: Europe Sleeve Label Applicator Market Volume (Units) Analysis, by End Use Industry 2015(H)-2030(F)
Table 38: Europe Sleeve Label Applicator Market Value (US$ Mn) Analysis, by End Use Industry 2015(H)-2030(F)
Table 39: Europe Sleeve Label Applicator Market Volume (Units) Analysis, by Country 2015(H)-2030(F)
Table 40: Europe Sleeve Label Applicator Market Value (US$ Mn) Analysis, by Country 2015(H)-2030(F)
Table 41: East Asia Sleeve Label Applicator Market Volume (Units) Analysis, by Automation 2015(H)-2030(F)
Table 42: East Asia Sleeve Label Applicator Market Value (US$ Mn) Analysis, by Automation 2015(H)-2030(F)
Table 43: East Asia Sleeve Label Applicator Market Volume (Units) Analysis, by Labelling Speed 2015(H)-2030(F)
Table 44: East Asia Sleeve Label Applicator Market Value (US$ Mn) Analysis, by Labelling Speed 2015(H)-2030(F)
Table 45: East Asia Sleeve Label Applicator Market Volume (Units) Analysis, by Container Diameter 2015(H)-2030(F)
Table 46: East Asia Sleeve Label Applicator Market Value (US$ Mn) Analysis, by Container Diameter 2015(H)-2030(F)
Table 47: East Asia Sleeve Label Applicator Market Volume (Units) Analysis, by End Use Industry 2015(H)-2030(F)
Table 48: East Asia Sleeve Label Applicator Market Value (US$ Mn) Analysis, by End Use Industry 2015(H)-2030(F)
Table 49: East Asia Sleeve Label Applicator Market Volume (Units) Analysis, by Country 2015(H)-2030(F)
Table 50: East Asia Sleeve Label Applicator Market Value (US$ Mn) Analysis, by Country 2015(H)-2030(F)
Table 51: South Asia Sleeve Label Applicator Market Volume (Units) Analysis, by Automation 2015(H)-2030(F)
Table 52: South Asia Sleeve Label Applicator Market Value (US$ Mn) Analysis, by Automation 2015(H)-2030(F)
Table 53: South Asia Sleeve Label Applicator Market Volume (Units) Analysis, by Labelling Speed 2015(H)-2030(F)
Table 54: South Asia Sleeve Label Applicator Market Value (US$ Mn) Analysis, by Labelling Speed 2015(H)-2030(F)
Table 55: South Asia Sleeve Label Applicator Market Volume (Units) Analysis, by Container Diameter 2015(H)-2030(F)
Table 56: South Asia Sleeve Label Applicator Market Value (US$ Mn) Analysis, by Container Diameter 2015(H)-2030(F)
Table 57: South Asia Sleeve Label Applicator Market Volume (Units) Analysis, by End Use Industry 2015(H)-2030(F)
Table 58: South Asia Sleeve Label Applicator Market Value (US$ Mn) Analysis, by End Use Industry 2015(H)-2030(F)
Table 59: South Asia Sleeve Label Applicator Market Volume (Units) Analysis, by Country 2015(H)-2030(F)
Table 60: South Asia Sleeve Label Applicator Market Value (US$ Mn) Analysis, by Country 2015(H)-2030(F)
Table 61: MEA Sleeve Label Applicator Market Volume (Units) Analysis, by Automation 2015(H)-2030(F)
Table 62: MEA Sleeve Label Applicator Market Value (US$ Mn) Analysis, by Automation 2015(H)-2030(F)
Table 63: MEA Sleeve Label Applicator Market Volume (Units) Analysis, by Labelling Speed 2015(H)-2030(F)
Table 64: MEA Sleeve Label Applicator Market Value (US$ Mn) Analysis, by Labelling Speed 2015(H)-2030(F)
Table 65: MEA Sleeve Label Applicator Market Volume (Units) Analysis, by Container Diameter 2015(H)-2030(F)
Table 66: MEA Sleeve Label Applicator Market Value (US$ Mn) Analysis, by Container Diameter 2015(H)-2030(F)
Table 67: MEA Sleeve Label Applicator Market Volume (Units) Analysis, by End Use Industry 2015(H)-2030(F)
Table 68: MEA Sleeve Label Applicator Market Value (US$ Mn) Analysis, by Container Diameters 2015(H)-2030(F)
Table 69: MEA Sleeve Label Applicator Market Volume (Units) Analysis, by Country 2015(H)-2030(F)
Table 70: MEA Sleeve Label Applicator Market Value (US$ Mn) Analysis, by Country 2015(H)-2030(F)
Table 71: Oceania Sleeve Label Applicator Market Volume (Units) Analysis, by Automation 2015(H)-2030(F)
Table 72: Oceania Sleeve Label Applicator Market Value (US$ Mn) Analysis, by Automation 2015(H)-2030(F)
Table 73: Oceania Sleeve Label Applicator Market Volume (Units) Analysis, by Labelling Speed 2015(H)-2030(F)
Table 74: Oceania Sleeve Label Applicator Market Value (US$ Mn) Analysis, by Labelling Speed 2015(H)-2030(F)
Table 75: Oceania Sleeve Label Applicator Market Volume (Units) Analysis, by Container Diameter 2015(H)-2030(F)
Table 76: Oceania Sleeve Label Applicator Market Value (US$ Mn) Analysis, by Container Diameter 2015(H)-2030(F)
Table 77: Oceania Sleeve Label Applicator Market Volume (Units) Analysis, by End Use Industry 2015(H)-2030(F)
Table 78: Oceania Sleeve Label Applicator Market Value (US$ Mn) Analysis, by End Use Industry 2015(H)-2030(F)
Table 79: Oceania Sleeve Label Applicator Market Volume (Units) Analysis, by Country 2015(H)-2030(F)
Table 80: Oceania Sleeve Label Applicator Market Value (US$ Mn) Analysis, by Country 2015(H)-2030(F)
Find your sweet spots for generating winning opportunities in this market.
Talk to AnalystList of Charts
Figure 01: Global Sleeve Label Applicator Market Attractiveness Analysis, by Automation, 2022(E)-2030(F)
Figure 02: Global Sleeve Label Applicator Market Share Analysis, by Automation, 2022(E)-2030(F)
Figure 03: Global Sleeve Label Applicator Market Y-o-Y Growth Analysis, by Automation, 2019(H)-2030(F)
Figure 04: Global Sleeve Label Applicator Market Attractiveness Analysis, by Labelling Speed, 2022(E)-2030(F)
Figure 05: Global Sleeve Label Applicator Market Share Analysis, by Labelling Speed, 2022(E)-2030(F)
Figure 06: Global Sleeve Label Applicator Market Y-o-Y Growth Analysis, by Labelling Speed, 2019(H)-2030(F)
Figure 07: Global Sleeve Label Applicator Market Share Analysis, by Container Diameter, 2022(E)-2030(F)
Figure 08: Global Sleeve Label Applicator Market Attractiveness Analysis, by Container Diameter, 2022(E)-2030(F)
Figure 09: Global Sleeve Label Applicator Market Y-o-Y Growth Analysis, by Container Diameter, 2019(H)-2030(F)
Figure 10: Global Sleeve Label Applicator Market Share Analysis, by End Use Industry, 2022(E)-2030(F)
Figure 11: Global Sleeve Label Applicator Market Attractiveness Analysis, by End Use Industry, 2022(E)-2030(F)
Figure 12: Global Sleeve Label Applicator Market Y-o-Y Growth Analysis, by End Use Industry, 2019(H)-2030(F)
Figure 13: Global Sleeve Label Applicator Market Share Analysis, by Region, 2022(E)-2030(F)
Figure 14: Global Sleeve Label Applicator Market Attractiveness Analysis, by Region, 2022(E)-2030(F)
Figure 15: Global Sleeve Label Applicator Market Y-o-Y Growth Analysis, by Region, 2019(H)-2030(F)
Figure 16: North America Sleeve Label Applicator Market Value Share Analysis by Container Diameter, 2022E-2030F
Figure 17: North America Sleeve Label Applicator Market Share Analysis by Labelling Speed, 2022E
Figure 18: North America Sleeve Label Applicator Market Y-o-Y Growth Analysis by Automation, 2019H-2030F
Figure 19: North America Sleeve Label Applicator Market Share Analysis by Country, 2022E
Figure 20: North America Sleeve Label Applicator Market Attractiveness Analysis by End Use Industry, 2022E-2030F
Figure 21: Latin America Sleeve Label Applicator Market Value Share Analysis by Container Diameter, 2022E-2030F
Figure 22: Latin America Sleeve Label Applicator Market Share Analysis by Labelling Speed, 2022E
Figure 23: Latin America Sleeve Label Applicator Market Y-o-Y Growth Analysis by Automation, 2019H-2030F
Figure 24: Latin America Sleeve Label Applicator Market Share Analysis by Country, 2022E
Figure 25: Latin America Sleeve Label Applicator Market Attractiveness Analysis by End Use Industry, 2022E-2030F
Figure 26: Europe Sleeve Label Applicator Market Value Share Analysis by Container Diameter, 2022E-2030F
Figure 27: Europe Sleeve Label Applicator Market Share Analysis by Labelling Speed, 2022E
Figure 28: Europe Sleeve Label Applicator Market Y-o-Y Growth Analysis by Automation, 2019H-2030F
Figure 29: Europe Sleeve Label Applicator Market Share Analysis by Country, 2022E
Figure 30: Europe Sleeve Label Applicator Market Attractiveness Analysis by End Use Industry, 2022E-2030F
Figure 31: East Asia Sleeve Label Applicator Market Value Share Analysis by Container Diameter, 2022E-2030F
Figure 32: East Asia Sleeve Label Applicator Market Share Analysis by Labelling Speed, 2022E
Figure 33: East Asia Sleeve Label Applicator Market Y-o-Y Growth Analysis by Automation, 2019H-2030F
Figure 34: East Asia Sleeve Label Applicator Market Share Analysis by Country, 2022E
Figure 35: East Asia Sleeve Label Applicator Market Attractiveness Analysis by End Use Industry, 2022E-2030F
Figure 36: South Asia Sleeve Label Applicator Market Value Share Analysis by Container Diameter, 2022E-2030F
Figure 37: South Asia Sleeve Label Applicator Market Share Analysis by Labelling Speed, 2022E
Figure 38: South Asia Sleeve Label Applicator Market Y-o-Y Growth Analysis by Automation, 2019H-2030F
Figure 39: South Asia Sleeve Label Applicator Market Share Analysis by Country, 2022E
Figure 40: South Asia Sleeve Label Applicator Market Attractiveness Analysis by End Use Industry, 2022E-2030F
Figure 41: MEA Sleeve Label Applicator Market Value Share Analysis by Container Diameter, 2022E-2030F
Figure 42: MEA Sleeve Label Applicator Market Share Analysis by Labelling Speed, 2022E
Figure 43: MEA Sleeve Label Applicator Market Y-o-Y Growth Analysis by Automation, 2019H-2030F
Figure 44: MEA Sleeve Label Applicator Market Share Analysis by Country, 2022E
Figure 45: MEA Sleeve Label Applicator Market Attractiveness Analysis by End Use Industry, 2022E-2030F
Figure 46: Oceania Sleeve Label Applicator Market Value Share Analysis by Container Diameter, 2022E-2030F
Figure 47: Oceania Sleeve Label Applicator Market Share Analysis by Labelling Speed, 2022E
Figure 48: Oceania Sleeve Label Applicator Market Y-o-Y Growth Analysis by Automation, 2019H-2030F
Figure 49: Oceania Sleeve Label Applicator Market Attractiveness Analysis by End Use Industry, 2022E-2030F
Figure 50: Oceania Sleeve Label Applicator Market Share Analysis by Country, 2022E
Figure 51: U.S. Sleeve Label Applicator Market Value Share Analysis, by Automation, 2022E & 2030F
Figure 52: U.S. Sleeve Label Applicator Market Value Share Analysis, by Labelling Speed, 2022E & 2030F
Figure 53: U.S. Sleeve Label Applicator Market Value Share Analysis, by Container Diameter, 2022E & 2030F
Figure 54: U.S. Sleeve Label Applicator Market Value Share Analysis, by End Use Industry, 2022E & 2030F
Figure 55: Canada Sleeve Label Applicator Market Value Share Analysis, by Automation, 2022E & 2030F
Figure 56: Canada Sleeve Label Applicator Market Value Share Analysis, by Labelling Speed, 2022E & 2030F
Figure 57: Canada Sleeve Label Applicator Market Value Share Analysis, by Container Diameter, 2022E & 2030F
Figure 58: Canada Sleeve Label Applicator Market Value Share Analysis, by End Use Industry, 2022E & 2030F
Figure 59: Brazil Sleeve Label Applicator Market Value Share Analysis, by Automation, 2022E & 2030F
Figure 60: Brazil Sleeve Label Applicator Market Value Share Analysis, by Labelling Speed, 2022E & 2030F
Figure 61: Brazil Sleeve Label Applicator Market Value Share Analysis, by Container Diameter, 2022E & 2030F
Figure 62: Brazil Sleeve Label Applicator Market Value Share Analysis, by End Use Industry, 2022E & 2030F
Figure 63: Mexico Sleeve Label Applicator Market Value Share Analysis, by Automation, 2022E & 2030F
Figure 64: Mexico Sleeve Label Applicator Market Value Share Analysis, by Labelling Speed, 2022E & 2030F
Figure 65: Mexico Sleeve Label Applicator Market Value Share Analysis, by Container Diameter, 2022E & 2030F
Figure 66: Mexico Sleeve Label Applicator Market Value Share Analysis, by End Use Industry, 2022E & 2030F
Figure 67: China Sleeve Label Applicator Market Value Share Analysis, by Automation, 2022E & 2030F
Figure 68: China Sleeve Label Applicator Market Value Share Analysis, by Labelling Speed, 2022E & 2030F
Figure 69: China Sleeve Label Applicator Market Value Share Analysis, by Container Diameter, 2022E & 2030F
Figure 70: China Sleeve Label Applicator Market Value Share Analysis, by End Use Industry, 2022E & 2030F
Figure 71: India Sleeve Label Applicator Market Value Share Analysis, by Automation, 2022E & 2030F
Figure 72: India Sleeve Label Applicator Market Value Share Analysis, by Labelling Speed, 2022E & 2030F
Figure 73: India Sleeve Label Applicator Market Value Share Analysis, by Container Diameter, 2022E & 2030F
Figure 74: India Sleeve Label Applicator Market Value Share Analysis, by End Use Industry, 2022E & 2030F
Figure 75: Australia & New Zealand Sleeve Label Applicator Market Value Share Analysis, by Automation, 2022E & 2030F
Figure 76: Australia & New Zealand Sleeve Label Applicator Market Value Share Analysis, by Labelling Speed, 2022E & 2030F
Figure 77: Australia & New Zealand Sleeve Label Applicator Market Value Share Analysis, by Container Diameter, 2022E & 2030F
Figure 78: Australia & New Zealand Sleeve Label Applicator Market Value Share Analysis, by End Use Industry, 2022E & 2030F
Figure 79: Germany Sleeve Label Applicator Market Value Share Analysis, by Automation, 2022E & 2030F
Figure 80: Germany Sleeve Label Applicator Market Value Share Analysis, by Labelling Speed, 2022E & 2030F
Figure 81: Germany Sleeve Label Applicator Market Value Share Analysis, by Container Diameter, 2022E & 2030F
Figure 82: Germany Sleeve Label Applicator Market Value Share Analysis, by End Use Industry, 2022E & 2030F
Figure 83: Italy Sleeve Label Applicator Market Value Share Analysis, by Automation, 2022E & 2030F
Figure 84: Italy Sleeve Label Applicator Market Value Share Analysis, by Labelling Speed, 2022E & 2030F
Figure 85: Italy Sleeve Label Applicator Market Value Share Analysis, by Container Diameter, 2022E & 2030F
Figure 86: Italy Sleeve Label Applicator Market Value Share Analysis, by End Use Industry, 2022E & 2030F
Figure 87: France Sleeve Label Applicator Market Value Share Analysis, by Automation, 2022E & 2030F
Figure 88: France Sleeve Label Applicator Market Value Share Analysis, by Labelling Speed, 2022E & 2030F
Figure 89: France Sleeve Label Applicator Market Value Share Analysis, by Container Diameter, 2022E & 2030F
Figure 90: France Sleeve Label Applicator Market Value Share Analysis, by End Use Industry, 2022E & 2030F
Figure 91: U.K. Sleeve Label Applicator Market Value Share Analysis, by Automation, 2022E & 2030F
Figure 92: U.K. Sleeve Label Applicator Market Value Share Analysis, by Labelling Speed, 2022E & 2030F
Figure 93: U.K. Sleeve Label Applicator Market Value Share Analysis, by Container Diameter, 2022E & 2030F
Figure 94: U.K. Sleeve Label Applicator Market Value Share Analysis, by End Use Industry, 2022E & 2030F
Figure 95: Spain Sleeve Label Applicator Market Value Share Analysis, by Automation, 2022E & 2030F
Figure 96: Spain Sleeve Label Applicator Market Value Share Analysis, by Labelling Speed, 2022E & 2030F
Figure 97: Spain Sleeve Label Applicator Market Value Share Analysis, by Container Diameter, 2022E & 2030F
Figure 98: Spain Sleeve Label Applicator Market Value Share Analysis, by End Use Industry, 2022E & 2030F
Figure 99: Russia Sleeve Label Applicator Market Value Share Analysis, by Automation, 2022E & 2030F
Figure 100: Russia Sleeve Label Applicator Market Value Share Analysis, by Labelling Speed, 2022E & 2030F
Figure 101: Russia Sleeve Label Applicator Market Value Share Analysis, by Container Diameter, 2022E & 2030F
Figure 102: Russia Sleeve Label Applicator Market Value Share Analysis, by End Use Industry, 2022E & 2030F
Figure 103: Poland Sleeve Label Applicator Market Value Share Analysis, by Automation, 2022E & 2030F
Figure 104: Poland Sleeve Label Applicator Market Value Share Analysis, by Labelling Speed, 2022E & 2030F
Figure 105: Poland Sleeve Label Applicator Market Value Share Analysis, by Container Diameter, 2022E & 2030F
Figure 106: Poland Sleeve Label Applicator Market Value Share Analysis, by End Use Industry, 2022E & 2030F
Figure 107: GCC Sleeve Label Applicator Market Value Share Analysis, by Automation, 2022E & 2030F
Figure 108: GCC Sleeve Label Applicator Market Value Share Analysis, by Labelling Speed, 2022E & 2030F
Figure 109: GCC Sleeve Label Applicator Market Value Share Analysis, by Container Diameter, 2022E & 2030F
Figure 110: GCC Sleeve Label Applicator Market Value Share Analysis, by End Use Industry, 2022E & 2030F
Figure 111: South Africa Sleeve Label Applicator Market Value Share Analysis, by Automation, 2022E & 2030F
Figure 112: South Africa Sleeve Label Applicator Market Value Share Analysis, by Labelling Speed, 2022E & 2030F
Figure 113: South Africa Sleeve Label Applicator Market Value Share Analysis, by Container Diameter, 2022E & 2030F
Figure 114: South Africa Sleeve Label Applicator Market Value Share Analysis, by End Use Industry, 2022E & 2030F
Figure 115: North Africa Sleeve Label Applicator Market Value Share Analysis, by Automation, 2022E & 2030F
Figure 116: North Africa Sleeve Label Applicator Market Value Share Analysis, by Labelling Speed, 2022E & 2030F
Figure 117: North Africa Sleeve Label Applicator Market Value Share Analysis, by Container Diameter, 2022E & 2030F
Need specific information?
Request CustomizationExplore Packaging Insights
View Reports