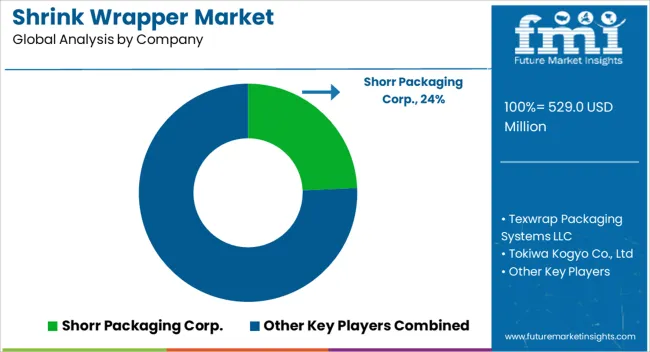
Shrink Wrapper Market
Market Insights on Shrink Wrapper covering sales outlook, demand forecast & up-to-date key trends
Shrink Wrapper Market by Product Type, Process, End Use Industry & Region - Forecast 2022 – 2032
Shrink Wrapper Market Outlook (2022-2032)
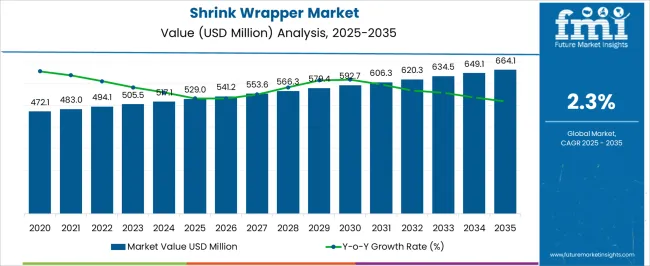
[250 Pages Report] The global shrink wrapper market is expected to total US$ 842.3 Mn in 2022. Expanding at a CAGR of 7.2%, the market value is projected to surpass US$ 1.7 Bn by 2032. The shrink wrapper market was valued at US$ 790 Mn at the end of 2021 and is anticipated to exhibit Y-o-Y growth of 5.1% in 2022
Shrink Wrapper Market Estimated Size (2022) |
US$ 842.3 Mn |
Projected Market Valuation (2032) |
US$ 1,685.7 Mn |
Value-based CAGR (2022-2032) |
7.2% |
Top Companies Market Share |
15-20% |
The global shrink wrapper market is estimated to hold 2-6% of the global packaging machines market worth US$ 49 Bn in 2021.
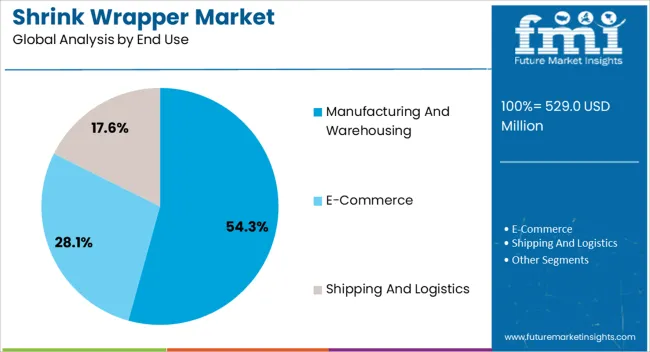
The demand for shrink wrapper in the food & beverage sector is expected to increase at a 6.1% CAGR during the assessment period. In addition to this, high adoption of shrink wrappers in consumer electronics, cosmetics, and personal care industries will create opportunities for growth in the market over the forecast period.
Let us know your requirement to get
100% FREE customization
2015-2021 Shrink Wrapper Market Historic Outlook Vs 2022-2032 Forecast
Demand for shrink wrappers is expected to increase at a 7.2% CAGR over the forecast period, in comparison to the 5.4% CAGR registered between 2015 to 2021.
Shrink wrappers are used for wrapping and providing 360-degree protection to the product from various environmental factors including dust, moisture, and UV rays. Depending upon product volume, shrink wrappers are used at various stages of packaging – primary, secondary or tertiary. However, almost 80% of the industries use shrink wrappers for primary and secondary packaging and bundling of small size bundles.
The demand for shrink wrappers is expected to bolster in next five years as these films provide high shelf appeal, good tamper resistance and offer good printability for branding and promotions of the product.
Furthermore, shrink wrappers reduce the overall cost of packaging by almost 50% and reduce weight of the package by 80% due to less material required for packaging as compared to traditional and rigid packaging formats.
Shrink wrappers are also cost-effective over stretch wrappers and corrugated fibreboard boxes machines. They require less processing time and manpower, which in turn is driving their adoption for value-added packaging across various industries.
How is Increasing Focus on Minimizing Food Wastage Boosting Sales of Shrink Wrappers?
Today, food wastage is a prime concern across the globe. Consumable products such as meat, vegetables, fruits, and many others are perishable and quickly result in spoilage in the absence of right packaging formats.
As per the recent report on food waste index report 2021 published by UN Environment Programme (UNEP), around 931 Mn Tonnes food waste was generated in 2019 wherein 16% food waste is generated from household, 26% from food service and 13% from retail.
Although household segment is the leading source of food waste, it is observed that most of the food products turn in to waste during transit and before reaching to retail shops and supermarkets/hypermarkets, especially in summer. The wastage of food not only results in health risk but also in increasing greenhouse gas emission by 8-10%.
Also, as per insights published by British Plastic Federation, food wastage in developing countries is approximately 50%, whereas in the U.K., 3% goes to waste before it reaches shops. Apart from this, almost 50% of the total amount of food waste in the U.K. is collected from homes. The estimated average cost of this waste is around US$ 492 (£ 470) per year.
To minimize this waste, consumers are preferring plastic packaging formats that have good barrier strength and ensure longer shelf life of food products. Shrink wrap and modified atmospheric packaging enhance shelf life of the product by 8-10 days, thereby reducing food waste from 16% to 4%.
On the back of these factors and increasing need for minimizing food waste during transportation and storage, demand for shrink wrappers will increase at a considerable pace over the forecast period.
Find your sweet spots for generating winning opportunities in this market.
Talk to AnalystWill the Introduction of Vertical Shrink Wrappers Influence Demand?
Vertical shrink wrappers eliminate the problem of upright product positioning as wrappers can automatically wrap multipacks of bottles, jars or cans standing upright directly from the fillers. With no requirement for manual re-arranging of items preceding wrapping, containers can now go straight from filling to wrapping, and palletizing and circulation in-line, without interference.
Some of the leading manufacturers such as SIG Group offer a combined solution of shrink wrapping and tray packaging with inbuilt intelligence. A combined tray packaging and shrink-wrapping equipment is considered as an excellent solution for wrapping a variety of products in different sizes that need to be grouped together as per their types.
The system integrates multiple infeed lanes and intelligent sensors that route products into the correct one. As a result, this unit is used as part of filling line to add trays and shrink-wrapping to different kinds of products.
Country-wise insights
How is the U.S. Shrink Wrapper Market Faring?
“Increasing Adoption of Shrink-Wrapping Machines in the U.S. Will Boost Sales”
The U.S. shrink wrapper market is estimated to expand at a 5.8% CAGR over the assessment period.
According to the Flexible Packaging Association, flexible packaging is the 2nd largest packaging segment in the U.S., accounting for about 19% of the US$ 177 Bn U.S. packaging market and had US$ 33.6 Bn in sales in 2019.
As flexible packaging makes products more convenient, enjoyable, and safer for consumers and extends the shelf life of product, the demand for shrink wrappers is gaining traction in the U.S.
Why is the India Shrink Wrapper Market Considered Lucrative?
“Rising Demand for Flexible Packaging in India Will Boost Sales of Shrink Wrappers”
According to the Packaging Industry Association of India, the India packaging market was valued at US$ 50.5 Bn in 2019 and is expected to grow by US$ 204.81 Bn by 2025.
As packaging is among the high growth industries in India and is developing @22-25% P.A. it is expected to propel the demand for shrink wrappers. Sales of shrink wrappers in India are forecast to increase at a 8.3% CAGR over the assessment period.

An unified Market Research Subscription Platform, built for today’s disparate research needs.
Category-wise Insights
Which Is the Most Preferred Product Type for Shrink Wrappers?
“Demand for L-bar Sealers to Gain Traction”
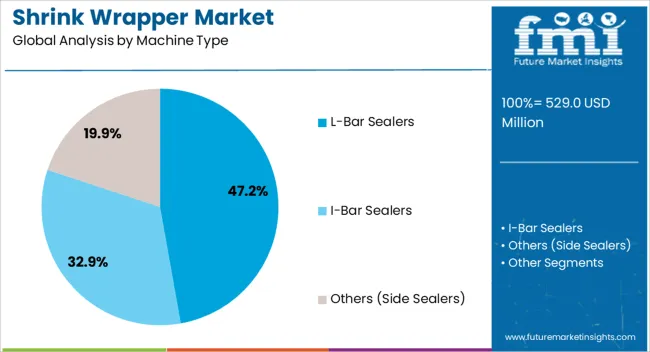
Based on product type, the L-bar sealers segment is projected to account for the highest market for around 41.4%. L-bar sealers are more productive than I-bar sealers, due to two sealing bars in shape of backward L and are cost-effective.
During the forecast period, sales in the L-bar sealer segment are expected to grow at a CAGR of 6.4%.
Why is the Demand for Shrink Wrappers in the Food and Beverage Segment Increasing?
“Adoption of Shrink Wrappers in the Food and Beverage Sector To Remain High”
As the global demand for packaged foods is increasing significantly, shrink wraps are becoming more popular. Shrink wrap is primarily used in food packaging and bundling a variety of food items as it increases the shelf life of the product. These wrappers are extensively used in meat packaging as they protect the product from coming into contact with oxygen and prevent spoiling.
One of the benefits of shrink wrap is that the film is clear and transparent which makes the product visible even when enclosed in the packaging. This helps the consumer to gauge the quality of the product.
Competitive Landscape
Due to the existence of many local and regional competitors, the shrink wrapper market is fragmented and very competitive. Key participants are investing in mergers and acquisitions, developments, expansions, and associations to expand their global presence. Most of the key players operating in the shrink film market are switching towards the usage of renewable and sustainable energy for production. Some of the recent developments in the market are as follows:
- In August 2021, Texwrap Packaging Systems LLC launched its e-pack series shrink wrapper for e-commerce solutions.
- In January 2021, Duravant’s Packaging Solutions launched NVenia as a leading equipment design for primary and end-of-line packaging solutions.
Scope of the Report
Attribute |
Details |
Estimated Market Size (2022) |
US$ 843.2 Mn |
Projected Market Valuation (2032) |
US$ 1,685.7 Mn |
Value-based CAGR (2022-2032) |
7.2% CAGR |
Forecast Period |
2022-2032 |
Historical Data Available for |
2015-2021 |
Market Analysis |
US$ Mn for Value |
Key Countries Covered |
The U.S., Canada, Mexico, Brazil, Germany, the U.K., France, Italy, Spain, Russia, China, Japan, India, GCC countries, and Australia |
Key Regions Covered |
North America, Latin America, Europe, East Asia, South Asia, the Middle East & Africa, and Oceania |
Key Segments Covered |
Product Type, Process, End Use Industry and Region |
Key Companies Profiled |
|
Report Coverage |
Market Forecast, Company Share Analysis, Competition Intelligence, DROT Analysis, Market Dynamics and Challenges, and Strategic Growth Initiatives |
Global Shrink Wrapper Market by Category
By Product Type:
- L-bar Sealers
- I-bar Sealers
- Side Sealers
By Process:
- Manual
- Semi-Automatic
- Automatic
By End Use Industry:
- Food & Beverage
- Pharmaceutical
- Cosmetics & Personal Care
- Home Care
- Automotive
- Electrical & Electronics
- Logistics & Transport
By Region:
- North America
- Latin America
- Europe
- South Asia
- East Asia
- Middle East & Africa
- Oceania
Frequently Asked Questions
The global shrink wrapper market size was valued at US$ 790.4 Mn in 2021 and is expected to expand at a compound annual growth rate (CAGR) of 7.2% from 2022 to 2032.
During the forecast period, the L-bar Sealers is likely to be the fastest-growing product type in the worldwide shrink wrapper market due to its functioning and is ideal for quick and easy shrink packaging.
The major manufactures of shrink wrapper are Standard-Knapp, Inc., Texwrap Packaging Systems LLC, Klikwood Corporation, Sidel Group and Robopac-Aetna Group S.p.A.
The market for shrink wrapper is expected to attract investment opportunities of US$ 843.4 Mn by the end of research period.
1. Executive Summary
1.1. Global Market Outlook
1.2. Demand-side Trends
1.3. Supply-side Trends
1.4. Technology Roadmap Analysis
1.5. Analysis and Recommendations
2. Market Overview
2.1. Market Coverage / Taxonomy
2.2. Market Definition / Scope / Limitations
3. Market Background
3.1. Market Dynamics
3.1.1. Drivers
3.1.2. Restraints
3.1.3. Opportunity
3.1.4. Trends
3.2. COVID-19 impact
3.2.1. Demand in Optimistic Scenario
3.2.2. Demand in Likely Scenario
3.2.3. Demand in Conservative Scenario
3.3. Value Chain Analysis
3.3.1. Raw Material Providers
3.3.2. Manufacturers
3.3.3. Wholesalers and Distributors
3.3.4. End Users
3.4. Regulatory Landscape
3.4.1. By Key Regions
3.4.2. By Key Countries
3.5. Production and Consumption Statistics
3.6. Import and Export Statistics
4. Global Shrink Wrapper Market Analysis 2015-2021 and Forecast, 2022-2032
4.1. Historical Market Size Value (US$ Mn) & Volume (Units) Analysis, 2015-2021
4.2. Current and Future Market Size Value (US$ Mn) & Volume (Units) Projections, 2022-2032
4.2.1. Y-o-Y Growth Trend Analysis
4.2.2. Absolute $ Opportunity Analysis
5. Global Shrink Wrapper Market Analysis 2015-2021 and Forecast 2022-2032, By Product Type
5.1. Introduction / Key Findings
5.2. Historical Market Size Value (US$ Mn) & Volume (Units) Analysis By Product Type, 2015-2021
5.3. Current and Future Market Size Value (US$ Mn) & Volume (Units) Analysis and Forecast By Product Type, 2022-2032
5.3.1. L-bar Sealers
5.3.2. I-bar Sealers
5.3.3. Side Sealers
5.4. Y-o-Y Growth Trend Analysis By Product Type, 2015-2021
5.5. Absolute $ Opportunity Analysis By Product Type, 2022-2032
6. Global Shrink Wrapper Market Analysis 2015-2021 and Forecast 2022-2032, By Process
6.1. Introduction / Key Findings
6.2. Historical Market Size Value (US$ Mn) & Volume (Units) Analysis By Process, 2015-2021
6.3. Current and Future Market Size Value (US$ Mn) & Volume (Units) Analysis and Forecast By Process, 2022-2032
6.3.1. Manual
6.3.2. Automatic
6.3.3. Semi-Automatic
6.4. Y-o-Y Growth Trend Analysis By Process, 2015-2021
6.5. Absolute $ Opportunity Analysis By Process, 2022-2032
7. Global Shrink Wrapper Market Analysis 2015-2021 and Forecast 2022-2032, By End Use Industry
7.1. Introduction / Key Findings
7.2. Historical Market Size Value (US$ Mn) & Volume (Units) Analysis By End Use Industry, 2015-2021
7.3. Current and Future Market Size Value (US$ Mn) & Volume (Units) Analysis and Forecast By End Use Industry, 2022-2032
7.3.1. Food and Beverage
7.3.2. Pharmaceutical
7.3.3. Home Care
7.3.4. Cosmetics & Personal Care
7.3.5. Automotive
7.3.6. Electrical & Electronics
7.3.7. Logistics & Transportation
7.4. Y-o-Y Growth Trend Analysis By End Use Industry, 2015-2021
7.5. Absolute $ Opportunity Analysis By End Use Industry, 2022-2032
8. Global Shrink Wrapper Market Analysis 2015-2021 and Forecast 2022-2032, By Region
8.1. Introduction
8.2. Historical Market Size Value (US$ Mn) & Volume (Units) Analysis By Region, 2015-2021
8.3. Current Market Size Value (US$ Mn) & Volume (Units) Analysis and Forecast By Region, 2022-2032
8.3.1. North America
8.3.2. Latin America
8.3.3. Europe
8.3.4. East Asia
8.3.5. South Asia
8.3.6. Oceania
8.3.7. MEA
8.4. Market Attractiveness Analysis By Region
9. North America Shrink Wrapper Market Analysis 2015-2021 and Forecast 2022-2032, By Country
9.1. Historical Market Size Value (US$ Mn) & Volume (Units) Trend Analysis By Market Taxonomy, 2015-2021
9.2. Market Size Value (US$ Mn) & Volume (Units) Forecast By Market Taxonomy, 2022-2032
9.2.1. By Country
9.2.1.1. U.S.
9.2.1.2. Canada
9.2.2. By Product Type
9.2.3. By Process
9.2.4. By End Use Industry
9.3. Market Attractiveness Analysis
9.3.1. By Country
9.3.2. By Product Type
9.3.3. By Process
9.3.4. By End Use Industry
9.4. Key Takeaways
10. Latin America Shrink Wrapper Market Analysis 2015-2021 and Forecast 2022-2032, By Country
10.1. Historical Market Size Value (US$ Mn) & Volume (Units) Trend Analysis By Market Taxonomy, 2015-2021
10.2. Market Size Value (US$ Mn) & Volume (Units) Forecast By Market Taxonomy, 2022-2032
10.2.1. By Country
10.2.1.1. Brazil
10.2.1.2. Mexico
10.2.1.3. Argentina
10.2.1.4. Chile
10.2.1.5. Peru
10.2.1.6. Rest of Latin America
10.2.2. By Product Type
10.2.3. By Process
10.2.4. By End Use Industry
10.3. Market Attractiveness Analysis
10.3.1. By Country
10.3.2. By Product Type
10.3.3. By Process
10.3.4. By End Use Industry
10.4. Key Takeaways
11. Europe Shrink Wrapper Market Analysis 2015-2021 and Forecast 2022-2032, By Country
11.1. Historical Market Size Value (US$ Mn) & Volume (Units) Trend Analysis By Market Taxonomy, 2015-2021
11.2. Market Size Value (US$ Mn) & Volume (Units) Forecast By Market Taxonomy, 2022-2032
11.2.1. By Country
11.2.1.1. Germany
11.2.1.2. Italy
11.2.1.3. France
11.2.1.4. U.K.
11.2.1.5. Spain
11.2.1.6. Russia
11.2.1.7. BENELUX
11.2.1.8. Rest of Europe
11.2.2. By Product Type
11.2.3. By Process
11.2.4. By End Use Industry
11.3. Market Attractiveness Analysis
11.3.1. By Country
11.3.2. By Product Type
11.3.3. By Process
11.3.4. By End Use Industry
11.4. Key Takeaways
12. East Asia Shrink Wrapper Market Analysis 2015-2021 and Forecast 2022-2032, By Country
12.1. Historical Market Size Value (US$ Mn) & Volume (Units) Trend Analysis By Market Taxonomy, 2015-2021
12.2. Market Size Value (US$ Mn) & Volume (Units) Forecast By Market Taxonomy, 2022-2032
12.2.1. By Country
12.2.1.1. China
12.2.1.2. Japan
12.2.1.3. South Korea
12.2.2. By Product Type
12.2.3. By Process
12.2.4. By End Use Industry
12.3. Market Attractiveness Analysis
12.3.1. By Country
12.3.2. By Product Type
12.3.3. By Process
12.3.4. By End Use Industry
12.4. Key Takeaways
13. South Asia Shrink Wrapper Market Analysis 2015-2021 and Forecast 2022-2032, By Country
13.1. Historical Market Size Value (US$ Mn) & Volume (Units) Trend Analysis By Market Taxonomy, 2015-2021
13.2. Market Size Value (US$ Mn) & Volume (Units) Forecast By Market Taxonomy, 2022-2032
13.2.1. By Country
13.2.1.1. India
13.2.1.2. Thailand
13.2.1.3. Malaysia
13.2.1.4. Indonesia
13.2.1.5. Rest of South Asia
13.2.2. By Product Type
13.2.3. By Process
13.2.4. By End Use Industry
13.3. Market Attractiveness Analysis
13.3.1. By Country
13.3.2. By Product Type
13.3.3. By Process
13.3.4. By End Use Industry
13.4. Key Takeaways
14. Oceania Shrink Wrapper Market Analysis 2015-2021 and Forecast 2022-2032, By Country
14.1. Historical Market Size Value (US$ Mn) & Volume (Units) Trend Analysis By Market Taxonomy, 2015-2021
14.2. Market Size Value (US$ Mn) & Volume (Units) Forecast By Market Taxonomy, 2022-2032
14.2.1. By Country
14.2.1.1. Australia
14.2.1.2. New Zealand
14.2.2. By Product Type
14.2.3. By Process
14.2.4. By End Use Industry
14.3. Market Attractiveness Analysis
14.3.1. By Country
14.3.2. By Product Type
14.3.3. By Process
14.3.4. By End Use Industry
14.4. Key Takeaways
15. MEA Shrink Wrapper Market Analysis 2015-2021 and Forecast 2022-2032, By Country
15.1. Historical Market Size Value (US$ Mn) & Volume (Units) Trend Analysis By Market Taxonomy, 2015-2021
15.2. Market Size Value (US$ Mn) & Volume (Units) Forecast By Market Taxonomy, 2022-2032
15.2.1. By Country
15.2.1.1. GCC
15.2.1.2. North Africa
15.2.1.3. Southern Africa
15.2.1.4. Turkey
15.2.1.5. Rest of MEA
15.2.2. By Product Type
15.2.3. By Process
15.2.4. By End Use Industry
15.3. Market Attractiveness Analysis
15.3.1. By Country
15.3.2. By Product Type
15.3.3. By Process
15.3.4. By End Use Industry
15.4. Key Takeaways
16. Key Countries Shrink Wrapper Market Analysis
16.1. U.S.
16.1.1. Market Share Analysis, 2021
16.1.1.1. By Product Type
16.1.1.2. By Process
16.1.1.3. By End Use Industry
16.2. Canada
16.2.1. Market Share Analysis, 2021
16.2.1.1. By Product Type
16.2.1.2. By Process
16.2.1.3. By End Use Industry
16.3. Brazil
16.3.1. Market Share Analysis, 2021
16.3.1.1. By Product Type
16.3.1.2. By Process
16.3.1.3. By End Use Industry
16.4. Mexico
16.4.1. Market Share Analysis, 2021
16.4.1.1. By Product Type
16.4.1.2. By Process
16.4.1.3. By End Use Industry
16.5. Argentina
16.5.1. Market Share Analysis, 2021
16.5.1.1. By Product Type
16.5.1.2. By Process
16.5.1.3. By End Use Industry
16.6. China
16.6.1. Market Share Analysis, 2021
16.6.1.1. By Product Type
16.6.1.2. By Process
16.6.1.3. By End Use Industry
16.7. India
16.7.1. Market Share Analysis, 2021
16.7.1.1. By Product Type
16.7.1.2. By Process
16.7.1.3. By End Use Industry
16.8. Germany
16.8.1. Market Share Analysis, 2021
16.8.1.1. By Product Type
16.8.1.2. By Process
16.8.1.3. By End Use Industry
16.9. Italy
16.9.1. Market Share Analysis, 2021
16.9.1.1. By Product Type
16.9.1.2. By Process
16.9.1.3. By End Use Industry
16.10. Australia
16.10.1. Market Share Analysis, 2021
16.10.1.1. By Product Type
16.10.1.2. By Process
16.10.1.3. By End Use Industry
17. Market Structure Analysis
17.1. Competition Dashboard
17.2. Competition Benchmarking
17.3. Market Share Analysis of Top Players
18. Competition Analysis
18.1. Competition Deep Dive
18.1.1. Shorr Packaging Corp.
18.1.1.1. Overview
18.1.1.2. Product Portfolio
18.1.1.3. Profitability by Market Segments (Product/Age /Sales Channel/Region)
18.1.1.4. Sales Footprint
18.1.1.5. Strategy Overview
18.1.1.5.1. Marketing Strategy
18.1.1.5.2. Product Strategy
18.1.1.5.3. Channel Strategy
18.1.2. Texwrap Packaging Systems LLC
18.1.2.1. Overview
18.1.2.2. Product Portfolio
18.1.2.3. Profitability by Market Segments (Product/Age /Sales Channel/Region)
18.1.2.4. Sales Footprint
18.1.2.5. Strategy Overview
18.1.2.5.1. Marketing Strategy
18.1.2.5.2. Product Strategy
18.1.2.5.3. Channel Strategy
18.1.3. nVenia LLC
18.1.3.1. Overview
18.1.3.2. Product Portfolio
18.1.3.3. Profitability by Market Segments (Product/Age /Sales Channel/Region)
18.1.3.4. Sales Footprint
18.1.3.5. Strategy Overview
18.1.3.5.1. Marketing Strategy
18.1.3.5.2. Product Strategy
18.1.3.5.3. Channel Strategy
18.1.4. Eastey Enterprises Inc.
18.1.4.1. Overview
18.1.4.2. Product Portfolio
18.1.4.3. Profitability by Market Segments (Product/Age /Sales Channel/Region)
18.1.4.4. Sales Footprint
18.1.4.5. Strategy Overview
18.1.4.5.1. Marketing Strategy
18.1.4.5.2. Product Strategy
18.1.4.5.3. Channel Strategy
18.1.5. Standard-Knapp, Inc.
18.1.5.1. Overview
18.1.5.2. Product Portfolio
18.1.5.3. Profitability by Market Segments (Product/Age /Sales Channel/Region)
18.1.5.4. Sales Footprint
18.1.5.5. Strategy Overview
18.1.5.5.1. Marketing Strategy
18.1.5.5.2. Product Strategy
18.1.5.5.3. Channel Strategy
18.1.6. Shrinkwrap Machinery Co. Ltd.
18.1.6.1. Overview
18.1.6.2. Product Portfolio
18.1.6.3. Profitability by Market Segments (Product/Age /Sales Channel/Region)
18.1.6.4. Sales Footprint
18.1.6.5. Strategy Overview
18.1.6.5.1. Marketing Strategy
18.1.6.5.2. Product Strategy
18.1.6.5.3. Channel Strategy
18.1.7. Klikwood Corporation
18.1.7.1. Overview
18.1.7.2. Product Portfolio
18.1.7.3. Profitability by Market Segments (Product/Age /Sales Channel/Region)
18.1.7.4. Sales Footprint
18.1.7.5. Strategy Overview
18.1.7.5.1. Marketing Strategy
18.1.7.5.2. Product Strategy
18.1.7.5.3. Channel Strategy
18.1.8. Sidel Group
18.1.8.1. Overview
18.1.8.2. Product Portfolio
18.1.8.3. Profitability by Market Segments (Product/Age /Sales Channel/Region)
18.1.8.4. Sales Footprint
18.1.8.5. Strategy Overview
18.1.8.5.1. Marketing Strategy
18.1.8.5.2. Product Strategy
18.1.8.5.3. Channel Strategy
18.1.9. Robopac-Aetna Group S.p.A
18.1.9.1. Overview
18.1.9.2. Product Portfolio
18.1.9.3. Profitability by Market Segments (Product/Age /Sales Channel/Region)
18.1.9.4. Sales Footprint
18.1.9.5. Strategy Overview
18.1.9.5.1. Marketing Strategy
18.1.9.5.2. Product Strategy
18.1.9.5.3. Channel Strategy
18.1.10. Clearpack
18.1.10.1. Overview
18.1.10.2. Product Portfolio
18.1.10.3. Profitability by Market Segments (Product/Age /Sales Channel/Region)
18.1.10.4. Sales Footprint
18.1.10.5. Strategy Overview
18.1.10.5.1. Marketing Strategy
18.1.10.5.2. Product Strategy
18.1.10.5.3. Channel Strategy
19. Assumptions & Acronyms Used
20. Research Methodology
Let us know your requirement to get
100% FREE customization
Table 1: Global Shrink Wrapper Market Value (US$ Mn) Forecast by Region, 2015-2032
Table 2: Global Shrink Wrapper Market Volume (Units) Forecast by Region, 2015-2032
Table 3: Global Shrink Wrapper Market Value (US$ Mn) Forecast by Product Type, 2015-2032
Table 4: Global Shrink Wrapper Market Volume (Units) Forecast by Product Type, 2015-2032
Table 5: Global Shrink Wrapper Market Value (US$ Mn) Forecast by Process, 2015-2032
Table 6: Global Shrink Wrapper Market Volume (Units) Forecast by Process, 2015-2032
Table 7: Global Shrink Wrapper Market Value (US$ Mn) Forecast by End Use Industry, 2015-2032
Table 8: Global Shrink Wrapper Market Volume (Units) Forecast by End Use Industry, 2015-2032
Table 9: North America Shrink Wrapper Market Value (US$ Mn) Forecast by Country, 2015-2032
Table 10: North America Shrink Wrapper Market Volume (Units) Forecast by Country, 2015-2032
Table 11: North America Shrink Wrapper Market Value (US$ Mn) Forecast by Product Type, 2015-2032
Table 12: North America Shrink Wrapper Market Volume (Units) Forecast by Product Type, 2015-2032
Table 13: North America Shrink Wrapper Market Value (US$ Mn) Forecast by Process, 2015-2032
Table 14: North America Shrink Wrapper Market Volume (Units) Forecast by Process, 2015-2032
Table 15: North America Shrink Wrapper Market Value (US$ Mn) Forecast by End Use Industry, 2015-2032
Table 16: North America Shrink Wrapper Market Volume (Units) Forecast by End Use Industry, 2015-2032
Table 17: Latin America Shrink Wrapper Market Value (US$ Mn) Forecast by Country, 2015-2032
Table 18: Latin America Shrink Wrapper Market Volume (Units) Forecast by Country, 2015-2032
Table 19: Latin America Shrink Wrapper Market Value (US$ Mn) Forecast by Product Type, 2015-2032
Table 20: Latin America Shrink Wrapper Market Volume (Units) Forecast by Product Type, 2015-2032
Table 21: Latin America Shrink Wrapper Market Value (US$ Mn) Forecast by Process, 2015-2032
Table 22: Latin America Shrink Wrapper Market Volume (Units) Forecast by Process, 2015-2032
Table 23: Latin America Shrink Wrapper Market Value (US$ Mn) Forecast by End Use Industry, 2015-2032
Table 24: Latin America Shrink Wrapper Market Volume (Units) Forecast by End Use Industry, 2015-2032
Table 25: Europe Shrink Wrapper Market Value (US$ Mn) Forecast by Country, 2015-2032
Table 26: Europe Shrink Wrapper Market Volume (Units) Forecast by Country, 2015-2032
Table 27: Europe Shrink Wrapper Market Value (US$ Mn) Forecast by Product Type, 2015-2032
Table 28: Europe Shrink Wrapper Market Volume (Units) Forecast by Product Type, 2015-2032
Table 29: Europe Shrink Wrapper Market Value (US$ Mn) Forecast by Process, 2015-2032
Table 30: Europe Shrink Wrapper Market Volume (Units) Forecast by Process, 2015-2032
Table 31: Europe Shrink Wrapper Market Value (US$ Mn) Forecast by End Use Industry, 2015-2032
Table 32: Europe Shrink Wrapper Market Volume (Units) Forecast by End Use Industry, 2015-2032
Table 33: East Asia Shrink Wrapper Market Value (US$ Mn) Forecast by Country, 2015-2032
Table 34: East Asia Shrink Wrapper Market Volume (Units) Forecast by Country, 2015-2032
Table 35: East Asia Shrink Wrapper Market Value (US$ Mn) Forecast by Product Type, 2015-2032
Table 36: East Asia Shrink Wrapper Market Volume (Units) Forecast by Product Type, 2015-2032
Table 37: East Asia Shrink Wrapper Market Value (US$ Mn) Forecast by Process, 2015-2032
Table 38: East Asia Shrink Wrapper Market Volume (Units) Forecast by Process, 2015-2032
Table 39: East Asia Shrink Wrapper Market Value (US$ Mn) Forecast by End Use Industry, 2015-2032
Table 40: East Asia Shrink Wrapper Market Volume (Units) Forecast by End Use Industry, 2015-2032
Table 41: South Asia Shrink Wrapper Market Value (US$ Mn) Forecast by Country, 2015-2032
Table 42: South Asia Shrink Wrapper Market Volume (Units) Forecast by Country, 2015-2032
Table 43: South Asia Shrink Wrapper Market Value (US$ Mn) Forecast by Product Type, 2015-2032
Table 44: South Asia Shrink Wrapper Market Volume (Units) Forecast by Product Type, 2015-2032
Table 45: South Asia Shrink Wrapper Market Value (US$ Mn) Forecast by Process, 2015-2032
Table 46: South Asia Shrink Wrapper Market Volume (Units) Forecast by Process, 2015-2032
Table 47: South Asia Shrink Wrapper Market Value (US$ Mn) Forecast by End Use Industry, 2015-2032
Table 48: South Asia Shrink Wrapper Market Volume (Units) Forecast by End Use Industry, 2015-2032
Table 49: Oceania Shrink Wrapper Market Value (US$ Mn) Forecast by Country, 2015-2032
Table 50: Oceania Shrink Wrapper Market Volume (Units) Forecast by Country, 2015-2032
Table 51: Oceania Shrink Wrapper Market Value (US$ Mn) Forecast by Product Type, 2015-2032
Table 52: Oceania Shrink Wrapper Market Volume (Units) Forecast by Product Type, 2015-2032
Table 53: Oceania Shrink Wrapper Market Value (US$ Mn) Forecast by Process, 2015-2032
Table 54: Oceania Shrink Wrapper Market Volume (Units) Forecast by Process, 2015-2032
Table 55: Oceania Shrink Wrapper Market Value (US$ Mn) Forecast by End Use Industry, 2015-2032
Table 56: Oceania Shrink Wrapper Market Volume (Units) Forecast by End Use Industry, 2015-2032
Table 57: MEA Shrink Wrapper Market Value (US$ Mn) Forecast by Country, 2015-2032
Table 58: MEA Shrink Wrapper Market Volume (Units) Forecast by Country, 2015-2032
Table 59: MEA Shrink Wrapper Market Value (US$ Mn) Forecast by Product Type, 2015-2032
Table 60: MEA Shrink Wrapper Market Volume (Units) Forecast by Product Type, 2015-2032
Table 61: MEA Shrink Wrapper Market Value (US$ Mn) Forecast by Process, 2015-2032
Table 62: MEA Shrink Wrapper Market Volume (Units) Forecast by Process, 2015-2032
Table 63: MEA Shrink Wrapper Market Value (US$ Mn) Forecast by End Use Industry, 2015-2032
Table 64: MEA Shrink Wrapper Market Volume (Units) Forecast by End Use Industry, 2015-2032
Find your sweet spots for generating winning opportunities in this market.
Talk to AnalystFigure 1: Global Shrink Wrapper Market Value (US$ Mn) by Product Type, 2022-2032
Figure 2: Global Shrink Wrapper Market Value (US$ Mn) by Process, 2022-2032
Figure 3: Global Shrink Wrapper Market Value (US$ Mn) by End Use Industry, 2022-2032
Figure 4: Global Shrink Wrapper Market Value (US$ Mn) by Region, 2022-2032
Figure 5: Global Shrink Wrapper Market Value (US$ Mn) Analysis by Region, 2015-2032
Figure 6: Global Shrink Wrapper Market Volume (Units) Analysis by Region, 2015-2032
Figure 7: Global Shrink Wrapper Market Value Share (%) and BPS Analysis by Region, 2022-2032
Figure 8: Global Shrink Wrapper Market Y-o-Y Growth (%) Projections by Region, 2022-2032
Figure 9: Global Shrink Wrapper Market Value (US$ Mn) Analysis by Product Type, 2015-2032
Figure 10: Global Shrink Wrapper Market Volume (Units) Analysis by Product Type, 2015-2032
Figure 11: Global Shrink Wrapper Market Value Share (%) and BPS Analysis by Product Type, 2022-2032
Figure 12: Global Shrink Wrapper Market Y-o-Y Growth (%) Projections by Product Type, 2022-2032
Figure 13: Global Shrink Wrapper Market Value (US$ Mn) Analysis by Process, 2015-2032
Figure 14: Global Shrink Wrapper Market Volume (Units) Analysis by Process, 2015-2032
Figure 15: Global Shrink Wrapper Market Value Share (%) and BPS Analysis by Process, 2022-2032
Figure 16: Global Shrink Wrapper Market Y-o-Y Growth (%) Projections by Process, 2022-2032
Figure 17: Global Shrink Wrapper Market Value (US$ Mn) Analysis by End Use Industry, 2015-2032
Figure 18: Global Shrink Wrapper Market Volume (Units) Analysis by End Use Industry, 2015-2032
Figure 19: Global Shrink Wrapper Market Value Share (%) and BPS Analysis by End Use Industry, 2022-2032
Figure 20: Global Shrink Wrapper Market Y-o-Y Growth (%) Projections by End Use Industry, 2022-2032
Figure 21: Global Shrink Wrapper Market Attractiveness by Product Type, 2022-2032
Figure 22: Global Shrink Wrapper Market Attractiveness by Process, 2022-2032
Figure 23: Global Shrink Wrapper Market Attractiveness by End Use Industry, 2022-2032
Figure 24: Global Shrink Wrapper Market Attractiveness by Region, 2022-2032
Figure 25: North America Shrink Wrapper Market Value (US$ Mn) by Product Type, 2022-2032
Figure 26: North America Shrink Wrapper Market Value (US$ Mn) by Process, 2022-2032
Figure 27: North America Shrink Wrapper Market Value (US$ Mn) by End Use Industry, 2022-2032
Figure 28: North America Shrink Wrapper Market Value (US$ Mn) by Country, 2022-2032
Figure 29: North America Shrink Wrapper Market Value (US$ Mn) Analysis by Country, 2015-2032
Figure 30: North America Shrink Wrapper Market Volume (Units) Analysis by Country, 2015-2032
Figure 31: North America Shrink Wrapper Market Value Share (%) and BPS Analysis by Country, 2022-2032
Figure 32: North America Shrink Wrapper Market Y-o-Y Growth (%) Projections by Country, 2022-2032
Figure 33: North America Shrink Wrapper Market Value (US$ Mn) Analysis by Product Type, 2015-2032
Figure 34: North America Shrink Wrapper Market Volume (Units) Analysis by Product Type, 2015-2032
Figure 35: North America Shrink Wrapper Market Value Share (%) and BPS Analysis by Product Type, 2022-2032
Figure 36: North America Shrink Wrapper Market Y-o-Y Growth (%) Projections by Product Type, 2022-2032
Figure 37: North America Shrink Wrapper Market Value (US$ Mn) Analysis by Process, 2015-2032
Figure 38: North America Shrink Wrapper Market Volume (Units) Analysis by Process, 2015-2032
Figure 39: North America Shrink Wrapper Market Value Share (%) and BPS Analysis by Process, 2022-2032
Figure 40: North America Shrink Wrapper Market Y-o-Y Growth (%) Projections by Process, 2022-2032
Figure 41: North America Shrink Wrapper Market Value (US$ Mn) Analysis by End Use Industry, 2015-2032
Figure 42: North America Shrink Wrapper Market Volume (Units) Analysis by End Use Industry, 2015-2032
Figure 43: North America Shrink Wrapper Market Value Share (%) and BPS Analysis by End Use Industry, 2022-2032
Figure 44: North America Shrink Wrapper Market Y-o-Y Growth (%) Projections by End Use Industry, 2022-2032
Figure 45: North America Shrink Wrapper Market Attractiveness by Product Type, 2022-2032
Figure 46: North America Shrink Wrapper Market Attractiveness by Process, 2022-2032
Figure 47: North America Shrink Wrapper Market Attractiveness by End Use Industry, 2022-2032
Figure 48: North America Shrink Wrapper Market Attractiveness by Country, 2022-2032
Figure 49: Latin America Shrink Wrapper Market Value (US$ Mn) by Product Type, 2022-2032
Figure 50: Latin America Shrink Wrapper Market Value (US$ Mn) by Process, 2022-2032
Figure 51: Latin America Shrink Wrapper Market Value (US$ Mn) by End Use Industry, 2022-2032
Figure 52: Latin America Shrink Wrapper Market Value (US$ Mn) by Country, 2022-2032
Figure 53: Latin America Shrink Wrapper Market Value (US$ Mn) Analysis by Country, 2015-2032
Figure 54: Latin America Shrink Wrapper Market Volume (Units) Analysis by Country, 2015-2032
Figure 55: Latin America Shrink Wrapper Market Value Share (%) and BPS Analysis by Country, 2022-2032
Figure 56: Latin America Shrink Wrapper Market Y-o-Y Growth (%) Projections by Country, 2022-2032
Figure 57: Latin America Shrink Wrapper Market Value (US$ Mn) Analysis by Product Type, 2015-2032
Figure 58: Latin America Shrink Wrapper Market Volume (Units) Analysis by Product Type, 2015-2032
Figure 59: Latin America Shrink Wrapper Market Value Share (%) and BPS Analysis by Product Type, 2022-2032
Figure 60: Latin America Shrink Wrapper Market Y-o-Y Growth (%) Projections by Product Type, 2022-2032
Figure 61: Latin America Shrink Wrapper Market Value (US$ Mn) Analysis by Process, 2015-2032
Figure 62: Latin America Shrink Wrapper Market Volume (Units) Analysis by Process, 2015-2032
Figure 63: Latin America Shrink Wrapper Market Value Share (%) and BPS Analysis by Process, 2022-2032
Figure 64: Latin America Shrink Wrapper Market Y-o-Y Growth (%) Projections by Process, 2022-2032
Figure 65: Latin America Shrink Wrapper Market Value (US$ Mn) Analysis by End Use Industry, 2015-2032
Figure 66: Latin America Shrink Wrapper Market Volume (Units) Analysis by End Use Industry, 2015-2032
Figure 67: Latin America Shrink Wrapper Market Value Share (%) and BPS Analysis by End Use Industry, 2022-2032
Figure 68: Latin America Shrink Wrapper Market Y-o-Y Growth (%) Projections by End Use Industry, 2022-2032
Figure 69: Latin America Shrink Wrapper Market Attractiveness by Product Type, 2022-2032
Figure 70: Latin America Shrink Wrapper Market Attractiveness by Process, 2022-2032
Figure 71: Latin America Shrink Wrapper Market Attractiveness by End Use Industry, 2022-2032
Figure 72: Latin America Shrink Wrapper Market Attractiveness by Country, 2022-2032
Figure 73: Europe Shrink Wrapper Market Value (US$ Mn) by Product Type, 2022-2032
Figure 74: Europe Shrink Wrapper Market Value (US$ Mn) by Process, 2022-2032
Figure 75: Europe Shrink Wrapper Market Value (US$ Mn) by End Use Industry, 2022-2032
Figure 76: Europe Shrink Wrapper Market Value (US$ Mn) by Country, 2022-2032
Figure 77: Europe Shrink Wrapper Market Value (US$ Mn) Analysis by Country, 2015-2032
Figure 78: Europe Shrink Wrapper Market Volume (Units) Analysis by Country, 2015-2032
Figure 79: Europe Shrink Wrapper Market Value Share (%) and BPS Analysis by Country, 2022-2032
Figure 80: Europe Shrink Wrapper Market Y-o-Y Growth (%) Projections by Country, 2022-2032
Figure 81: Europe Shrink Wrapper Market Value (US$ Mn) Analysis by Product Type, 2015-2032
Figure 82: Europe Shrink Wrapper Market Volume (Units) Analysis by Product Type, 2015-2032
Figure 83: Europe Shrink Wrapper Market Value Share (%) and BPS Analysis by Product Type, 2022-2032
Figure 84: Europe Shrink Wrapper Market Y-o-Y Growth (%) Projections by Product Type, 2022-2032
Figure 85: Europe Shrink Wrapper Market Value (US$ Mn) Analysis by Process, 2015-2032
Figure 86: Europe Shrink Wrapper Market Volume (Units) Analysis by Process, 2015-2032
Figure 87: Europe Shrink Wrapper Market Value Share (%) and BPS Analysis by Process, 2022-2032
Figure 88: Europe Shrink Wrapper Market Y-o-Y Growth (%) Projections by Process, 2022-2032
Figure 89: Europe Shrink Wrapper Market Value (US$ Mn) Analysis by End Use Industry, 2015-2032
Figure 90: Europe Shrink Wrapper Market Volume (Units) Analysis by End Use Industry, 2015-2032
Figure 91: Europe Shrink Wrapper Market Value Share (%) and BPS Analysis by End Use Industry, 2022-2032
Figure 92: Europe Shrink Wrapper Market Y-o-Y Growth (%) Projections by End Use Industry, 2022-2032
Figure 93: Europe Shrink Wrapper Market Attractiveness by Product Type, 2022-2032
Figure 94: Europe Shrink Wrapper Market Attractiveness by Process, 2022-2032
Figure 95: Europe Shrink Wrapper Market Attractiveness by End Use Industry, 2022-2032
Figure 96: Europe Shrink Wrapper Market Attractiveness by Country, 2022-2032
Figure 97: East Asia Shrink Wrapper Market Value (US$ Mn) by Product Type, 2022-2032
Figure 98: East Asia Shrink Wrapper Market Value (US$ Mn) by Process, 2022-2032
Figure 99: East Asia Shrink Wrapper Market Value (US$ Mn) by End Use Industry, 2022-2032
Figure 100: East Asia Shrink Wrapper Market Value (US$ Mn) by Country, 2022-2032
Figure 101: East Asia Shrink Wrapper Market Value (US$ Mn) Analysis by Country, 2015-2032
Figure 102: East Asia Shrink Wrapper Market Volume (Units) Analysis by Country, 2015-2032
Figure 103: East Asia Shrink Wrapper Market Value Share (%) and BPS Analysis by Country, 2022-2032
Figure 104: East Asia Shrink Wrapper Market Y-o-Y Growth (%) Projections by Country, 2022-2032
Figure 105: East Asia Shrink Wrapper Market Value (US$ Mn) Analysis by Product Type, 2015-2032
Figure 106: East Asia Shrink Wrapper Market Volume (Units) Analysis by Product Type, 2015-2032
Figure 107: East Asia Shrink Wrapper Market Value Share (%) and BPS Analysis by Product Type, 2022-2032
Figure 108: East Asia Shrink Wrapper Market Y-o-Y Growth (%) Projections by Product Type, 2022-2032
Figure 109: East Asia Shrink Wrapper Market Value (US$ Mn) Analysis by Process, 2015-2032
Figure 110: East Asia Shrink Wrapper Market Volume (Units) Analysis by Process, 2015-2032
Figure 111: East Asia Shrink Wrapper Market Value Share (%) and BPS Analysis by Process, 2022-2032
Figure 112: East Asia Shrink Wrapper Market Y-o-Y Growth (%) Projections by Process, 2022-2032
Figure 113: East Asia Shrink Wrapper Market Value (US$ Mn) Analysis by End Use Industry, 2015-2032
Figure 114: East Asia Shrink Wrapper Market Volume (Units) Analysis by End Use Industry, 2015-2032
Figure 115: East Asia Shrink Wrapper Market Value Share (%) and BPS Analysis by End Use Industry, 2022-2032
Figure 116: East Asia Shrink Wrapper Market Y-o-Y Growth (%) Projections by End Use Industry, 2022-2032
Figure 117: East Asia Shrink Wrapper Market Attractiveness by Product Type, 2022-2032
Figure 118: East Asia Shrink Wrapper Market Attractiveness by Process, 2022-2032
Figure 119: East Asia Shrink Wrapper Market Attractiveness by End Use Industry, 2022-2032
Figure 120: East Asia Shrink Wrapper Market Attractiveness by Country, 2022-2032
Figure 121: South Asia Shrink Wrapper Market Value (US$ Mn) by Product Type, 2022-2032
Figure 122: South Asia Shrink Wrapper Market Value (US$ Mn) by Process, 2022-2032
Figure 123: South Asia Shrink Wrapper Market Value (US$ Mn) by End Use Industry, 2022-2032
Figure 124: South Asia Shrink Wrapper Market Value (US$ Mn) by Country, 2022-2032
Figure 125: South Asia Shrink Wrapper Market Value (US$ Mn) Analysis by Country, 2015-2032
Figure 126: South Asia Shrink Wrapper Market Volume (Units) Analysis by Country, 2015-2032
Figure 127: South Asia Shrink Wrapper Market Value Share (%) and BPS Analysis by Country, 2022-2032
Figure 128: South Asia Shrink Wrapper Market Y-o-Y Growth (%) Projections by Country, 2022-2032
Figure 129: South Asia Shrink Wrapper Market Value (US$ Mn) Analysis by Product Type, 2015-2032
Figure 130: South Asia Shrink Wrapper Market Volume (Units) Analysis by Product Type, 2015-2032
Figure 131: South Asia Shrink Wrapper Market Value Share (%) and BPS Analysis by Product Type, 2022-2032
Figure 132: South Asia Shrink Wrapper Market Y-o-Y Growth (%) Projections by Product Type, 2022-2032
Figure 133: South Asia Shrink Wrapper Market Value (US$ Mn) Analysis by Process, 2015-2032
Figure 134: South Asia Shrink Wrapper Market Volume (Units) Analysis by Process, 2015-2032
Figure 135: South Asia Shrink Wrapper Market Value Share (%) and BPS Analysis by Process, 2022-2032
Figure 136: South Asia Shrink Wrapper Market Y-o-Y Growth (%) Projections by Process, 2022-2032
Figure 137: South Asia Shrink Wrapper Market Value (US$ Mn) Analysis by End Use Industry, 2015-2032
Figure 138: South Asia Shrink Wrapper Market Volume (Units) Analysis by End Use Industry, 2015-2032
Figure 139: South Asia Shrink Wrapper Market Value Share (%) and BPS Analysis by End Use Industry, 2022-2032
Figure 140: South Asia Shrink Wrapper Market Y-o-Y Growth (%) Projections by End Use Industry, 2022-2032
Figure 141: South Asia Shrink Wrapper Market Attractiveness by Product Type, 2022-2032
Figure 142: South Asia Shrink Wrapper Market Attractiveness by Process, 2022-2032
Figure 143: South Asia Shrink Wrapper Market Attractiveness by End Use Industry, 2022-2032
Figure 144: South Asia Shrink Wrapper Market Attractiveness by Country, 2022-2032
Figure 145: Oceania Shrink Wrapper Market Value (US$ Mn) by Product Type, 2022-2032
Figure 146: Oceania Shrink Wrapper Market Value (US$ Mn) by Process, 2022-2032
Figure 147: Oceania Shrink Wrapper Market Value (US$ Mn) by End Use Industry, 2022-2032
Figure 148: Oceania Shrink Wrapper Market Value (US$ Mn) by Country, 2022-2032
Figure 149: Oceania Shrink Wrapper Market Value (US$ Mn) Analysis by Country, 2015-2032
Figure 150: Oceania Shrink Wrapper Market Volume (Units) Analysis by Country, 2015-2032
Figure 151: Oceania Shrink Wrapper Market Value Share (%) and BPS Analysis by Country, 2022-2032
Figure 152: Oceania Shrink Wrapper Market Y-o-Y Growth (%) Projections by Country, 2022-2032
Figure 153: Oceania Shrink Wrapper Market Value (US$ Mn) Analysis by Product Type, 2015-2032
Figure 154: Oceania Shrink Wrapper Market Volume (Units) Analysis by Product Type, 2015-2032
Figure 155: Oceania Shrink Wrapper Market Value Share (%) and BPS Analysis by Product Type, 2022-2032
Figure 156: Oceania Shrink Wrapper Market Y-o-Y Growth (%) Projections by Product Type, 2022-2032
Figure 157: Oceania Shrink Wrapper Market Value (US$ Mn) Analysis by Process, 2015-2032
Figure 158: Oceania Shrink Wrapper Market Volume (Units) Analysis by Process, 2015-2032
Figure 159: Oceania Shrink Wrapper Market Value Share (%) and BPS Analysis by Process, 2022-2032
Figure 160: Oceania Shrink Wrapper Market Y-o-Y Growth (%) Projections by Process, 2022-2032
Figure 161: Oceania Shrink Wrapper Market Value (US$ Mn) Analysis by End Use Industry, 2015-2032
Figure 162: Oceania Shrink Wrapper Market Volume (Units) Analysis by End Use Industry, 2015-2032
Figure 163: Oceania Shrink Wrapper Market Value Share (%) and BPS Analysis by End Use Industry, 2022-2032
Figure 164: Oceania Shrink Wrapper Market Y-o-Y Growth (%) Projections by End Use Industry, 2022-2032
Figure 165: Oceania Shrink Wrapper Market Attractiveness by Product Type, 2022-2032
Figure 166: Oceania Shrink Wrapper Market Attractiveness by Process, 2022-2032
Figure 167: Oceania Shrink Wrapper Market Attractiveness by End Use Industry, 2022-2032
Figure 168: Oceania Shrink Wrapper Market Attractiveness by Country, 2022-2032
Figure 169: MEA Shrink Wrapper Market Value (US$ Mn) by Product Type, 2022-2032
Figure 170: MEA Shrink Wrapper Market Value (US$ Mn) by Process, 2022-2032
Figure 171: MEA Shrink Wrapper Market Value (US$ Mn) by End Use Industry, 2022-2032
Figure 172: MEA Shrink Wrapper Market Value (US$ Mn) by Country, 2022-2032
Figure 173: MEA Shrink Wrapper Market Value (US$ Mn) Analysis by Country, 2015-2032
Figure 174: MEA Shrink Wrapper Market Volume (Units) Analysis by Country, 2015-2032
Figure 175: MEA Shrink Wrapper Market Value Share (%) and BPS Analysis by Country, 2022-2032
Figure 176: MEA Shrink Wrapper Market Y-o-Y Growth (%) Projections by Country, 2022-2032
Figure 177: MEA Shrink Wrapper Market Value (US$ Mn) Analysis by Product Type, 2015-2032
Figure 178: MEA Shrink Wrapper Market Volume (Units) Analysis by Product Type, 2015-2032
Figure 179: MEA Shrink Wrapper Market Value Share (%) and BPS Analysis by Product Type, 2022-2032
Figure 180: MEA Shrink Wrapper Market Y-o-Y Growth (%) Projections by Product Type, 2022-2032
Figure 181: MEA Shrink Wrapper Market Value (US$ Mn) Analysis by Process, 2015-2032
Figure 182: MEA Shrink Wrapper Market Volume (Units) Analysis by Process, 2015-2032
Figure 183: MEA Shrink Wrapper Market Value Share (%) and BPS Analysis by Process, 2022-2032
Figure 184: MEA Shrink Wrapper Market Y-o-Y Growth (%) Projections by Process, 2022-2032
Figure 185: MEA Shrink Wrapper Market Value (US$ Mn) Analysis by End Use Industry, 2015-2032
Figure 186: MEA Shrink Wrapper Market Volume (Units) Analysis by End Use Industry, 2015-2032
Figure 187: MEA Shrink Wrapper Market Value Share (%) and BPS Analysis by End Use Industry, 2022-2032
Figure 188: MEA Shrink Wrapper Market Y-o-Y Growth (%) Projections by End Use Industry, 2022-2032
Figure 189: MEA Shrink Wrapper Market Attractiveness by Product Type, 2022-2032
Figure 190: MEA Shrink Wrapper Market Attractiveness by Process, 2022-2032
Figure 191: MEA Shrink Wrapper Market Attractiveness by End Use Industry, 2022-2032
Figure 192: MEA Shrink Wrapper Market Attractiveness by Country, 2022-2032
Need specific information?
Request CustomizationExplore Packaging Insights
View Reports