Reports

- Global Locations -

Headquarters

Future Market Insights, Inc.

Christiana Corporate, 200
Continental Drive, Suite 401,
Newark, Delaware - 19713,
United States

T: +1-845-579-5705

Americas

Future Market Insights, Inc.

616 Corporate Way, Suite 2-9018,
Valley Cottage, NY 10989, United States

T: +1-347-918-3531

MEA

Future Market Insights

1602-6 Jumeirah Bay X2 Tower, Plot No: JLT-PH2-X2A,
Jumeirah Lakes Towers, Dubai,
United Arab Emirates

Europe

Future Market Insights

3rd Floor, 207 Regent Street,
W1B 3HH London
United Kingdom

T: + 44 (0) 20 8123 9659
D: +44 (0) 20 3287 4268

Asia Pacific

Future Market Insights

IndiaLand Global Tech Park, Unit UG-1, Behind Grand HighStreet, Phase 1, Hinjawadi, MH, Pune – 411057, India

South Korea Intellectual Property Market Outlook (2023 to 2033)

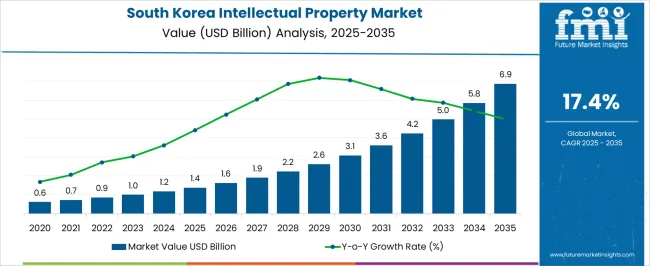
The South Korea intellectual property market is capturing a valuation of US$ 1 billion in 2023 and is predicted to reach US$ 5.2 billion by 2033. The market is registering a CAGR of 17.4% during the forecast period.

The South Korea intellectual property (IP) market is anticipated to gain from the rising adoption of cloud-based IP solutions and the growing demand for IP management software. South Korea holds the 5th position across the globe in terms of patent registrations. South Korea Intellectual Property market accounts for nearly 12% of the global IP management market share.

There has been an uptick in demand for IP search analysis and intellectual property management software in South Korea. Surging patents in ICT are increasing as they provide a competitive advantage, proving to be strategic assets for the company.

With digital advancements and the introduction of new technologies, the possibility of producing and disseminating copies has also increased. It has resulted in growing cases of copyright violations, demanding the need for IPs. Driven by this, many companies are adopting patent management software solutions.

The government of South Korea initiated various policies and plans to enhance the performance of Intellectual Property in the nation. They are establishing institutes, including Korea Intellectual Property Office, to strengthen IP rights. The government plays a crucial role in maintaining a favorable environment for intellectual property transactions.

The increasing legal frameworks and growing awareness to protect intellectual property rights. Moreover, huge investments and international intellectual property fuel the South Korean market.

Don't pay for what you don't need

Customize your report by selecting specific countries or regions and save 30%!

How is Growing Digital Transformation Boosting Sales in the South Korea Market?

Intellectual property rights allow creators to patent, trademark, or copyright their works to avoid mishandling and to benefit from their creation and innovation. Cloud-based IPs are in high demand as they support and remotely protect IP assets across various industries. Since the cloud offers excellent flexibility and value over locally installed intellectual property management systems. These sales are anticipated to increase in the forthcoming years.

Designers, inventors, authors, and developers are adopting IP rights such as patents and trademarks to safeguard their creations. In addition, regulations imposed by the government to control the unauthorized usage of IP assets are estimated to augment the growth in the market.

Local Government Initiatives Likely to Create Strong Opportunities for Growth

The local government plays a critical role in policy-making and regulations in South Korea. In recent years, the Korea Intellectual Property Office (KIPO) has expanded the role of the Special Investigation Police (SIP) within KIPO. It was originally established to investigate trademark infringement and counterfeiting including investigations of patent infringement and the enforcement of patent rights.

The government of South Korea is planning to evolve in tandem with the changing landscape of the intellectual property sector. Moreover, investments in research and development by the government and various firms are propelling several patents to be issued, boosting sales in the market.

Attributes Details
Market CAGR (2023 to 2033) 17.4%
Market Valuation (2023) US$ 1 billion
Market Valuation (2033) US$ 5.2 billion
Sudip Saha
Sudip Saha

Principal Consultant

Talk to Analyst

Find your sweet spots for generating winning opportunities in this market.

South Korea Intellectual Property Market, 2018 to 2022 Historical Sales, Compared to 2023 to 2033 Future Outlook

Sales are projected to increase at a 17.4% CAGR between 2023 and 2033, compared with the 7.8% CAGR registered from 2018 to 2022. Companies in South Korea are implementing new editions of IP solutions into their current offerings with a wide range of new features and capabilities.

Rapid globalization, innovation, fragmentation of production value chains, and the emergence of new players are some factors expected to drive sales of IP solutions and software. IP systems are undergoing continuous changes as they seek to optimize the balance between private and social benefits to contribute to economic growth and the welfare of societies.

The market was valued at US$ 621.0 million in 2018 and is anticipated to capture a valuation of US$ 906.9 million in 2022.

Comparative Analysis of Adjacent Markets

South Korea Intellectual Property Market:

Attributes South Korea Intellectual Property Market
CAGR (2023 to 2033) 17.4%
Value (2023) US$ 1 billion
Value (2033) US$ 5.2 billion
Trends Growing legal frameworks, increase awareness and enforcement, and growing research and development activities.
Opportunities Rising government initiatives to promote the secure intellectual property, collaborations, and rising technological advancements.

Intellectual Property Market:

Attributes Intellectual Property Market
CAGR (2023 to 2033) 12.7%
Value (2023) US$ 5.7 billion
Value (2033) US$ 16.76 billion
Trends Increasing demand for security, rising artificial intelligence technology, and paperless work reduce data storage costs.
Opportunities Developing new products, rising research and development activities, government initiatives, and supporting algorithms in intellectual property.

Software Asset Market:

Attributes Software Asset Market
CAGR (2023 to 2033) 18.1%
Value (2023) US$ 2.91 billion
Value (2033) US$ 15.38 billion
Trends Increasing demand for scalability, flexibility, and popularity of cloud-based software
Opportunities Rising end-use industries, advanced technologies, huge investments, optimize information technology assets, and improve management

Get the data you need at a Fraction of the cost

Personalize your report by choosing insights you need
and save 40%!

Top Segments in the Global Market are

Why is the Demand for Intellectual Property (IP) Management Software Increasing?

Brands and Companies are Investing in Logo Copyright Registration

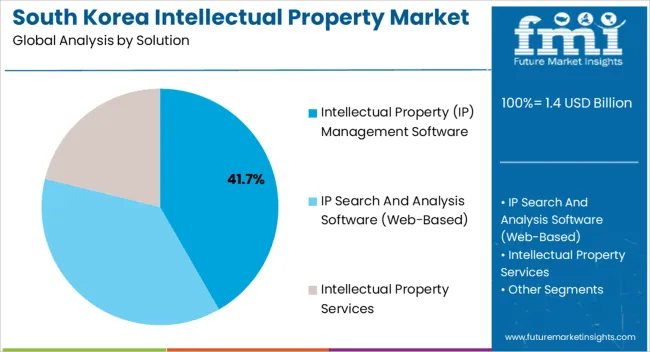
Based on solutions, demand in the intellectual property management software segment is expected to secure a share of 47.7%, accounting for a dominant market share.

Formal intangible assets such as technology, designs, and brands are important for appropriate returns for innovation and investments. These intangible assets are protected by formal intellectual property (IP) rights such as patents, utility models, industrial designs, trademarks, copyrights, and trade secrets. Owing to this, demand for IP management software across various end users is surging, thereby driving market growth.

Why are Sales of Intellectual Property in Law Firms Rising?

Surging Demand for Copyright Services in Law Firms is estimated to Drive Sales

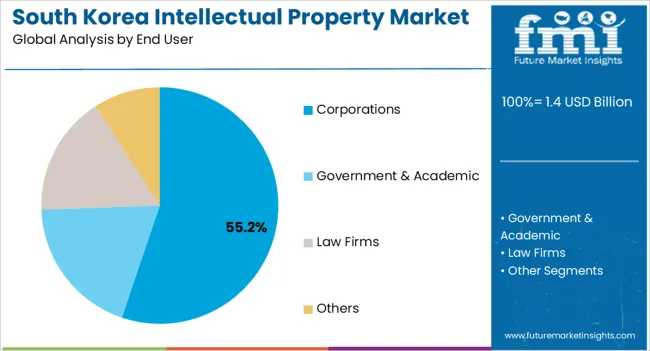
Regarding end users, sales in the law firms segment are projected to secure a share of 28.3% over the forecast period. The segment is expected to grow 5.9X, creating an absolute opportunity of US$ 2,061.2 million.

The growing popularity of IP management software is estimated to continue driving sales in this segment. For instance, in July 2021, Clarivate launched research and protection solutions powered by CompuMark into Ipfolio, and FoundationIP, IP management software (IPMS) solutions. These solutions are being adopted in corporations and law firms. Such developments are anticipated to bode well for the growth of the market.

How South Korea is Performing in the Intellectual Property Market

South Korea is one of the significant countries leading the intellectual property field to innovate and protect. South Korea's government takes several measures to strengthen the laws and enforcement for businesses and inventors.

The country ranks high internationally for IP indices, including the United States Chamber of Commerce's Global IP Index and the Global Innovation Index. The growing technological and electronics in IP enforcing rights and laws are fueling the market in the country. South Korea is enhancing its portfolio in licensing agreements with numerous IP disputes.

The growing awareness, promotion, and education of intellectual property drive the South Korea market. Increasing research and development activities, supporting small businesses, startups, and collaborations with research institutions are expanding the market in the country. These factors are performing in the South Korea intellectual property market during the forecast period.

How can Manufacturers Expand the South Korea Intellectual Property Market?

Manufacturers can expand the South Korea market through various steps as follows:

  • Conduct Market Research: The growing industrial trends, legal framework, security, and several key players drive the South Korea market.
  • Protect Your Intellectual Property: Manufacturers can expand the market in South Korea by ensuring their consumer's Intellectual property protection. It involves copyrights, patents, and trademarks with South Korean authorities.
  • Partnerships: Manufacturers seek to collaborate with local distributors, agents, and key companies to expand their business portfolio in the country. These manufacturers are helping to navigate, provide valuable insights and regulate challenges in the market.
  • Offer Customization: Manufacturers provide various products to their customers as per their specific needs and requirements. They are expanding their market by enhancing users' experiences, product packaging, and quality.
  • Collaborating with Research Institutions: Manufacturers are innovating new technology products by collaborating with research institutions. These manufacturers can expand the market through technology transfer and reach local talent.

These are a few of the steps on which manufacturers can expand the South Korea market during the forecast period.
Trends in the South Korea Intellectual Property Market are

  • Increasing Intellectual Property Filling: South Korea is a significantly growing market with steady growth in IP fillings, including trademarks and patents. This trend builds innovations and protects IP rights in the country.
  • Focus on Technology: South Korea highly invests in innovations and technologies to upsurge the market. Several end-use industries, such as information technology, electronics, and telecommunications, influence the South Korea market.
  • International Reach: South Korea is expanding the market by increasing international intellectual property fillings. This trend secures competitive advantages and protects intellectual property.
  • Strengthening Intellectual Property Protection: South Korea implements various regulations to protect intellectual property. Such as strict regulations, increased penalties, and enhanced patent examination process.

Competitive Landscape

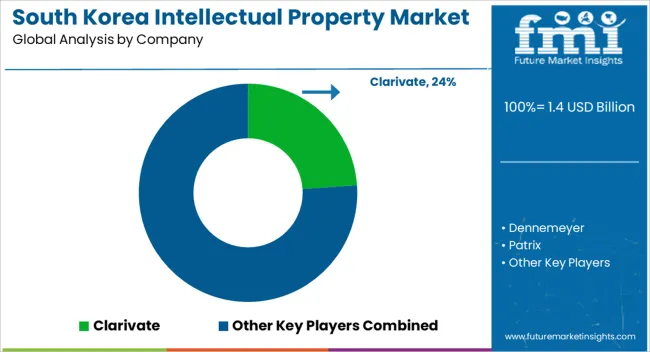
Key companies operating in the South Korea intellectual property market include Clarivate, Dennemeyer, Patrix, LexisNexis Korea (Legal), Questel Korea, PI IP LAW, KASAN, SU INTELLECTUAL PROPERTY Co. Ltd., WIPS Co. Ltd, SIWONIP, Kim & Chang, Lee & Ko, and FirstLaw PC, among others. Companies are emphasizing innovations and expanding their global footprint through acquisitions and partnerships.

The market is highly competitive by these key players. These key players are innovating better and unique products to stay ahead of the competition. The key players are adopting several marketing tactics to upsurge the global market to another level.

Other Essential Players in the South Korea Intellectual Property Market are

  • Clarivate
  • Dennemeyer
  • Patrix
  • LexisNexis Korea (Legal)
  • Questel Korea
  • PI IP LAW
  • KASAN
  • SU INTELLECTUAL PROPERTY Co. Ltd.
  • WIPS Co. Ltd
  • SIWONIP
  • Kim & Chang
  • Lee & Ko
  • FirstLaw PC

Recent Developments in the South Korea Intellectual Property Market are:

  • In November 2020, Patrix announced a partnership with Black Hills. This partnership provides customers with tools that help to automate IP operations. It also provides prosecution and patent analytics on their portfolios.
  • In January 2018, Dennemeyer & Associates opened an IP law firm in Paris. This expansion was set up in collaboration with Frédéric Blanc and offered cutting-edge intellectual property-related legal services.
  • In 2019, Dennemeyer Group announced its completion of the acquisition with De Simone & Partners. This acquisition took place to expand the business portfolio in Italy.
  • Anaqua announced its newly launched product by investing in the platforms of PATTSY WAVE and AQX Law Firm.

Scope of Report

Attribute Details
Forecast Period 2023 to 2033
Historical Data Available for 2018 to 2022
Market Analysis US$ billion for Value
Key Countries Covered United States, United Kingdom, Japan, India, China, Australia, Germany
Key Segments Covered
  • Solution
  • End User
  • Region
Key Companies Profiled
  • Clarivate
  • Dennemeyer
  • Patrix
  • LexisNexis Korea (Legal)
  • Questel Korea
  • PI IP LAW
  • KASAN
  • SU INTELLECTUAL PROPERTY Co. Ltd.
  • WIPS Co. Ltd
  • SIWONIP
  • Kim & Chang
  • Lee & Ko
  • FirstLaw PC
Report Coverage Market Forecast, Company Share Analysis, Competition Intelligence, DROT Analysis, Market Dynamics and Challenges, and Strategic Growth Initiatives
Customization & Pricing Available upon Request

South Korea Intellectual Property Market by Category

By Solution:

  • Intellectual Property (IP) Management Software
    • Cloud-based
    • On-Premises
  • IP Search and Analysis Software (Web-based)
  • Intellectual Property Services
    • IP Consulting and Analytics
    • Law Firm Services
    • IP Maintenance
    • Others

By End User:

  • Corporations
  • Government & Academic
  • Law Firms
  • Others

By Region:

  • North America
  • Europe
  • Latin America
  • Asia Pacific
  • The Middle East and Africa

Frequently Asked Questions

How was the Historical Performance of the Market?

The market registered 7.8% of CAGR from 2018 to 2022.

What is the Growth Potential of the South Korea Intellectual Property Market?

The growth potential of the market is 4% through 2033.

What Limits the Growth Potential of the Market?

High cost of adoption and lack of awareness are likely to limit market growth.

What is North America's expected share in 2023?

North America is likely to generate 25% revenue in 2023.

What Opportunities Await for the Market Players?

Substantial investment in research and development.

Table of Content

1. Executive Summary

    1.1. Global Market Outlook

    1.2. Demand-side Trends

    1.3. Supply-side Trends

    1.4. Technology Roadmap Analysis

    1.5. Analysis and Recommendations

2. Market Overview

    2.1. Market Coverage / Taxonomy

    2.2. Market Definition / Scope / Limitations

3. Market Background

    3.1. Market Dynamics

        3.1.1. Drivers

        3.1.2. Restraints

        3.1.3. Opportunity

        3.1.4. Trends

    3.2. Scenario Forecast

        3.2.1. Demand in Optimistic Scenario

        3.2.2. Demand in Likely Scenario

        3.2.3. Demand in Conservative Scenario

    3.3. Opportunity Map Analysis

    3.4. Investment Feasibility Matrix

    3.5. PESTLE and Porter’s Analysis

    3.6. Regulatory Landscape

        3.6.1. By Key Regions

        3.6.2. By Key Countries

    3.7. Regional Parent Market Outlook

4. Global Market Analysis 2018 to 2022 and Forecast, 2023 to 2033

    4.1. Historical Market Size Value (US$ Million) Analysis, 2018 to 2022

    4.2. Current and Future Market Size Value (US$ Million) Projections, 2023 to 2033

        4.2.1. Y-o-Y Growth Trend Analysis

        4.2.2. Absolute $ Opportunity Analysis

5. Global Market Analysis 2018 to 2022 and Forecast 2023 to 2033, By Solution

    5.1. Introduction / Key Findings

    5.2. Historical Market Size Value (US$ Million) Analysis By Solution, 2018 to 2022

    5.3. Current and Future Market Size Value (US$ Million) Analysis and Forecast By Solution, 2023 to 2033

        5.3.1. Intellectual Property (IP) Management Software

            5.3.1.1. Cloud-based

            5.3.1.2. On-Premises

        5.3.2. IP Search and Analysis Software (Web-based)

        5.3.3. Intellectual Property Services

            5.3.3.1. IP Consulting and Analytics

            5.3.3.2. Law Firm Services

            5.3.3.3. IP Maintenance

            5.3.3.4. Others

    5.4. Y-o-Y Growth Trend Analysis By Solution, 2018 to 2022

    5.5. Absolute $ Opportunity Analysis By Solution, 2023 to 2033

6. Global Market Analysis 2018 to 2022 and Forecast 2023 to 2033, By End-user

    6.1. Introduction / Key Findings

    6.2. Historical Market Size Value (US$ Million) Analysis By End-user, 2018 to 2022

    6.3. Current and Future Market Size Value (US$ Million) Analysis and Forecast By End-user, 2023 to 2033

        6.3.1. Corporations

        6.3.2. Government & Academic

        6.3.3. Law Firms

        6.3.4. Others

    6.4. Y-o-Y Growth Trend Analysis By End-user, 2018 to 2022

    6.5. Absolute $ Opportunity Analysis By End-user, 2023 to 2033

7. Global Market Analysis 2018 to 2022 and Forecast 2023 to 2033, By Region

    7.1. Introduction

    7.2. Historical Market Size Value (US$ Million) Analysis By Region, 2018 to 2022

    7.3. Current Market Size Value (US$ Million) Analysis and Forecast By Region, 2023 to 2033

        7.3.1. North America

        7.3.2. Latin America

        7.3.3. Europe

        7.3.4. South Asia

        7.3.5. East Asia

        7.3.6. Oceania

        7.3.7. MEA

    7.4. Market Attractiveness Analysis By Region

8. North America Market Analysis 2018 to 2022 and Forecast 2023 to 2033, By Country

    8.1. Historical Market Size Value (US$ Million) Trend Analysis By Market Taxonomy, 2018 to 2022

    8.2. Market Size Value (US$ Million) Forecast By Market Taxonomy, 2023 to 2033

        8.2.1. By Country

            8.2.1.1. U.S.

            8.2.1.2. Canada

        8.2.2. By Solution

        8.2.3. By End-user

    8.3. Market Attractiveness Analysis

        8.3.1. By Country

        8.3.2. By Solution

        8.3.3. By End-user

    8.4. Key Takeaways

9. Latin America Market Analysis 2018 to 2022 and Forecast 2023 to 2033, By Country

    9.1. Historical Market Size Value (US$ Million) Trend Analysis By Market Taxonomy, 2018 to 2022

    9.2. Market Size Value (US$ Million) Forecast By Market Taxonomy, 2023 to 2033

        9.2.1. By Country

            9.2.1.1. Brazil

            9.2.1.2. Mexico

            9.2.1.3. Rest of Latin America

        9.2.2. By Solution

        9.2.3. By End-user

    9.3. Market Attractiveness Analysis

        9.3.1. By Country

        9.3.2. By Solution

        9.3.3. By End-user

    9.4. Key Takeaways

10. Europe Market Analysis 2018 to 2022 and Forecast 2023 to 2033, By Country

    10.1. Historical Market Size Value (US$ Million) Trend Analysis By Market Taxonomy, 2018 to 2022

    10.2. Market Size Value (US$ Million) Forecast By Market Taxonomy, 2023 to 2033

        10.2.1. By Country

            10.2.1.1. Germany

            10.2.1.2. U.K.

            10.2.1.3. France

            10.2.1.4. Spain

            10.2.1.5. Italy

            10.2.1.6. Rest of Europe

        10.2.2. By Solution

        10.2.3. By End-user

    10.3. Market Attractiveness Analysis

        10.3.1. By Country

        10.3.2. By Solution

        10.3.3. By End-user

    10.4. Key Takeaways

11. South Asia Market Analysis 2018 to 2022 and Forecast 2023 to 2033, By Country

    11.1. Historical Market Size Value (US$ Million) Trend Analysis By Market Taxonomy, 2018 to 2022

    11.2. Market Size Value (US$ Million) Forecast By Market Taxonomy, 2023 to 2033

        11.2.1. By Country

            11.2.1.1. India

            11.2.1.2. Malaysia

            11.2.1.3. Singapore

            11.2.1.4. Thailand

            11.2.1.5. Rest of South Asia

        11.2.2. By Solution

        11.2.3. By End-user

    11.3. Market Attractiveness Analysis

        11.3.1. By Country

        11.3.2. By Solution

        11.3.3. By End-user

    11.4. Key Takeaways

12. East Asia Market Analysis 2018 to 2022 and Forecast 2023 to 2033, By Country

    12.1. Historical Market Size Value (US$ Million) Trend Analysis By Market Taxonomy, 2018 to 2022

    12.2. Market Size Value (US$ Million) Forecast By Market Taxonomy, 2023 to 2033

        12.2.1. By Country

            12.2.1.1. China

            12.2.1.2. Japan

            12.2.1.3. South Korea

        12.2.2. By Solution

        12.2.3. By End-user

    12.3. Market Attractiveness Analysis

        12.3.1. By Country

        12.3.2. By Solution

        12.3.3. By End-user

    12.4. Key Takeaways

13. Oceania Market Analysis 2018 to 2022 and Forecast 2023 to 2033, By Country

    13.1. Historical Market Size Value (US$ Million) Trend Analysis By Market Taxonomy, 2018 to 2022

    13.2. Market Size Value (US$ Million) Forecast By Market Taxonomy, 2023 to 2033

        13.2.1. By Country

            13.2.1.1. Australia

            13.2.1.2. New Zealand

        13.2.2. By Solution

        13.2.3. By End-user

    13.3. Market Attractiveness Analysis

        13.3.1. By Country

        13.3.2. By Solution

        13.3.3. By End-user

    13.4. Key Takeaways

14. MEA Market Analysis 2018 to 2022 and Forecast 2023 to 2033, By Country

    14.1. Historical Market Size Value (US$ Million) Trend Analysis By Market Taxonomy, 2018 to 2022

    14.2. Market Size Value (US$ Million) Forecast By Market Taxonomy, 2023 to 2033

        14.2.1. By Country

            14.2.1.1. GCC Countries

            14.2.1.2. South Africa

            14.2.1.3. Israel

            14.2.1.4. Rest of MEA

        14.2.2. By Solution

        14.2.3. By End-user

    14.3. Market Attractiveness Analysis

        14.3.1. By Country

        14.3.2. By Solution

        14.3.3. By End-user

    14.4. Key Takeaways

15. Key Countries Market Analysis

    15.1. U.S.

        15.1.1. Pricing Analysis

        15.1.2. Market Share Analysis, 2022

            15.1.2.1. By Solution

            15.1.2.2. By End-user

    15.2. Canada

        15.2.1. Pricing Analysis

        15.2.2. Market Share Analysis, 2022

            15.2.2.1. By Solution

            15.2.2.2. By End-user

    15.3. Brazil

        15.3.1. Pricing Analysis

        15.3.2. Market Share Analysis, 2022

            15.3.2.1. By Solution

            15.3.2.2. By End-user

    15.4. Mexico

        15.4.1. Pricing Analysis

        15.4.2. Market Share Analysis, 2022

            15.4.2.1. By Solution

            15.4.2.2. By End-user

    15.5. Germany

        15.5.1. Pricing Analysis

        15.5.2. Market Share Analysis, 2022

            15.5.2.1. By Solution

            15.5.2.2. By End-user

    15.6. U.K.

        15.6.1. Pricing Analysis

        15.6.2. Market Share Analysis, 2022

            15.6.2.1. By Solution

            15.6.2.2. By End-user

    15.7. France

        15.7.1. Pricing Analysis

        15.7.2. Market Share Analysis, 2022

            15.7.2.1. By Solution

            15.7.2.2. By End-user

    15.8. Spain

        15.8.1. Pricing Analysis

        15.8.2. Market Share Analysis, 2022

            15.8.2.1. By Solution

            15.8.2.2. By End-user

    15.9. Italy

        15.9.1. Pricing Analysis

        15.9.2. Market Share Analysis, 2022

            15.9.2.1. By Solution

            15.9.2.2. By End-user

    15.10. India

        15.10.1. Pricing Analysis

        15.10.2. Market Share Analysis, 2022

            15.10.2.1. By Solution

            15.10.2.2. By End-user

    15.11. Malaysia

        15.11.1. Pricing Analysis

        15.11.2. Market Share Analysis, 2022

            15.11.2.1. By Solution

            15.11.2.2. By End-user

    15.12. Singapore

        15.12.1. Pricing Analysis

        15.12.2. Market Share Analysis, 2022

            15.12.2.1. By Solution

            15.12.2.2. By End-user

    15.13. Thailand

        15.13.1. Pricing Analysis

        15.13.2. Market Share Analysis, 2022

            15.13.2.1. By Solution

            15.13.2.2. By End-user

    15.14. China

        15.14.1. Pricing Analysis

        15.14.2. Market Share Analysis, 2022

            15.14.2.1. By Solution

            15.14.2.2. By End-user

    15.15. Japan

        15.15.1. Pricing Analysis

        15.15.2. Market Share Analysis, 2022

            15.15.2.1. By Solution

            15.15.2.2. By End-user

    15.16. South Korea

        15.16.1. Pricing Analysis

        15.16.2. Market Share Analysis, 2022

            15.16.2.1. By Solution

            15.16.2.2. By End-user

    15.17. Australia

        15.17.1. Pricing Analysis

        15.17.2. Market Share Analysis, 2022

            15.17.2.1. By Solution

            15.17.2.2. By End-user

    15.18. New Zealand

        15.18.1. Pricing Analysis

        15.18.2. Market Share Analysis, 2022

            15.18.2.1. By Solution

            15.18.2.2. By End-user

    15.19. GCC Countries

        15.19.1. Pricing Analysis

        15.19.2. Market Share Analysis, 2022

            15.19.2.1. By Solution

            15.19.2.2. By End-user

    15.20. South Africa

        15.20.1. Pricing Analysis

        15.20.2. Market Share Analysis, 2022

            15.20.2.1. By Solution

            15.20.2.2. By End-user

    15.21. Israel

        15.21.1. Pricing Analysis

        15.21.2. Market Share Analysis, 2022

            15.21.2.1. By Solution

            15.21.2.2. By End-user

16. Market Structure Analysis

    16.1. Competition Dashboard

    16.2. Competition Benchmarking

    16.3. Market Share Analysis of Top Players

        16.3.1. By Regional

        16.3.2. By Solution

        16.3.3. By End-user

17. Competition Analysis

    17.1. Competition Deep Dive

        17.1.1. Clarivate

            17.1.1.1. Overview

            17.1.1.2. Product Portfolio

            17.1.1.3. Profitability by Market Segments

            17.1.1.4. Sales Footprint

            17.1.1.5. Strategy Overview

                17.1.1.5.1. Marketing Strategy

        17.1.2. Dennemeyer

            17.1.2.1. Overview

            17.1.2.2. Product Portfolio

            17.1.2.3. Profitability by Market Segments

            17.1.2.4. Sales Footprint

            17.1.2.5. Strategy Overview

                17.1.2.5.1. Marketing Strategy

        17.1.3. Patrix

            17.1.3.1. Overview

            17.1.3.2. Product Portfolio

            17.1.3.3. Profitability by Market Segments

            17.1.3.4. Sales Footprint

            17.1.3.5. Strategy Overview

                17.1.3.5.1. Marketing Strategy

        17.1.4. LexisNexis Korea (Legal)

            17.1.4.1. Overview

            17.1.4.2. Product Portfolio

            17.1.4.3. Profitability by Market Segments

            17.1.4.4. Sales Footprint

            17.1.4.5. Strategy Overview

                17.1.4.5.1. Marketing Strategy

        17.1.5. Questel Korea

            17.1.5.1. Overview

            17.1.5.2. Product Portfolio

            17.1.5.3. Profitability by Market Segments

            17.1.5.4. Sales Footprint

            17.1.5.5. Strategy Overview

                17.1.5.5.1. Marketing Strategy

        17.1.6. PI IP LAW

            17.1.6.1. Overview

            17.1.6.2. Product Portfolio

            17.1.6.3. Profitability by Market Segments

            17.1.6.4. Sales Footprint

            17.1.6.5. Strategy Overview

                17.1.6.5.1. Marketing Strategy

        17.1.7. KASAN

            17.1.7.1. Overview

            17.1.7.2. Product Portfolio

            17.1.7.3. Profitability by Market Segments

            17.1.7.4. Sales Footprint

            17.1.7.5. Strategy Overview

                17.1.7.5.1. Marketing Strategy

        17.1.8. SU INTELLECTUAL PROPERTY Co. Ltd.

            17.1.8.1. Overview

            17.1.8.2. Product Portfolio

            17.1.8.3. Profitability by Market Segments

            17.1.8.4. Sales Footprint

            17.1.8.5. Strategy Overview

                17.1.8.5.1. Marketing Strategy

        17.1.9. WIPS Co. Ltd

            17.1.9.1. Overview

            17.1.9.2. Product Portfolio

            17.1.9.3. Profitability by Market Segments

            17.1.9.4. Sales Footprint

            17.1.9.5. Strategy Overview

                17.1.9.5.1. Marketing Strategy

        17.1.10. SIWONIP

            17.1.10.1. Overview

            17.1.10.2. Product Portfolio

            17.1.10.3. Profitability by Market Segments

            17.1.10.4. Sales Footprint

            17.1.10.5. Strategy Overview

                17.1.10.5.1. Marketing Strategy

        17.1.11. Kim & Chang

            17.1.11.1. Overview

            17.1.11.2. Product Portfolio

            17.1.11.3. Profitability by Market Segments

            17.1.11.4. Sales Footprint

            17.1.11.5. Strategy Overview

                17.1.11.5.1. Marketing Strategy

        17.1.12. Lee & Ko

            17.1.12.1. Overview

            17.1.12.2. Product Portfolio

            17.1.12.3. Profitability by Market Segments

            17.1.12.4. Sales Footprint

            17.1.12.5. Strategy Overview

                17.1.12.5.1. Marketing Strategy

        17.1.13. FirstLaw PC

            17.1.13.1. Overview

            17.1.13.2. Product Portfolio

            17.1.13.3. Profitability by Market Segments

            17.1.13.4. Sales Footprint

            17.1.13.5. Strategy Overview

                17.1.13.5.1. Marketing Strategy

18. Assumptions & Acronyms Used

19. Research Methodology

Don't pay for what you don't need

Customize your report by selecting specific countries or regions and save 30%!

List of Tables

Table 1: Global Market Value (US$ Million) Forecast by Region, 2018 to 2033

Table 2: Global Market Value (US$ Million) Forecast by Solution, 2018 to 2033

Table 3: Global Market Value (US$ Million) Forecast by End-user, 2018 to 2033

Table 4: North America Market Value (US$ Million) Forecast by Country, 2018 to 2033

Table 5: North America Market Value (US$ Million) Forecast by Solution, 2018 to 2033

Table 6: North America Market Value (US$ Million) Forecast by End-user, 2018 to 2033

Table 7: Latin America Market Value (US$ Million) Forecast by Country, 2018 to 2033

Table 8: Latin America Market Value (US$ Million) Forecast by Solution, 2018 to 2033

Table 9: Latin America Market Value (US$ Million) Forecast by End-user, 2018 to 2033

Table 10: Europe Market Value (US$ Million) Forecast by Country, 2018 to 2033

Table 11: Europe Market Value (US$ Million) Forecast by Solution, 2018 to 2033

Table 12: Europe Market Value (US$ Million) Forecast by End-user, 2018 to 2033

Table 13: South Asia Market Value (US$ Million) Forecast by Country, 2018 to 2033

Table 14: South Asia Market Value (US$ Million) Forecast by Solution, 2018 to 2033

Table 15: South Asia Market Value (US$ Million) Forecast by End-user, 2018 to 2033

Table 16: East Asia Market Value (US$ Million) Forecast by Country, 2018 to 2033

Table 17: East Asia Market Value (US$ Million) Forecast by Solution, 2018 to 2033

Table 18: East Asia Market Value (US$ Million) Forecast by End-user, 2018 to 2033

Table 19: Oceania Market Value (US$ Million) Forecast by Country, 2018 to 2033

Table 20: Oceania Market Value (US$ Million) Forecast by Solution, 2018 to 2033

Table 21: Oceania Market Value (US$ Million) Forecast by End-user, 2018 to 2033

Table 22: MEA Market Value (US$ Million) Forecast by Country, 2018 to 2033

Table 23: MEA Market Value (US$ Million) Forecast by Solution, 2018 to 2033

Table 24: MEA Market Value (US$ Million) Forecast by End-user, 2018 to 2033
Sudip Saha
Sudip Saha

Principal Consultant

Talk to Analyst

Find your sweet spots for generating winning opportunities in this market.

List of Charts

Figure 1: Global Market Value (US$ Million) by Solution, 2023 to 2033

Figure 2: Global Market Value (US$ Million) by End-user, 2023 to 2033

Figure 3: Global Market Value (US$ Million) by Region, 2023 to 2033

Figure 4: Global Market Value (US$ Million) Analysis by Region, 2018 to 2033

Figure 5: Global Market Value Share (%) and BPS Analysis by Region, 2023 to 2033

Figure 6: Global Market Y-o-Y Growth (%) Projections by Region, 2023 to 2033

Figure 7: Global Market Value (US$ Million) Analysis by Solution, 2018 to 2033

Figure 8: Global Market Value Share (%) and BPS Analysis by Solution, 2023 to 2033

Figure 9: Global Market Y-o-Y Growth (%) Projections by Solution, 2023 to 2033

Figure 10: Global Market Value (US$ Million) Analysis by End-user, 2018 to 2033

Figure 11: Global Market Value Share (%) and BPS Analysis by End-user, 2023 to 2033

Figure 12: Global Market Y-o-Y Growth (%) Projections by End-user, 2023 to 2033

Figure 13: Global Market Attractiveness by Solution, 2023 to 2033

Figure 14: Global Market Attractiveness by End-user, 2023 to 2033

Figure 15: Global Market Attractiveness by Region, 2023 to 2033

Figure 16: North America Market Value (US$ Million) by Solution, 2023 to 2033

Figure 17: North America Market Value (US$ Million) by End-user, 2023 to 2033

Figure 18: North America Market Value (US$ Million) by Country, 2023 to 2033

Figure 19: North America Market Value (US$ Million) Analysis by Country, 2018 to 2033

Figure 20: North America Market Value Share (%) and BPS Analysis by Country, 2023 to 2033

Figure 21: North America Market Y-o-Y Growth (%) Projections by Country, 2023 to 2033

Figure 22: North America Market Value (US$ Million) Analysis by Solution, 2018 to 2033

Figure 23: North America Market Value Share (%) and BPS Analysis by Solution, 2023 to 2033

Figure 24: North America Market Y-o-Y Growth (%) Projections by Solution, 2023 to 2033

Figure 25: North America Market Value (US$ Million) Analysis by End-user, 2018 to 2033

Figure 26: North America Market Value Share (%) and BPS Analysis by End-user, 2023 to 2033

Figure 27: North America Market Y-o-Y Growth (%) Projections by End-user, 2023 to 2033

Figure 28: North America Market Attractiveness by Solution, 2023 to 2033

Figure 29: North America Market Attractiveness by End-user, 2023 to 2033

Figure 30: North America Market Attractiveness by Country, 2023 to 2033

Figure 31: Latin America Market Value (US$ Million) by Solution, 2023 to 2033

Figure 32: Latin America Market Value (US$ Million) by End-user, 2023 to 2033

Figure 33: Latin America Market Value (US$ Million) by Country, 2023 to 2033

Figure 34: Latin America Market Value (US$ Million) Analysis by Country, 2018 to 2033

Figure 35: Latin America Market Value Share (%) and BPS Analysis by Country, 2023 to 2033

Figure 36: Latin America Market Y-o-Y Growth (%) Projections by Country, 2023 to 2033

Figure 37: Latin America Market Value (US$ Million) Analysis by Solution, 2018 to 2033

Figure 38: Latin America Market Value Share (%) and BPS Analysis by Solution, 2023 to 2033

Figure 39: Latin America Market Y-o-Y Growth (%) Projections by Solution, 2023 to 2033

Figure 40: Latin America Market Value (US$ Million) Analysis by End-user, 2018 to 2033

Figure 41: Latin America Market Value Share (%) and BPS Analysis by End-user, 2023 to 2033

Figure 42: Latin America Market Y-o-Y Growth (%) Projections by End-user, 2023 to 2033

Figure 43: Latin America Market Attractiveness by Solution, 2023 to 2033

Figure 44: Latin America Market Attractiveness by End-user, 2023 to 2033

Figure 45: Latin America Market Attractiveness by Country, 2023 to 2033

Figure 46: Europe Market Value (US$ Million) by Solution, 2023 to 2033

Figure 47: Europe Market Value (US$ Million) by End-user, 2023 to 2033

Figure 48: Europe Market Value (US$ Million) by Country, 2023 to 2033

Figure 49: Europe Market Value (US$ Million) Analysis by Country, 2018 to 2033

Figure 50: Europe Market Value Share (%) and BPS Analysis by Country, 2023 to 2033

Figure 51: Europe Market Y-o-Y Growth (%) Projections by Country, 2023 to 2033

Figure 52: Europe Market Value (US$ Million) Analysis by Solution, 2018 to 2033

Figure 53: Europe Market Value Share (%) and BPS Analysis by Solution, 2023 to 2033

Figure 54: Europe Market Y-o-Y Growth (%) Projections by Solution, 2023 to 2033

Figure 55: Europe Market Value (US$ Million) Analysis by End-user, 2018 to 2033

Figure 56: Europe Market Value Share (%) and BPS Analysis by End-user, 2023 to 2033

Figure 57: Europe Market Y-o-Y Growth (%) Projections by End-user, 2023 to 2033

Figure 58: Europe Market Attractiveness by Solution, 2023 to 2033

Figure 59: Europe Market Attractiveness by End-user, 2023 to 2033

Figure 60: Europe Market Attractiveness by Country, 2023 to 2033

Figure 61: South Asia Market Value (US$ Million) by Solution, 2023 to 2033

Figure 62: South Asia Market Value (US$ Million) by End-user, 2023 to 2033

Figure 63: South Asia Market Value (US$ Million) by Country, 2023 to 2033

Figure 64: South Asia Market Value (US$ Million) Analysis by Country, 2018 to 2033

Figure 65: South Asia Market Value Share (%) and BPS Analysis by Country, 2023 to 2033

Figure 66: South Asia Market Y-o-Y Growth (%) Projections by Country, 2023 to 2033

Figure 67: South Asia Market Value (US$ Million) Analysis by Solution, 2018 to 2033

Figure 68: South Asia Market Value Share (%) and BPS Analysis by Solution, 2023 to 2033

Figure 69: South Asia Market Y-o-Y Growth (%) Projections by Solution, 2023 to 2033

Figure 70: South Asia Market Value (US$ Million) Analysis by End-user, 2018 to 2033

Figure 71: South Asia Market Value Share (%) and BPS Analysis by End-user, 2023 to 2033

Figure 72: South Asia Market Y-o-Y Growth (%) Projections by End-user, 2023 to 2033

Figure 73: South Asia Market Attractiveness by Solution, 2023 to 2033

Figure 74: South Asia Market Attractiveness by End-user, 2023 to 2033

Figure 75: South Asia Market Attractiveness by Country, 2023 to 2033

Figure 76: East Asia Market Value (US$ Million) by Solution, 2023 to 2033

Figure 77: East Asia Market Value (US$ Million) by End-user, 2023 to 2033

Figure 78: East Asia Market Value (US$ Million) by Country, 2023 to 2033

Figure 79: East Asia Market Value (US$ Million) Analysis by Country, 2018 to 2033

Figure 80: East Asia Market Value Share (%) and BPS Analysis by Country, 2023 to 2033

Figure 81: East Asia Market Y-o-Y Growth (%) Projections by Country, 2023 to 2033

Figure 82: East Asia Market Value (US$ Million) Analysis by Solution, 2018 to 2033

Figure 83: East Asia Market Value Share (%) and BPS Analysis by Solution, 2023 to 2033

Figure 84: East Asia Market Y-o-Y Growth (%) Projections by Solution, 2023 to 2033

Figure 85: East Asia Market Value (US$ Million) Analysis by End-user, 2018 to 2033

Figure 86: East Asia Market Value Share (%) and BPS Analysis by End-user, 2023 to 2033

Figure 87: East Asia Market Y-o-Y Growth (%) Projections by End-user, 2023 to 2033

Figure 88: East Asia Market Attractiveness by Solution, 2023 to 2033

Figure 89: East Asia Market Attractiveness by End-user, 2023 to 2033

Figure 90: East Asia Market Attractiveness by Country, 2023 to 2033

Figure 91: Oceania Market Value (US$ Million) by Solution, 2023 to 2033

Figure 92: Oceania Market Value (US$ Million) by End-user, 2023 to 2033

Figure 93: Oceania Market Value (US$ Million) by Country, 2023 to 2033

Figure 94: Oceania Market Value (US$ Million) Analysis by Country, 2018 to 2033

Figure 95: Oceania Market Value Share (%) and BPS Analysis by Country, 2023 to 2033

Figure 96: Oceania Market Y-o-Y Growth (%) Projections by Country, 2023 to 2033

Figure 97: Oceania Market Value (US$ Million) Analysis by Solution, 2018 to 2033

Figure 98: Oceania Market Value Share (%) and BPS Analysis by Solution, 2023 to 2033

Figure 99: Oceania Market Y-o-Y Growth (%) Projections by Solution, 2023 to 2033

Figure 100: Oceania Market Value (US$ Million) Analysis by End-user, 2018 to 2033

Figure 101: Oceania Market Value Share (%) and BPS Analysis by End-user, 2023 to 2033

Figure 102: Oceania Market Y-o-Y Growth (%) Projections by End-user, 2023 to 2033

Figure 103: Oceania Market Attractiveness by Solution, 2023 to 2033

Figure 104: Oceania Market Attractiveness by End-user, 2023 to 2033

Figure 105: Oceania Market Attractiveness by Country, 2023 to 2033

Figure 106: MEA Market Value (US$ Million) by Solution, 2023 to 2033

Figure 107: MEA Market Value (US$ Million) by End-user, 2023 to 2033

Figure 108: MEA Market Value (US$ Million) by Country, 2023 to 2033

Figure 109: MEA Market Value (US$ Million) Analysis by Country, 2018 to 2033

Figure 110: MEA Market Value Share (%) and BPS Analysis by Country, 2023 to 2033

Figure 111: MEA Market Y-o-Y Growth (%) Projections by Country, 2023 to 2033

Figure 112: MEA Market Value (US$ Million) Analysis by Solution, 2018 to 2033

Figure 113: MEA Market Value Share (%) and BPS Analysis by Solution, 2023 to 2033

Figure 114: MEA Market Y-o-Y Growth (%) Projections by Solution, 2023 to 2033

Figure 115: MEA Market Value (US$ Million) Analysis by End-user, 2018 to 2033

Figure 116: MEA Market Value Share (%) and BPS Analysis by End-user, 2023 to 2033

Figure 117: MEA Market Y-o-Y Growth (%) Projections by End-user, 2023 to 2033

Figure 118: MEA Market Attractiveness by Solution, 2023 to 2033

Figure 119: MEA Market Attractiveness by End-user, 2023 to 2033

Figure 120: MEA Market Attractiveness by Country, 2023 to 2033

Recommendations

Explore Technology Insights

View Reports

South Korea Intellectual Property Market