Spectral Cell Analyzers Market Size and Share Forecast Outlook (2023 to 2033)

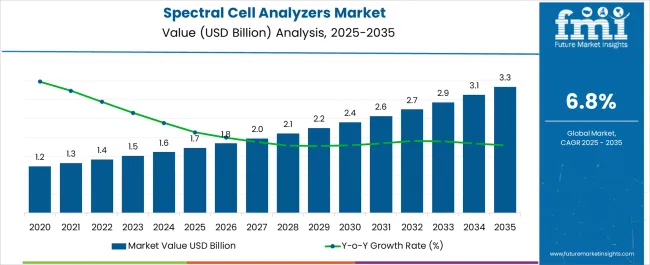
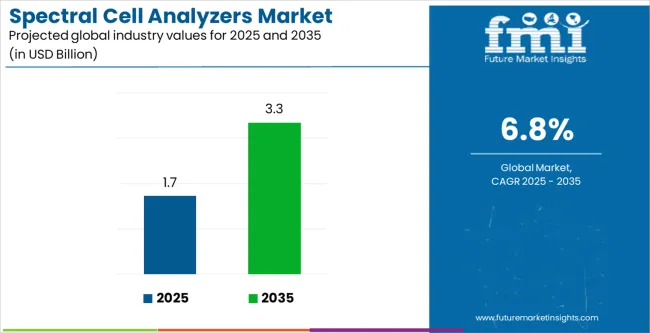
The spectral cell analyzers market size is projected to be worth USD 1.5 Billion in 2023. The market is likely to surpass USD 3.0 Billion by 2033 at a CAGR of 7.2% during the forecast period. Technological advances and widespread implementation in different research and medical fields are driving market expansion.

Furthermore, the adoption of flow cytometry technology in innovative applications for research such as cytogenomics, proteomics, and marine biology contributes to market growth. Furthermore, rising illness rates such as cancer and HIV are likely to drive the cell analyzers market.

Other Drivers Propelling the Demand for Spectral Cell Analyzers Market include:

  • Continuous developments in spectral cell analyzer performance and capabilities are increasing their usage.
  • The market is growing due to an increase in demand for sophisticated cell analysis techniques in many research domains such as immunology, cancer research, stem cell research, and drug development.
  • The increased emphasis on personalized treatment leads to the demand for spectral cell analyzers, which give detailed information on cellular properties.
  • Single-cell analysis is best suited to spectral cell analyzers with high-resolution capabilities and the capacity to analyze numerous parameters concurrently. The increased interest in single-cell analysis techniques encourages the use of spectral cell analyzers.

Challenges for Companies /Manufacturers in the Spectral Cell Analyzers Market:

  • Adoption may be hampered by the expensive initial investment and recurring costs, particularly for smaller research laboratories and healthcare organisations with restricted finances.
  • The intricacy of data processing may be a hurdle for researchers and physicians unfamiliar with advanced data analysis methodologies, thereby restricting the widespread use of spectral cell analyzers.
  • A lack of knowledge and training on the capabilities and possible uses of spectral cell analyzers might stymie their use in some situations.
  • The existence of alternative technologies and intense rivalry may have an influence on market share and adoption rates.

Opportunities in the Spectral Cell Analyzers Market Industry:

  • In fields such as antibody production, cell line creation, and cell treatment manufacture, the burgeoning biopharmaceutical sector provides enormous prospects for spectral cell analyzers.
  • Emerging regions such as Asia-Pacific, Latin America, and the Middle East, as well as increasing biotechnology and pharmaceutical sectors, provide significant growth potential for spectral cell analyzers.
  • The increased interest in single-cell analysis approaches presents spectral cell analyzers with a considerable potential.
  • The use of spectral cell analyzers into clinical diagnostics has the potential to improve patient care while also increasing workflow efficiency.

Latest Trends in the Spectral Cell Analyzers Market:

  • Novel methods, such as spectral flow cytometry and image flow cytometry, are being developed to open up new paths for research and therapeutic applications.
  • Collaborations and collaborations among makers of spectral cell analyzers, research institutes, and healthcare providers can promote innovation and market growth.
Attributes Details
Spectral Cell Analyzers Market Size (2023) USD 1.5 billion
Spectral Cell Analyzers Market Projected Size (2033) USD 3.0 billion
Value CAGR (2023 to 2033) 7.2%

Comparison of Historical vs Future Outlook on Changing Consumer Trends for Spectral Cell Analyzers Industry

From 2017 to 2022, the global spectral cell analyzers market experienced a CAGR of 6.3%, reaching a market size of USD 1.5 billion in 2023.

From 2017 to 2022, the global spectral cell analyzers market industry witnessed steady growth. Over the years, the market for spectral cell analyzers has grown steadily. Flow cytometry, particularly spectral cell analysis, has become widely used in a variety of academic and therapeutic settings. In the past, technological advancements, growing applications in disciplines such as immunology, cancer research, and drug development, and rising demand for personalized medicine were driving drivers for market expansion.

Future Forecast for Spectral Cell Analyzers Market Industry:

Looking ahead, the global spectral cell analyzers market industry is expected to rise at a CAGR of 7.2% from 2023 to 2033. During the forecast period, the market size is expected to reach USD 3.0 billion by 2033.

The spectral cell analyzers market industry is expected to continue its growth trajectory from 2023 to 2033. The emphasis on personalized medicine is projected to grow in the coming years. With its capacity to perform extensive cellular analysis, spectral cell analyzers will play a critical role in providing precise diagnosis, prognosis, and therapy selection. Demand for spectral cell analyzers will rise as personalized medicine becomes more popular.

Single-cell analysis methods are gaining popularity in both scientific and therapeutic settings. Because spectral cell analyzers can do high-resolution and multi parametric analysis, they are ideal for single-cell analysis. As the need for single-cell analysis grows, spectral cell analyzers will play an important role in driving market expansion.
Analysis of Top Countries Using and Deploying Spectral Cell Analyzers

Spectral Cell Analyzers Market to Surge in the United States Due to Demand in Drug Discovery.

Country The United States
Market Size (USD Million) by End of Forecast Period (2033) USD 941.9 million
CAGR % 2023 to End of Forecast (2033) 8.9%

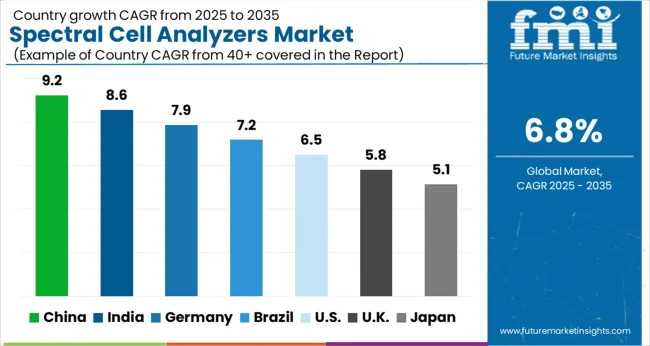
The spectral cell analyzers market industry in the United States is expected to reach a market size of USD 941.9 million by 2033, expanding at a CAGR of 8.9%. The biopharmaceutical business in the United States is well-established and prospering, with major investments in research and development. The market is predicted to rise due to increased demand for spectral cell analyzers in drug discovery, biologics manufacturing, and quality control applications.

Rising Demand for Spectral Cell Analyzers Market is Due to the Growing Biotechnology Sector.

Country The United Kingdom
Market Size (USD Million) by End of Forecast Period (2033) USD 149.4 million
CAGR % 2023 to End of Forecast (2033) 8.7%

The spectral cell analyzers market industry in the United Kingdom is expected to reach a market size of USD 149.4 million, expanding at a CAGR of 8.7% during the forecast period due to growing biotechnology center. The United Kingdom offers world-class research and academic institutions, which help to drive demand for spectral cell analyzers. These organisations promote research operations in a variety of domains, including immunology, cancer research, and drug discovery, which leads to the use of spectral cell analyzers.

Notable Growth Expected in China's Spectral Cell Analyzers Market due to Government Support and Investments.

Country China
Market Size (USD Million) by End of Forecast Period (2033) USD 274.8 million
CAGR % 2023 to End of Forecast (2033) 9.1%

The spectral cell analyzers market industry in China is anticipated to reach a market size of USD 274.8 million, moving at a CAGR of 9.1% during the forecast period. The spectral cell analyzers market industry in China is expected to grow prominently due to the increasing government support and investments. The Chinese government has aggressively promoted the growth of the life sciences industry. Initiatives like Made in China 2025 and increasing research and development spending provide chances for spectral cell analyzer producers and promote market expansion.
It’s Strong Research and Academic Institutions to Drive Market Growth in Japan

Country Japan
Market Size (USD Million) by End of Forecast Period (2033) USD 223.5 million
CAGR % 2023 to End of Forecast (2033) 8.4%

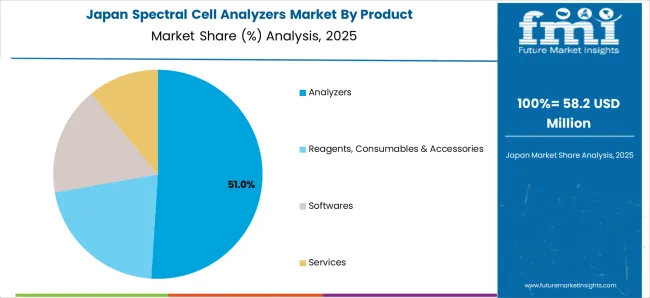
The spectral cell analyzers market industry in Japan is estimated to reach a market size of USD 223.5 million by 2033, thriving at a CAGR of 8.48%. The market in Japan is predicted to grow because of its strong research and academic institutions. Japan boasts world-class research and educational facilities, which contribute to the high demand for spectral cell analyzers. These organisations promote research operations in a variety of domains, including immunology, cancer research, and drug discovery, which leads to the use of spectral cell analyzers.
Demand for Spectral Cell Analyzers Market is Rising Due to Technological Innovations and Funding by Government.

Country South Korea
Market Size (USD Million) by End of Forecast Period (2033) USD 67.9 million
CAGR % 2023 to End of Forecast (2033) 6.6%

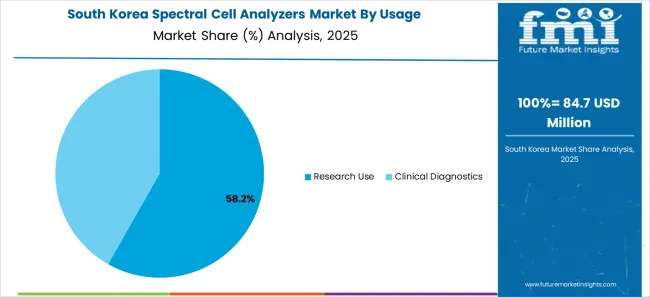
The spectral cell analyzers market industry in South Korea is expected to reach a market size of USD 67.9 million, expanding at a CAGR of 6.6% during the forecast period. South Korea is well-known for its emphasis on innovation and research and development financing. Continuous technical improvements in spectral cell analyzers, as well as financing from government agencies, research grants, and private ventures, have the potential to drive market expansion.

Spectral Cell Analyzers Industry Analysis by Top Investment Segments

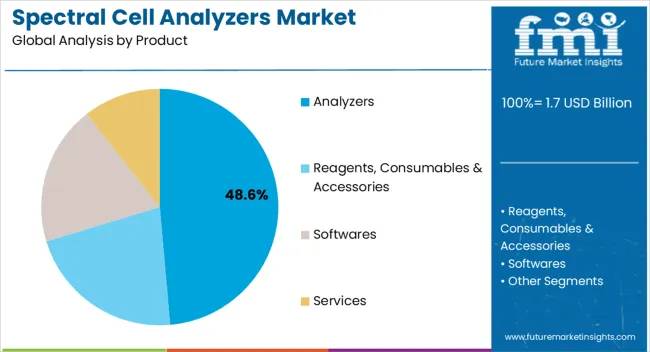
Reagents, Consumables & Accessories to Dominate Spectral Cell Analyzers Market Industry with 53.5% Market Share in 2022

The reagents, consumables & accessories dominated the spectral cell analyzers market industry with a market share of 53.5% in 2022. End users anticipate reagents, consumables, and accessories that have been specially created and optimized for use with their spectral cell analyzers. Compatibility provides precise and dependable outcomes, while optimized components improve workflow efficiency and overall system performance.

Customers value reagents, consumables, and accessories that are simple to use and easily integrate into their workflow. User-friendly components, clear instructions, and simpler protocols all contribute to time savings and mistake reduction, boosting overall efficiency and convenience.

Which Usage is Dominating Market?

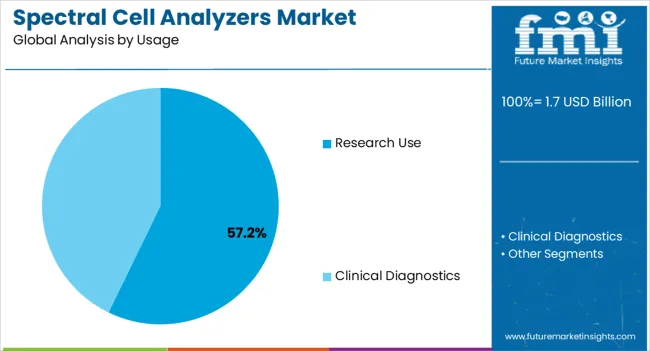
The research use is dominating the spectral cell analyzers market with the market share of 79.6% in 2022. The combination of multi-parametric analysis, high sensitivity, thorough cellular analysis, flexibility, technical developments, and the capacity to examine cellular heterogeneity has contributed to spectral cell analyzers' widespread usage in research. Spectral cell analyzers are valuable tools for researchers in a variety of domains for expanding their understanding of cellular biology and unravelling complicated biological processes.

Which End User Is Widely Adopted In the Market?

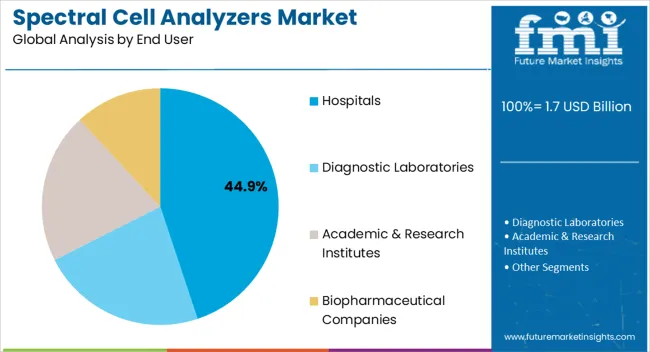
The biopharmaceutical companies dominated the spectral cell analyzers market with the market share of 49.0% in 2022. Due to their unique capabilities and benefits, spectral cell analyzers have seen widespread adoption among biopharmaceutical businesses. Biopharmaceutical firms that use spectral cell analyzers may optimize their manufacturing processes, maintain product quality and consistency, ease research and development, and enhance their understanding of cellular biology and medicinal efficacy. In the biopharmaceutical business, these variables lead to increased efficiency, shortened medication development schedules, and better product safety.
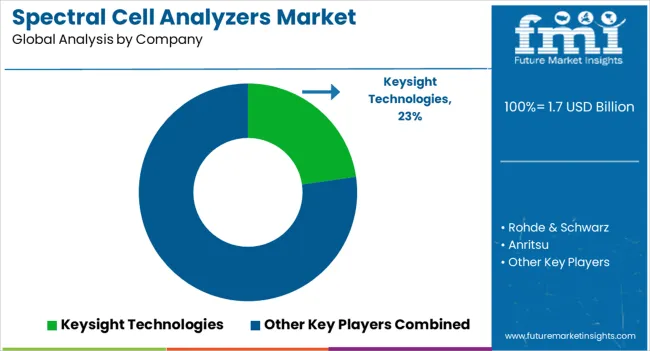
Leading Suppliers of Spectral Cell Analyzers

The spectral cell analyzers sector is fiercely competitive, with many companies fighting for market dominance. To stay ahead of the competition in such a circumstance, essential players must employ smart techniques.

Key Strategies Used by the Participants

  • Product Innovation

Key players focus on developing and introducing innovative products to address unmet needs in the market. They invest in research and development to improve existing formulations, delivery systems, and enhance the efficacy and safety of the products.

  • Strategic Partnerships and Collaborations

Key players often form strategic partnerships and collaborations with other companies, research institutes, or healthcare organizations, these partnerships allow for knowledge sharing, joint research and development efforts, and access to complementary technologies or expertise.

  • Expansion into Emerging Markets

Key players strive to expand their presence in different geographic regions to tap into new markets and reach a wider customer base. They may establish subsidiaries, distribution networks. Or strategic alliances in various countries to strengthen their market position.

  • Mergers and Acquisitions

Companies in the market may engage in mergers or acquisitions to consolidate their product portfolio, acquire new technologies, these strategic moves allow companies to enter new market segments, gain access to novel products or intellectual property, and achieve synergies in terms of research, manufacturing, or distributions.

Top Spectral Cell Analyzers Industry Players by Market Share

  • Keysight Technologies
  • Rohde & Schwarz
  • Anritsu
  • Tektronix
  • Agilent (now Keysight Technologies)
  • Advantest
  • Yokogawa
  • Viavi Solutions (formerly JDSU)
  • Rigol Technologies
  • Siglent Technologies
  • Sony

Key Developments in the Spectral Cell Analyzers Market:

  • In June 2019, the ID7000 premier spectral cell analyzer, a revolutionary flow cytometer that provides streamlined coloured cell assessment for more than 44 colours, has been introduced by Sony Corporation.
  • In Sept. 2021, a spectral-enabled cell analyzer has been released, according to BD (Becton, Dickinson + corporation), a well-known corporation in the medical technology industry.

Top Segments Studied in the Spectral Cell Analyzers Market Research Report

By Product:

  • Analyzers
  • Reagents, Consumables & Accessories
  • Softwares
  • Services

By Usage:

  • Research Use
  • Clinical Diagnostics

By End User:

  • Hospitals
  • Diagnostic Laboratories
  • Academic & Research Institutes
  • Biopharmaceutical Companies

By Region:

  • North America
  • Latin America
  • Europe
  • East Asia
  • South Asia
  • Oceania
  • The Middle East & Africa

Table of Content

  • 1. Executive Summary
  • 2. Market Overview
  • 3. Key Market Trends
  • 4. Value Added Insights
  • 5. Market Background
  • 6. Global Market Volume (in Units) Analysis 2017 to 2022 and Forecast, 2023 to 2033
  • 7. Global Market - Pricing Analysis
  • 8. Global Market Demand (in Value or Size in USD Million) Analysis 2017 to 2022 and Forecast, 2023 to 2033
  • 9. Global Market Analysis 2017 to 2022 and Forecast 2023 to 2033, By Product
    • 9.1. Analyzers
    • 9.2. Reagents, Consumables & Accessories
    • 9.3. Software
    • 9.4. Services
  • 10. Global Market Analysis 2017 to 2022 and Forecast 2023 to 2033, By Usage
    • 10.1. Research Use
    • 10.2. Clinical Diagnostics
  • 11. Global Market Analysis 2017 to 2022 and Forecast 2023 to 2033, By End User
    • 11.1. Hospitals
    • 11.2. Diagnostic Laboratories
    • 11.3. Academic & Research Institutes
    • 11.4. Biopharmaceutical Companies
  • 12. Global Market Analysis 2017 to 2022 and Forecast 2023 to 2033, By Region
    • 12.1. North America
    • 12.2. Latin America
    • 12.3. Europe
    • 12.4. South Asia
    • 12.5. East Asia
    • 12.6. Oceania
    • 12.7. Middle East and Africa
  • 13. North America Market Analysis 2017 to 2022 and Forecast 2023 to 2033
  • 14. Latin America Market Analysis 2017 to 2022 and Forecast 2023 to 2033
  • 15. Europe Market Analysis 2017 to 2022 and Forecast 2023 to 2033
  • 16. South Asia Market Analysis 2017 to 2022 and Forecast 2023 to 2033
  • 17. East Asia Market Analysis 2017 to 2022 and Forecast 2023 to 2033
  • 18. Oceania Market Analysis 2017 to 2022 and Forecast 2023 to 2033
  • 19. Middle East and Africa Market Analysis
  • 21. Competition Analysis
    • 21.1. Keysight Technologies
    • 21.2. Rohde & Schwarz
    • 21.3. Anritsu
    • 21.4. Tektronix
    • 21.5. Agilent (now Keysight Technologies)
    • 21.6. Advantest
    • 21.7. Yokogawa
    • 21.8. Viavi Solutions (formerly JDSU)
    • 21.9. Rigol Technologies
    • 21.10. Siglent Technologies
    • 21.11. Sony
  • 22. Assumptions and Acronyms Used
  • 23. Research Methodology

List of Tables

Table 01: Global Market Value (US$ Million) Analysis and Forecast 2017 to 2033, by Product

Table 02: Global Market Volume (Units) Analysis and Forecast 2017 to 2033, by Product

Table 03: Global Market Value (US$ Million) Analysis and Forecast 2017 to 2033, by Usage

Table 04: Global Market Value (US$ Million) Analysis and Forecast 2017 to 2033, by End User

Table 05: Global Market Value (US$ Million) Analysis and Forecast 2017 to 2033, by Region

Table 06: North America Market Value (US$ Million) Analysis 2017 to 2022 and Forecast 2023 to 2033, by Country

Table 07: North America Market Value (US$ Million) Analysis and Forecast 2017 to 2033, by Product

Table 08: North America Market Volume (Units) Analysis and Forecast 2017 to 2033, by Product

Table 09: North America Market Value (US$ Million) Analysis and Forecast 2017 to 2033, by Usage

Table 10: North America Market Value (US$ Million) Analysis and Forecast 2017 to 2033, by End User

Table 11: Latin America Market Value (US$ Million) Analysis 2017 to 2022 and Forecast 2023 to 2033, by Country

Table 12: Latin America Market Value (US$ Million) Analysis and Forecast 2017 to 2033, by Product

Table 13: Latin America Market Volume (Units) Analysis and Forecast 2017 to 2033, by Product

Table 14: Latin America Market Value (US$ Million) Analysis and Forecast 2017 to 2033, by Usage

Table 15: Latin America Market Value (US$ Million) Analysis and Forecast 2017 to 2033, by End User

Table 16: Europe Market Value (US$ Million) Analysis 2017 to 2022 and Forecast 2023 to 2033, by Country

Table 17: Europe Market Value (US$ Million) Analysis and Forecast 2017 to 2033, by Product

Table 18: Europe Market Volume (Units) Analysis and Forecast 2017 to 2033, by Product

Table 19: Europe Market Value (US$ Million) Analysis and Forecast 2017 to 2033, by Usage

Table 20: Europe Market Value (US$ Million) Analysis and Forecast 2017 to 2033, by End User

Table 21: South Asia Market Value (US$ Million) Analysis 2017 to 2022 and Forecast 2023 to 2033, by Country

Table 22: South Asia Market Value (US$ Million) Analysis and Forecast 2017 to 2033, by Product

Table 23: South Asia Market Volume (Units) Analysis and Forecast 2017 to 2033, by Product

Table 24: South Asia Market Value (US$ Million) Analysis and Forecast 2017 to 2033, by Usage

Table 25: South Asia Market Value (US$ Million) Analysis and Forecast 2017 to 2033, by End User

Table 26: East Asia Market Value (US$ Million) Analysis 2017 to 2022 and Forecast 2023 to 2033, by Country

Table 27: East Asia Market Value (US$ Million) Analysis and Forecast 2017 to 2033, by Product

Table 28: East Asia Market Volume (Units) Analysis and Forecast 2017 to 2033, by Product

Table 29: East Asia Market Value (US$ Million) Analysis and Forecast 2017 to 2033, by Usage

Table 30: East Asia Market Value (US$ Million) Analysis and Forecast 2017 to 2033, by End User

Table 31: Oceania Market Value (US$ Million) Analysis 2017 to 2022 and Forecast 2023 to 2033, by Country

Table 32: Oceania Market Value (US$ Million) Analysis and Forecast 2017 to 2033, by Product

Table 33: Oceania Market Volume (Units) Analysis and Forecast 2017 to 2033, by Product

Table 34: Oceania Market Value (US$ Million) Analysis and Forecast 2017 to 2033, by Usage

Table 35: Oceania Market Value (US$ Million) Analysis and Forecast 2017 to 2033, by End User

Table 36: Middle East & Africa Market Value (US$ Million) Analysis 2017 to 2022 and Forecast 2023 to 2033, by Country

Table 37: Middle East & Africa Market Value (US$ Million) Analysis and Forecast 2017 to 2033, by Product

Table 38: Middle East & Africa Market Volume (Units) Analysis and Forecast 2017 to 2033, by Product

Table 39: Middle East & Africa Market Value (US$ Million) Analysis and Forecast 2017 to 2033, by Usage

Table 40: Middle East & Africa Market Value (US$ Million) Analysis and Forecast 2017 to 2033, by End User

List of Figures

Figure 01: Global Market Volume (Units), 2017 to 2022

Figure 02: Global Market Volume (Units) & Y-o-Y Growth (%) Analysis, 2023 to 2033

Figure 03: Pricing Analysis per unit (US$), in 2022

Figure 04: Pricing Forecast per unit (US$), in 2033

Figure 05: Global Market Value (US$ Million) Analysis, 2017 to 2022

Figure 06: Global Market Forecast & Y-o-Y Growth, 2023 to 2033

Figure 07: Global Market Absolute $ Opportunity (US$ Million) Analysis, 2023 to 2033

Figure 08: Global Market Value Share (%) Analysis 2023 and 2033, by Product

Figure 09: Global Market Y-o-Y Growth (%) Analysis 2023 to 2033, by Product

Figure 10: Global Market Attractiveness Analysis 2023 to 2033, by Product

Figure 11: Global Market Value Share (%) Analysis 2023 and 2033, by Usage

Figure 12: Global Market Y-o-Y Growth (%) Analysis 2023 to 2033, by Usage

Figure 13: Global Market Attractiveness Analysis 2023 to 2033, by Usage

Figure 14: Global Market Value Share (%) Analysis 2023 and 2033, by End User

Figure 15: Global Market Y-o-Y Growth (%) Analysis 2023 to 2033, by End User

Figure 16: Global Market Attractiveness Analysis 2023 to 2033, by End User

Figure 17: Global Market Value Share (%) Analysis 2023 and 2033, by Region

Figure 18: Global Market Y-o-Y Growth (%) Analysis 2023 to 2033, by Region

Figure 19: Global Market Attractiveness Analysis 2023 to 2033, by Region

Figure 20: North America Market Value (US$ Million) Analysis, 2017 to 2022

Figure 21: North America Market Value (US$ Million) Forecast, 2023 to 2033

Figure 22: North America Market Value Share, by Product (2023 E)

Figure 23: North America Market Value Share, by Usage (2023 E)

Figure 24: North America Market Value Share, by End User (2023 E)

Figure 25: North America Market Value Share, by Country (2023 E)

Figure 26: North America Market Attractiveness Analysis by Product, 2023 to 2033

Figure 27: North America Market Attractiveness Analysis by Usage, 2023 to 2033

Figure 28: North America Market Attractiveness Analysis by End User, 2023 to 2033

Figure 29: North America Market Attractiveness Analysis by Country, 2023 to 2033

Figure 30: USA Market Value Proportion Analysis, 2022

Figure 31: Global Vs. USA Growth Comparison

Figure 32: USA Market Share Analysis (%) by Product, 2023 & 2033

Figure 33: USA Market Share Analysis (%) by Usage, 2023 & 2033

Figure 34: USA Market Share Analysis (%) by End User, 2023 & 2033

Figure 35: Canada Market Value Proportion Analysis, 2022

Figure 36: Global Vs. Canada. Growth Comparison

Figure 37: Canada Market Share Analysis (%) by Product, 2023 & 2033

Figure 38: Canada Market Share Analysis (%) by Usage, 2023 & 2033

Figure 39: Canada Market Share Analysis (%) by End User, 2023 & 2033

Figure 40: Latin America Market Value (US$ Million) Analysis, 2017 to 2022

Figure 41: Latin America Market Value (US$ Million) Forecast, 2023 to 2033

Figure 42: Latin America Market Value Share, by Product (2023 E)

Figure 43: Latin America Market Value Share, by Usage (2023 E)

Figure 44: Latin America Market Value Share, by End User (2023 E)

Figure 45: Latin America Market Value Share, by Country (2023 E)

Figure 46: Latin America Market Attractiveness Analysis by Product, 2023 to 2033

Figure 47: Latin America Market Attractiveness Analysis by Usage, 2023 to 2033

Figure 48: Latin America Market Attractiveness Analysis by End User, 2023 to 2033

Figure 49: Latin America Market Attractiveness Analysis by Country, 2023 to 2033

Figure 50: Mexico Market Value Proportion Analysis, 2022

Figure 51: Global Vs Mexico Growth Comparison

Figure 52: Mexico Market Share Analysis (%) by Product, 2023 & 2033

Figure 53: Mexico Market Share Analysis (%) by Usage, 2023 & 2033

Figure 54: Mexico Market Share Analysis (%) by End User, 2023 & 2033

Figure 55: Brazil Market Value Proportion Analysis, 2022

Figure 56: Global Vs. Brazil. Growth Comparison

Figure 57: Brazil Market Share Analysis (%) by Product, 2023 & 2033

Figure 58: Brazil Market Share Analysis (%) by Usage, 2023 & 2033

Figure 59: Brazil Market Share Analysis (%) by End User, 2023 & 2033

Figure 60: Argentina Market Value Proportion Analysis, 2022

Figure 61: Global Vs Argentina Growth Comparison

Figure 62: Argentina Market Share Analysis (%) by Product, 2023 & 2033

Figure 63: Argentina Market Share Analysis (%) by Usage, 2023 & 2033

Figure 64: Argentina Market Share Analysis (%) by End User, 2023 & 2033

Figure 65: Europe Market Value (US$ Million) Analysis, 2017 to 2022

Figure 66: Europe Market Value (US$ Million) Forecast, 2023 to 2033

Figure 67: Europe Market Value Share, by Product (2023 E)

Figure 68: Europe Market Value Share, by Usage (2023 E)

Figure 69: Europe Market Value Share, by End User (2023 E)

Figure 70: Europe Market Value Share, by Country (2023 E)

Figure 71: Europe Market Attractiveness Analysis by Product, 2023 to 2033

Figure 72: Europe Market Attractiveness Analysis by Usage, 2023 to 2033

Figure 73: Europe Market Attractiveness Analysis by End User, 2023 to 2033

Figure 74: Europe Market Attractiveness Analysis by Country, 2023 to 2033

Figure 75: UK Market Value Proportion Analysis, 2022

Figure 76: Global Vs. UK Growth Comparison

Figure 77: UK Market Share Analysis (%) by Product, 2023 & 2033

Figure 78: UK Market Share Analysis (%) by Usage, 2023 & 2033

Figure 79: UK Market Share Analysis (%) by End User, 2023 & 2033

Figure 80: Germany Market Value Proportion Analysis, 2022

Figure 81: Global Vs. Germany Growth Comparison

Figure 82: Germany Market Share Analysis (%) by Product, 2023 & 2033

Figure 83: Germany Market Share Analysis (%) by Usage, 2023 & 2033

Figure 84: Germany Market Share Analysis (%) by End User, 2023 & 2033

Figure 85: Italy Market Value Proportion Analysis, 2022

Figure 86: Global Vs. Italy Growth Comparison

Figure 87: Italy Market Share Analysis (%) by Product, 2023 & 2033

Figure 88: Italy Market Share Analysis (%) by Usage, 2023 & 2033

Figure 89: Italy Market Share Analysis (%) by End User, 2023 & 2033

Figure 90: France Market Value Proportion Analysis, 2022

Figure 91: Global Vs France Growth Comparison

Figure 92: France Market Share Analysis (%) by Product, 2023 & 2033

Figure 93: France Market Share Analysis (%) by Usage, 2023 & 2033

Figure 94: France Market Share Analysis (%) by End User, 2023 & 2033

Figure 95: Spain Market Value Proportion Analysis, 2022

Figure 96: Global Vs Spain Growth Comparison

Figure 97: Spain Market Share Analysis (%) by Product, 2023 & 2033

Figure 98: Spain Market Share Analysis (%) by Usage, 2023 & 2033

Figure 99: Spain Market Share Analysis (%) by End User, 2023 & 2033

Figure 100: Russia Market Value Proportion Analysis, 2022

Figure 101: Global Vs Russia Growth Comparison

Figure 102: Russia Market Share Analysis (%) by Product, 2023 & 2033

Figure 103: Russia Market Share Analysis (%) by Usage, 2023 & 2033

Figure 104: Russia Market Share Analysis (%) by End User, 2023 & 2033

Figure 105: BENELUX Market Value Proportion Analysis, 2022

Figure 106: Global Vs BENELUX Growth Comparison

Figure 107: BENELUX Market Share Analysis (%) by Product, 2023 & 2033

Figure 108: BENELUX Market Share Analysis (%) by Usage, 2023 & 2033

Figure 109: BENELUX Market Share Analysis (%) by End User, 2023 & 2033

Figure 110: East Asia Market Value (US$ Million) Analysis, 2017 to 2022

Figure 111: East Asia Market Value (US$ Million) Forecast, 2023 to 2033

Figure 112: East Asia Market Value Share, by Product (2023 E)

Figure 113: East Asia Market Value Share, by Usage (2023 E)

Figure 114: East Asia Market Value Share, by End User (2023 E)

Figure 115: East Asia Market Value Share, by Country (2023 E)

Figure 116: East Asia Market Attractiveness Analysis by Product, 2023 to 2033

Figure 117: East Asia Market Attractiveness Analysis by Usage, 2023 to 2033

Figure 118: East Asia Market Attractiveness Analysis by End User, 2023 to 2033

Figure 119: East Asia Market Attractiveness Analysis by Country, 2023 to 2033

Figure 120: China Market Value Proportion Analysis, 2022

Figure 121: Global Vs. China Growth Comparison

Figure 122: China Market Share Analysis (%) by Product, 2023 & 2033

Figure 123: China Market Share Analysis (%) by Usage, 2023 & 2033

Figure 124: China Market Share Analysis (%) by End User, 2023 & 2033

Figure 125: Japan Market Value Proportion Analysis, 2022

Figure 126: Global Vs. Japan Growth Comparison

Figure 127: Japan Market Share Analysis (%) by Product, 2023 & 2033

Figure 128: Japan Market Share Analysis (%) by Usage, 2023 & 2033

Figure 129: Japan Market Share Analysis (%) by End User, 2023 & 2033

Figure 130: South Korea Market Value Proportion Analysis, 2022

Figure 131: Global Vs South Korea Growth Comparison

Figure 132: South Korea Market Share Analysis (%) by Product, 2023 & 2033

Figure 133: South Korea Market Share Analysis (%) by Usage, 2023 & 2033

Figure 134: South Korea Market Share Analysis (%) by End User, 2023 & 2033

Figure 135: South Asia Market Value (US$ Million) Analysis, 2017 to 2022

Figure 136: South Asia Market Value (US$ Million) Forecast, 2023 to 2033

Figure 137: South Asia Market Value Share, by Product (2023 E)

Figure 138: South Asia Market Value Share, by Usage (2023 E)

Figure 139: South Asia Market Value Share, by End User (2023 E)

Figure 140: South Asia Market Value Share, by Country (2023 E)

Figure 141: South Asia Market Attractiveness Analysis by Product, 2023 to 2033

Figure 142: South Asia Market Attractiveness Analysis by Usage, 2023 to 2033

Figure 143: South Asia Market Attractiveness Analysis by End User, 2023 to 2033

Figure 144: South Asia Market Attractiveness Analysis by Country, 2023 to 2033

Figure 145: India Market Value Proportion Analysis, 2022

Figure 146: Global Vs. India Growth Comparison

Figure 147: India Market Share Analysis (%) by Product, 2023 & 2033

Figure 148: India Market Share Analysis (%) by Usage, 2023 & 2033

Figure 149: India Market Share Analysis (%) by End User, 2023 & 2033

Figure 150: Indonesia Market Value Proportion Analysis, 2022

Figure 151: Global Vs. Indonesia Growth Comparison

Figure 152: Indonesia Market Share Analysis (%) by Product, 2023 & 2033

Figure 153: Indonesia Market Share Analysis (%) by Usage, 2023 & 2033

Figure 154: Indonesia Market Share Analysis (%) by End User, 2023 & 2033

Figure 155: Malaysia Market Value Proportion Analysis, 2022

Figure 156: Global Vs. Malaysia Growth Comparison

Figure 157: Malaysia Market Share Analysis (%) by Product, 2023 & 2033

Figure 158: Malaysia Market Share Analysis (%) by Usage, 2023 & 2033

Figure 159: Malaysia Market Share Analysis (%) by End User, 2023 & 2033

Figure 160: Thailand Market Value Proportion Analysis, 2022

Figure 161: Global Vs. Thailand Growth Comparison

Figure 162: Thailand Market Share Analysis (%) by Product, 2023 & 2033

Figure 163: Thailand Market Share Analysis (%) by Usage, 2023 & 2033

Figure 164: Thailand Market Share Analysis (%) by End User, 2023 & 2033

Figure 165: Oceania Market Value (US$ Million) Analysis, 2017 to 2022

Figure 166: Oceania Market Value (US$ Million) Forecast, 2023 to 2033

Figure 167: Oceania Market Value Share, by Product (2023 E)

Figure 168: Oceania Market Value Share, by Usage (2023 E)

Figure 169: Oceania Market Value Share, by End User (2023 E)

Figure 170: Oceania Market Value Share, by Country (2023 E)

Figure 171: Oceania Market Attractiveness Analysis by Product, 2023 to 2033

Figure 172: Oceania Market Attractiveness Analysis by Usage, 2023 to 2033

Figure 173: Oceania Market Attractiveness Analysis by End User, 2023 to 2033

Figure 174: Oceania Market Attractiveness Analysis by Country, 2023 to 2033

Figure 175: Australia Market Value Proportion Analysis, 2022

Figure 176: Global Vs. Australia Growth Comparison

Figure 177: Australia Market Share Analysis (%) by Product, 2023 & 2033

Figure 178: Australia Market Share Analysis (%) by Usage, 2023 & 2033

Figure 179: Australia Market Share Analysis (%) by End User, 2023 & 2033

Figure 180: New Zealand Market Value Proportion Analysis, 2022

Figure 181: Global Vs New Zealand Growth Comparison

Figure 182: New Zealand Market Share Analysis (%) by Product, 2023 & 2033

Figure 183: New Zealand Market Share Analysis (%) by Usage, 2023 & 2033

Figure 184: New Zealand Market Share Analysis (%) by End User, 2023 & 2033

Figure 185: Middle East & Africa Market Value (US$ Million) Analysis, 2017 to 2022

Figure 186: Middle East & Africa Market Value (US$ Million) Forecast, 2023 to 2033

Figure 187: Middle East & Africa Market Value Share, by Product (2023 E)

Figure 188: Middle East & Africa Market Value Share, by Usage (2023 E)

Figure 189: Middle East & Africa Market Value Share, by End User (2023 E)

Figure 190: Middle East & Africa Market Value Share, by Country (2023 E)

Figure 191: Middle East & Africa Market Attractiveness Analysis by Product, 2023 to 2033

Figure 192: Middle East & Africa Market Attractiveness Analysis by Usage, 2023 to 2033

Figure 193: Middle East & Africa Market Attractiveness Analysis by End User, 2023 to 2033

Figure 194: Middle East & Africa Market Attractiveness Analysis by Country, 2023 to 2033

Figure 195: GCC Countries Market Value Proportion Analysis, 2022

Figure 196: Global Vs GCC Countries Growth Comparison

Figure 197: GCC Countries Market Share Analysis (%) by Product, 2023 & 2033

Figure 198: GCC Countries Market Share Analysis (%) by Usage, 2023 & 2033

Figure 199: GCC Countries Market Share Analysis (%) by End User, 2023 & 2033

Figure 200: Türkiye Market Value Proportion Analysis, 2022

Figure 201: Global Vs. Türkiye Growth Comparison

Figure 202: Türkiye Market Share Analysis (%) by Product, 2023 & 2033

Figure 203: Türkiye Market Share Analysis (%) by Usage, 2023 & 2033

Figure 204: Türkiye Market Share Analysis (%) by End User, 2023 & 2033

Figure 205: South Africa Market Value Proportion Analysis, 2022

Figure 206: Global Vs. South Africa Growth Comparison

Figure 207: South Africa Market Share Analysis (%) by Product, 2023 & 2033

Figure 208: South Africa Market Share Analysis (%) by Usage, 2023 & 2033

Figure 209: South Africa Market Share Analysis (%) by End User, 2023 & 2033

Figure 210: Northern Africa Market Value Proportion Analysis, 2022

Figure 211: Global Vs Northern Africa Growth Comparison

Figure 212: Northern Africa Market Share Analysis (%) by Product, 2023 & 2033

Figure 213: Northern Africa Market Share Analysis (%) by Usage, 2023 & 2033

Figure 214: Northern Africa Market Share Analysis (%) by End User, 2023 & 2033

Frequently Asked Questions

What is the Estimated Growth Rate of the Currency Counting Machines Market?

The currency counting machines market is estimated to advance at 4.9% CAGR through 2033.

How Big Will the Currency Counting Machines Market?

The market is expected to be worth around USD 373.4 million by 2033.

What Factor May Restrain the Currency Counting Machines Market?

High maintenance costs and consistent power supply may hamper the market growth.

Which Country is Set to Register Exponential Growth in the Market?

The United States may witness significant growth in the market.

Who are the Key Currency Counting Machines Market Players?

Web Sac Systems, Bcash, and Prompt Automation are key market players.

Explore Similar Insights

Future Market Insights

Spectral Cell Analyzers Market