Multispectral Camera Market Overview

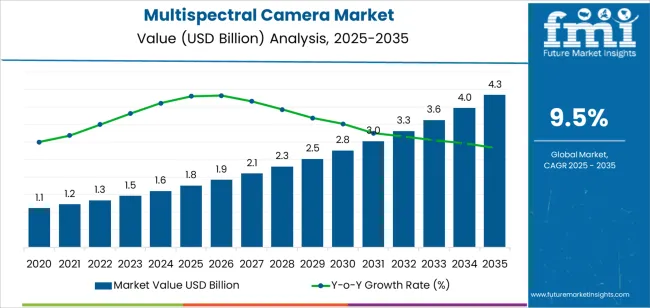
The multispectral camera market is expected to grow at a CAGR of 9.5% during the projected period. The market value is projected to increase from US$ 1.6 billion in 2024 to US$ 3.9 billion by 2034.

Attributes Details
Multispectral Camera Market Size, 2024 US$ 1.6 billion
Projected Market Size, 2034 US$ 3.9 billion
Value-based CAGR (2024 to 2034) 9.5%

Don't pay for what you don't need

Customize your report by selecting specific countries or regions and save 30%!

Multispectral Camera Market Size, Analysis, and Insights

  • The rising adoption of precision agriculture techniques is driving the demand for multispectral cameras.
  • The growing global population, the agriculture industry is embracing precision agriculture techniques to improve crop yields and reduce wastage.
  • Precision agriculture technologies driving the demand for multispectral cameras in the agriculture industry.
  • Rising need for environmental monitoring is driving the demand for multispectral cameras in the environmental sector.
  • Growing prevalence of chronic diseases and the need for early diagnosis and treatment are driving the demand for multispectral cameras in the healthcare industry.
  • Increasing concerns about threats to national security and the need for advanced defense technologies, the demand for multispectral cameras in the defense industry is growing.
  • Growing adoption of unmanned aerial vehicles (UAV) is driving the demand for multispectral cameras in the UAV industry.

Key Opportunities in the Multispectral Camera Market

  • Increased use of AI is improving data analysis, leading to better decision-making, and efficient resource use is expected to create lucrative opportunities for multispectral cameras during the forecast period.
  • Customized solutions are in demand, creating specialized multispectral cameras for various applications, such as crop monitoring and medical imaging.
  • Multispectral cameras are being used in new industries, like food and automotive, to detect contaminants and defects which create significant opportunities for manufacturers.
  • The multispectral camera market is experiencing growth due to advancements in hyperspectral imaging and spectral sensors, enabling more precise capture of images and data.
  • The growth of the hyperspectral imaging and spectral sensors industry is expected to create immense opportunity for the multispectral camera market.
  • Emerging economies, like India and China, are driving demand due to rapid economic growth and the adoption of precision agriculture and healthcare techniques.
Sudip Saha
Sudip Saha

Principal Consultant

Talk to Analyst

Find your sweet spots for generating winning opportunities in this market.

Challenges in the Multispectral Camera Market

  • The high cost of these cameras is a significant barrier to entry for many buyers, particularly in developing countries. As a result, many potential customers may opt for cheaper, less accurate solutions.
  • Lack of standardization makes it difficult for customers to compare different products and make informed decisions. It creates challenges for manufacturers, who must design and manufacture products that meet the specific requirements of customers.
  • Limited awareness of the benefits and applications of these cameras.
  • As a relatively new technology, many potential customers may not be aware of the capabilities and potential uses of multispectral cameras.
  • This makes it difficult for manufacturers to market their products effectively.
  • The large amounts of data generated by multispectral cameras can be difficult to process and analyze.
  • Data processing presents a challenge for customers who may lack the necessary expertise or resources to manage and analyze the data.
  • There are also technical limitations to the multispectral camera market, particularly in terms of the resolution and accuracy of the cameras.
  • Manufacturers must continue to invest in research and development to improve the capabilities of these cameras and remain competitive in the market.

Category-wise Insights

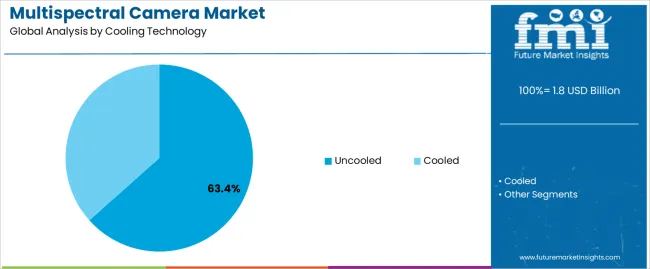
In terms of Cooling Technology, the Cooled Segment Leads the Market Growth

Attributes Details
Top Cooling Technology Cooled
CAGR from 2024 to 2034 13.7%
  • The cooled segment is dominating the multispectral camera market due to its superior performance in terms of sensitivity and signal-to-noise ratio.
  • Cooled cameras typically offer a wider range of spectral sensitivity than uncooled cameras, which makes them more versatile for different applications.
  • Cooled cameras are also more durable and can withstand harsh environments, which is important for outdoor and industrial use.
  • Cooled cameras are typically more expensive than uncooled cameras, which can be a barrier for some customers.
  • As a result, the market for cooled cameras is mostly driven by high-end applications and industries that require the best possible performance.

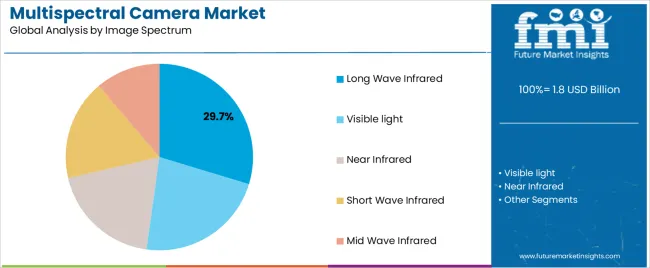
In Terms of Image Spectrum, the Visible Light Segment is Expected to Dominate the Market

Attributes Details
Top Image Spectrum Visible Light
CAGR from 2024 to 2034 13.5%
  • The visible light segment is dominating the multispectral camera market as the human eye is highly sensitive to visible light wavelengths.
  • The visible light spectrum is useful for a wide range of applications, including agriculture, environmental monitoring, and surveillance, which is further driving the growth of the segment.
  • One of the factors contributing to the dominance of visible light in the market is the availability of high-quality and affordable sensors that can capture visible light data.
  • The availability leads to the development of multispectral cameras that are compact, lightweight, and easy to use, making them accessible to a wider range of users.

Get the data you need at a Fraction of the cost

Personalize your report by choosing insights you need
and save 40%!

Country-wise insights

Countries CAGR through 2034
United States 9.8%
United Kingdom 10.8%
China 9.9%
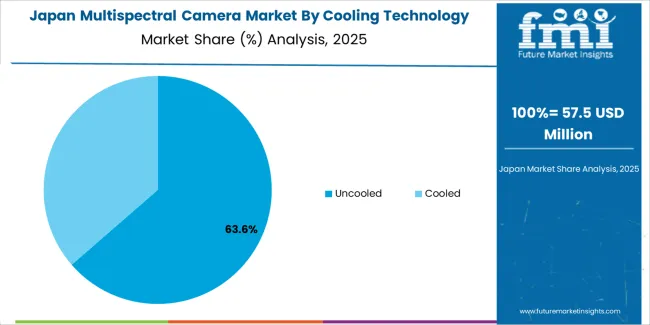
Japan 11.2%
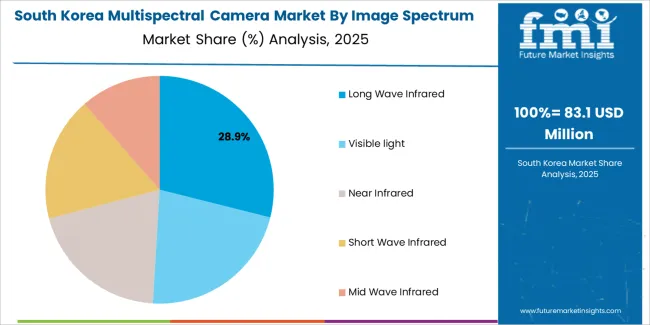
South Korea 10.9%

Growing Trend towards the Development of Compact and Lightweight Cameras in the United States

  • In the United States, the demand for multispectral cameras has been driven by the growing adoption of precision agriculture.
  • Key companies are investing heavily in research and development to improve the performance and functionality of multispectral cameras.
  • The market is witnessing a growing trend towards the development of compact and lightweight cameras that can be easily integrated into drones and other unmanned systems in the United States.

Growing Trend toward the Development of Hyperspectral Cameras in The United Kingdom

  • The increasing adoption of precision agriculture practices in the United Kingdom is driving the growth of the market.
  • Farmers in the United Kingdom are using multispectral cameras to monitor crop health, identify diseases, and manage irrigation.
  • Multispectral cameras are used in other industries such as environmental monitoring, archaeology, and defense in the United Kingdom.
  • The United Kingdom is witnessing a growing trend towards the development of hyperspectral cameras that can capture images across a wider range of wavelengths.
  • The development is expected to further drive the demand for multispectral cameras in the country.

China Has a Large Number of Small and Medium-Sized Enterprises

  • The major application of multispectral cameras in China is in the field of remote sensing.
  • The cameras are being used to monitor environmental conditions, such as air and water quality, and to track changes in land use and urbanization.
  • The Chinese government has been investing heavily in these areas, which has created a significant demand for multispectral cameras.
  • China has a large number of small and medium-sized enterprises (SMEs) that are involved in the production of multispectral cameras.
  • Companies have been competing fiercely in the market, which has led to a decrease in prices and an increase in the quality of the products.
  • The Chinese government's support for the development of high-tech industries has also encouraged the growth of this market.

Japan Has a Large Number of Universities and Research Institutes

  • In Japan, the demand for multispectral cameras has been increasing steadily.
  • The country's aging population is another factor contributing to the market’s expansion.
  • Multispectral cameras are being used in healthcare to detect and monitor various diseases, such as skin cancer and Alzheimer's disease in Japan.
  • Japan has a strong focus on research and development. The country has a large number of universities and research institutes that are involved in the development of multispectral cameras.
  • Organizations have been collaborating with companies to develop new products and technologies, which leads to the growth of the market in Japan.
  • The Japanese government has been investing in the development of new technologies, which has also contributed to the growth of the market.

Increasing Demand for Advanced Technologies in South Korea

  • South Korea is a country that has experienced incredible economic growth and technological advancement in recent years.
  • As a result, the demand for advanced technologies such as multispectral cameras has been on the rise, particularly in industries such as agriculture, defense, and forestry.
  • Increasing need for accurate and efficient methods of data collection and analysis in South Korea is boosting product demand.
  • Multispectral cameras are being used in other industries such as defense and forestry in South Korea.
  • The country's commitment to innovation and technological advancement is driving the market forward.
  • South Korea has a strong culture of entrepreneurship and innovation, and the government has implemented policies to promote the growth of high-tech industries.

Competitive Landscape

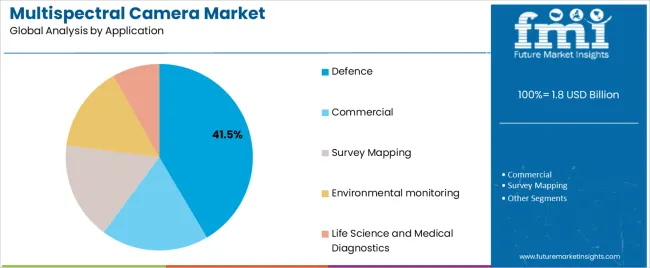
The market is highly competitive, with numerous players vying for market share. The market is driven by demand from various sectors, including agriculture, healthcare, and defense. Multispectral cameras are used extensively in precision agriculture to assess crop health, detect diseases, and optimize crop yields.

The healthcare sector uses multispectral cameras for imaging and diagnosis, while the defense sector uses them for surveillance and reconnaissance. The market is characterized by constant innovation, with players investing heavily in R&D to develop new products and technologies that offer superior performance and functionality.

Several players are also focusing on expanding their geographical presence by entering into strategic partnerships and collaborations with regional players.

Recent Developments in the Multispectral Camera Market

In 2023, an innovative multi-spectral camera named Hawk Indigo was recently unveiled by Raptor Photonics. The camera is designed to be durable and features a cutting-edge 2/3" CMOS sensor. This highly advanced sensor is capable of delivering exceptional UV sensitivity and boasts an impressive quantum efficiency (QE) of 36% at 250 nm.

Key Market Players

  • DJI
  • Collins Aerospace
  • Cubert GMBH
  • Hensoldt
  • HGH Group
  • JAI
  • Leonardo DRS
  • Ocean Insight
  • Opgal Optronics Industries Ltd.
  • Paras Aerospace
  • Spectral Devices
  • Silios technology
  • Telops Inc.
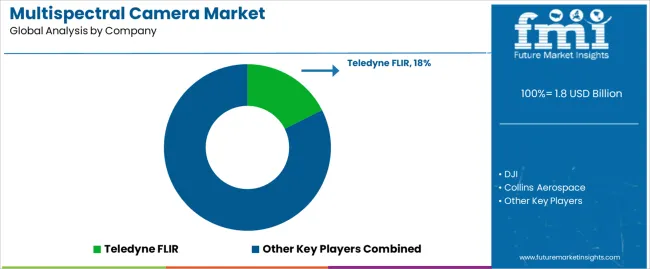
  • Teledyne FLIR
  • TetraCam Inc.
  • Unispectral

Key Coverage in the Multispectral Camera Market Report

  • Spectral Imaging Market Report
  • Global Multispectral Camera Industry Analysis
  • Multispectral Camera Applications Assessment
  • Multispectral Sensor Market Forecast Overview
  • Hyperspectral camera Pricing Outlook

Key Market Segmentation

By Cooling Technology:

  • Cooled
  • Uncooled

By Image Spectrum:

  • Visible light
  • Near Infrared
  • Short Wave Infrared
  • Mid Wave Infrared
  • Long Wave Infrared

By Application:

  • Defence
  • Commercial
  • Survey Mapping
  • Environmental monitoring
  • Life Science and Medical Diagnostics

By Region:

  • North America
  • Latin America
  • East Asia
  • South Asia
  • Europe
  • Oceania
  • MEA

Frequently Asked Questions

How Big is the Multispectral Camera Market in 2024?

The multispectral camera market is estimated to be valued at US$ 1.6 billion in 2024.

What is China’s Market Outlook?

The market in China is expected to progress at a CAGR of 9.9% through the forecast period.

Which Cooling Technology Segment Contributes More to the Multispectral Camera Market?

Within the cooling technology, the cooled segment is expected to register a 9.5% CAGR from 2024 to 2034.

What is the United States Market Outlook?

The United States accounts for around 9.8% of the global CAGR from 2024 to 2034.

What is the Global Market Projected Value for 2034?

The market is set to reach a valuation of around US$ 3.9 billion by the end of 2034.

What Was the Historical CAGR for the Market?

The demand for multispectral cameras increased at a 12.0% CAGR from 2019 to 2023.

Table of Content
1. Executive Summary
    1.1. Global Market Outlook
    1.2. Demand-side Trends
    1.3. Supply-side Trends
    1.4. Technology Roadmap Analysis
    1.5. Analysis and Recommendations
2. Market Overview
    2.1. Market Coverage / Taxonomy
    2.2. Market Definition / Scope / Limitations
3. Market Background
    3.1. Market Dynamics
        3.1.1. Drivers
        3.1.2. Restraints
        3.1.3. Opportunity
        3.1.4. Trends
    3.2. Scenario Forecast
        3.2.1. Demand in Optimistic Scenario
        3.2.2. Demand in Likely Scenario
        3.2.3. Demand in Conservative Scenario
    3.3. Opportunity Map Analysis
    3.4. Product Life Cycle Analysis
    3.5. Supply Chain Analysis
        3.5.1. Supply Side Participants and their Roles
            3.5.1.1. Manufacturer
            3.5.1.2. Mid-Level Participants (Traders)
            3.5.1.3. Distributors
        3.5.2. Value Added and Value Created at Node in the Supply Chain
        3.5.3. List of Raw Material Suppliers
        3.5.4. List of Existing and Potential Buyer’s
    3.6. Investment Feasibility Matrix
    3.7. Value Chain Analysis
        3.7.1. Profit Margin Analysis
        3.7.2. Distributors
    3.8. PESTLE and Porter’s Analysis
    3.9. Regulatory Landscape
        3.9.1. By Key Regions
        3.9.2. By Key Countries
    3.10. Regional Parent Market Outlook
    3.11. Production and Consumption Statistics
    3.12. Import and Export Statistics
4. Global Market Analysis 2019 to 2023 and Forecast, 2024 to 2034
    4.1. Historical Market Size Value (US$ Million) & Volume (Units) Analysis, 2019 to 2023
    4.2. Current and Future Market Size Value (US$ Million) & Volume (Units) Projections, 2024 to 2034
        4.2.1. Y-o-Y Growth Trend Analysis
        4.2.2. Absolute $ Opportunity Analysis
5. Global Market Analysis 2019 to 2023 and Forecast 2024 to 2034, By Cooling Technology
    5.1. Introduction / Key Findings
    5.2. Historical Market Size Value (US$ Million) & Volume (Units) Analysis By Cooling Technology, 2019 to 2023
    5.3. Current and Future Market Size Value (US$ Million) & Volume (Units) Analysis and Forecast By Cooling Technology, 2024 to 2034
        5.3.1. Cooled
        5.3.2. Uncooled
    5.4. Y-o-Y Growth Trend Analysis By Cooling Technology, 2019 to 2023
    5.5. Absolute $ Opportunity Analysis By Cooling Technology, 2024 to 2034
6. Global Market Analysis 2019 to 2023 and Forecast 2024 to 2034, By Image Spectrum
    6.1. Introduction / Key Findings
    6.2. Historical Market Size Value (US$ Million) & Volume (Units) Analysis By Image Spectrum, 2019 to 2023
    6.3. Current and Future Market Size Value (US$ Million) & Volume (Units) Analysis and Forecast By Image Spectrum, 2024 to 2034
        6.3.1. Visible light
        6.3.2. Near Infrared
        6.3.3. Short Wave Infrared
        6.3.4. Mid Wave Infrared
        6.3.5. Long Wave Infrared
    6.4. Y-o-Y Growth Trend Analysis By Image Spectrum, 2019 to 2023
    6.5. Absolute $ Opportunity Analysis By Image Spectrum, 2024 to 2034
7. Global Market Analysis 2019 to 2023 and Forecast 2024 to 2034, By Application
    7.1. Introduction / Key Findings
    7.2. Historical Market Size Value (US$ Million) & Volume (Units) Analysis By Application, 2019 to 2023
    7.3. Current and Future Market Size Value (US$ Million) & Volume (Units) Analysis and Forecast By Application, 2024 to 2034
        7.3.1. Defence
        7.3.2. Commercial
        7.3.3. Survey Mapping
        7.3.4. Environmental monitoring
        7.3.5. Life Science and Medical Diagnostics
    7.4. Y-o-Y Growth Trend Analysis By Application, 2019 to 2023
    7.5. Absolute $ Opportunity Analysis By Application, 2024 to 2034
8. Global Market Analysis 2019 to 2023 and Forecast 2024 to 2034, By Region
    8.1. Introduction
    8.2. Historical Market Size Value (US$ Million) & Volume (Units) Analysis By Region, 2019 to 2023
    8.3. Current Market Size Value (US$ Million) & Volume (Units) Analysis and Forecast By Region, 2024 to 2034
        8.3.1. North America
        8.3.2. Latin America
        8.3.3. Western Europe
        8.3.4. Eastern Europe
        8.3.5. South Asia and Pacific
        8.3.6. East Asia
        8.3.7. Middle East and Africa
    8.4. Market Attractiveness Analysis By Region
9. North America Market Analysis 2019 to 2023 and Forecast 2024 to 2034, By Country
    9.1. Historical Market Size Value (US$ Million) & Volume (Units) Trend Analysis By Market Taxonomy, 2019 to 2023
    9.2. Market Size Value (US$ Million) & Volume (Units) Forecast By Market Taxonomy, 2024 to 2034
        9.2.1. By Country
            9.2.1.1. USA
            9.2.1.2. Canada
        9.2.2. By Cooling Technology
        9.2.3. By Image Spectrum
        9.2.4. By Application
    9.3. Market Attractiveness Analysis
        9.3.1. By Country
        9.3.2. By Cooling Technology
        9.3.3. By Image Spectrum
        9.3.4. By Application
    9.4. Key Takeaways
10. Latin America Market Analysis 2019 to 2023 and Forecast 2024 to 2034, By Country
    10.1. Historical Market Size Value (US$ Million) & Volume (Units) Trend Analysis By Market Taxonomy, 2019 to 2023
    10.2. Market Size Value (US$ Million) & Volume (Units) Forecast By Market Taxonomy, 2024 to 2034
        10.2.1. By Country
            10.2.1.1. Brazil
            10.2.1.2. Mexico
            10.2.1.3. Rest of Latin America
        10.2.2. By Cooling Technology
        10.2.3. By Image Spectrum
        10.2.4. By Application
    10.3. Market Attractiveness Analysis
        10.3.1. By Country
        10.3.2. By Cooling Technology
        10.3.3. By Image Spectrum
        10.3.4. By Application
    10.4. Key Takeaways
11. Western Europe Market Analysis 2019 to 2023 and Forecast 2024 to 2034, By Country
    11.1. Historical Market Size Value (US$ Million) & Volume (Units) Trend Analysis By Market Taxonomy, 2019 to 2023
    11.2. Market Size Value (US$ Million) & Volume (Units) Forecast By Market Taxonomy, 2024 to 2034
        11.2.1. By Country
            11.2.1.1. Germany
            11.2.1.2. UK
            11.2.1.3. France
            11.2.1.4. Spain
            11.2.1.5. Italy
            11.2.1.6. Rest of Western Europe
        11.2.2. By Cooling Technology
        11.2.3. By Image Spectrum
        11.2.4. By Application
    11.3. Market Attractiveness Analysis
        11.3.1. By Country
        11.3.2. By Cooling Technology
        11.3.3. By Image Spectrum
        11.3.4. By Application
    11.4. Key Takeaways
12. Eastern Europe Market Analysis 2019 to 2023 and Forecast 2024 to 2034, By Country
    12.1. Historical Market Size Value (US$ Million) & Volume (Units) Trend Analysis By Market Taxonomy, 2019 to 2023
    12.2. Market Size Value (US$ Million) & Volume (Units) Forecast By Market Taxonomy, 2024 to 2034
        12.2.1. By Country
            12.2.1.1. Poland
            12.2.1.2. Russia
            12.2.1.3. Czech Republic
            12.2.1.4. Romania
            12.2.1.5. Rest of Eastern Europe
        12.2.2. By Cooling Technology
        12.2.3. By Image Spectrum
        12.2.4. By Application
    12.3. Market Attractiveness Analysis
        12.3.1. By Country
        12.3.2. By Cooling Technology
        12.3.3. By Image Spectrum
        12.3.4. By Application
    12.4. Key Takeaways
13. South Asia and Pacific Market Analysis 2019 to 2023 and Forecast 2024 to 2034, By Country
    13.1. Historical Market Size Value (US$ Million) & Volume (Units) Trend Analysis By Market Taxonomy, 2019 to 2023
    13.2. Market Size Value (US$ Million) & Volume (Units) Forecast By Market Taxonomy, 2024 to 2034
        13.2.1. By Country
            13.2.1.1. India
            13.2.1.2. Bangladesh
            13.2.1.3. Australia
            13.2.1.4. New Zealand
            13.2.1.5. Rest of South Asia and Pacific
        13.2.2. By Cooling Technology
        13.2.3. By Image Spectrum
        13.2.4. By Application
    13.3. Market Attractiveness Analysis
        13.3.1. By Country
        13.3.2. By Cooling Technology
        13.3.3. By Image Spectrum
        13.3.4. By Application
    13.4. Key Takeaways
14. East Asia Market Analysis 2019 to 2023 and Forecast 2024 to 2034, By Country
    14.1. Historical Market Size Value (US$ Million) & Volume (Units) Trend Analysis By Market Taxonomy, 2019 to 2023
    14.2. Market Size Value (US$ Million) & Volume (Units) Forecast By Market Taxonomy, 2024 to 2034
        14.2.1. By Country
            14.2.1.1. China
            14.2.1.2. Japan
            14.2.1.3. South Korea
        14.2.2. By Cooling Technology
        14.2.3. By Image Spectrum
        14.2.4. By Application
    14.3. Market Attractiveness Analysis
        14.3.1. By Country
        14.3.2. By Cooling Technology
        14.3.3. By Image Spectrum
        14.3.4. By Application
    14.4. Key Takeaways
15. Middle East and Africa Market Analysis 2019 to 2023 and Forecast 2024 to 2034, By Country
    15.1. Historical Market Size Value (US$ Million) & Volume (Units) Trend Analysis By Market Taxonomy, 2019 to 2023
    15.2. Market Size Value (US$ Million) & Volume (Units) Forecast By Market Taxonomy, 2024 to 2034
        15.2.1. By Country
            15.2.1.1. GCC Countries
            15.2.1.2. South Africa
            15.2.1.3. Israel
            15.2.1.4. Rest of MEA
        15.2.2. By Cooling Technology
        15.2.3. By Image Spectrum
        15.2.4. By Application
    15.3. Market Attractiveness Analysis
        15.3.1. By Country
        15.3.2. By Cooling Technology
        15.3.3. By Image Spectrum
        15.3.4. By Application
    15.4. Key Takeaways
16. Key Countries Market Analysis
    16.1. USA
        16.1.1. Pricing Analysis
        16.1.2. Market Share Analysis, 2023
            16.1.2.1. By Cooling Technology
            16.1.2.2. By Image Spectrum
            16.1.2.3. By Application
    16.2. Canada
        16.2.1. Pricing Analysis
        16.2.2. Market Share Analysis, 2023
            16.2.2.1. By Cooling Technology
            16.2.2.2. By Image Spectrum
            16.2.2.3. By Application
    16.3. Brazil
        16.3.1. Pricing Analysis
        16.3.2. Market Share Analysis, 2023
            16.3.2.1. By Cooling Technology
            16.3.2.2. By Image Spectrum
            16.3.2.3. By Application
    16.4. Mexico
        16.4.1. Pricing Analysis
        16.4.2. Market Share Analysis, 2023
            16.4.2.1. By Cooling Technology
            16.4.2.2. By Image Spectrum
            16.4.2.3. By Application
    16.5. Germany
        16.5.1. Pricing Analysis
        16.5.2. Market Share Analysis, 2023
            16.5.2.1. By Cooling Technology
            16.5.2.2. By Image Spectrum
            16.5.2.3. By Application
    16.6. UK
        16.6.1. Pricing Analysis
        16.6.2. Market Share Analysis, 2023
            16.6.2.1. By Cooling Technology
            16.6.2.2. By Image Spectrum
            16.6.2.3. By Application
    16.7. France
        16.7.1. Pricing Analysis
        16.7.2. Market Share Analysis, 2023
            16.7.2.1. By Cooling Technology
            16.7.2.2. By Image Spectrum
            16.7.2.3. By Application
    16.8. Spain
        16.8.1. Pricing Analysis
        16.8.2. Market Share Analysis, 2023
            16.8.2.1. By Cooling Technology
            16.8.2.2. By Image Spectrum
            16.8.2.3. By Application
    16.9. Italy
        16.9.1. Pricing Analysis
        16.9.2. Market Share Analysis, 2023
            16.9.2.1. By Cooling Technology
            16.9.2.2. By Image Spectrum
            16.9.2.3. By Application
    16.10. Poland
        16.10.1. Pricing Analysis
        16.10.2. Market Share Analysis, 2023
            16.10.2.1. By Cooling Technology
            16.10.2.2. By Image Spectrum
            16.10.2.3. By Application
    16.11. Russia
        16.11.1. Pricing Analysis
        16.11.2. Market Share Analysis, 2023
            16.11.2.1. By Cooling Technology
            16.11.2.2. By Image Spectrum
            16.11.2.3. By Application
    16.12. Czech Republic
        16.12.1. Pricing Analysis
        16.12.2. Market Share Analysis, 2023
            16.12.2.1. By Cooling Technology
            16.12.2.2. By Image Spectrum
            16.12.2.3. By Application
    16.13. Romania
        16.13.1. Pricing Analysis
        16.13.2. Market Share Analysis, 2023
            16.13.2.1. By Cooling Technology
            16.13.2.2. By Image Spectrum
            16.13.2.3. By Application
    16.14. India
        16.14.1. Pricing Analysis
        16.14.2. Market Share Analysis, 2023
            16.14.2.1. By Cooling Technology
            16.14.2.2. By Image Spectrum
            16.14.2.3. By Application
    16.15. Bangladesh
        16.15.1. Pricing Analysis
        16.15.2. Market Share Analysis, 2023
            16.15.2.1. By Cooling Technology
            16.15.2.2. By Image Spectrum
            16.15.2.3. By Application
    16.16. Australia
        16.16.1. Pricing Analysis
        16.16.2. Market Share Analysis, 2023
            16.16.2.1. By Cooling Technology
            16.16.2.2. By Image Spectrum
            16.16.2.3. By Application
    16.17. New Zealand
        16.17.1. Pricing Analysis
        16.17.2. Market Share Analysis, 2023
            16.17.2.1. By Cooling Technology
            16.17.2.2. By Image Spectrum
            16.17.2.3. By Application
    16.18. China
        16.18.1. Pricing Analysis
        16.18.2. Market Share Analysis, 2023
            16.18.2.1. By Cooling Technology
            16.18.2.2. By Image Spectrum
            16.18.2.3. By Application
    16.19. Japan
        16.19.1. Pricing Analysis
        16.19.2. Market Share Analysis, 2023
            16.19.2.1. By Cooling Technology
            16.19.2.2. By Image Spectrum
            16.19.2.3. By Application
    16.20. South Korea
        16.20.1. Pricing Analysis
        16.20.2. Market Share Analysis, 2023
            16.20.2.1. By Cooling Technology
            16.20.2.2. By Image Spectrum
            16.20.2.3. By Application
    16.21. GCC Countries
        16.21.1. Pricing Analysis
        16.21.2. Market Share Analysis, 2023
            16.21.2.1. By Cooling Technology
            16.21.2.2. By Image Spectrum
            16.21.2.3. By Application
    16.22. South Africa
        16.22.1. Pricing Analysis
        16.22.2. Market Share Analysis, 2023
            16.22.2.1. By Cooling Technology
            16.22.2.2. By Image Spectrum
            16.22.2.3. By Application
    16.23. Israel
        16.23.1. Pricing Analysis
        16.23.2. Market Share Analysis, 2023
            16.23.2.1. By Cooling Technology
            16.23.2.2. By Image Spectrum
            16.23.2.3. By Application
17. Market Structure Analysis
    17.1. Competition Dashboard
    17.2. Competition Benchmarking
    17.3. Market Share Analysis of Top Players
        17.3.1. By Regional
        17.3.2. By Cooling Technology
        17.3.3. By Image Spectrum
        17.3.4. By Application
18. Competition Analysis
    18.1. Competition Deep Dive
        18.1.1. FLIR Systems
            18.1.1.1. Overview
            18.1.1.2. Product Portfolio
            18.1.1.3. Profitability by Market Segments
            18.1.1.4. Sales Footprint
            18.1.1.5. Strategy Overview
                18.1.1.5.1. Marketing Strategy
                18.1.1.5.2. Product Strategy
                18.1.1.5.3. Channel Strategy
        18.1.2. Teledyne Technologies Incorporated
            18.1.2.1. Overview
            18.1.2.2. Product Portfolio
            18.1.2.3. Profitability by Market Segments
            18.1.2.4. Sales Footprint
            18.1.2.5. Strategy Overview
                18.1.2.5.1. Marketing Strategy
                18.1.2.5.2. Product Strategy
                18.1.2.5.3. Channel Strategy
        18.1.3. Headwall Photonics
            18.1.3.1. Overview
            18.1.3.2. Product Portfolio
            18.1.3.3. Profitability by Market Segments
            18.1.3.4. Sales Footprint
            18.1.3.5. Strategy Overview
                18.1.3.5.1. Marketing Strategy
                18.1.3.5.2. Product Strategy
                18.1.3.5.3. Channel Strategy
        18.1.4. BaySpec
            18.1.4.1. Overview
            18.1.4.2. Product Portfolio
            18.1.4.3. Profitability by Market Segments
            18.1.4.4. Sales Footprint
            18.1.4.5. Strategy Overview
                18.1.4.5.1. Marketing Strategy
                18.1.4.5.2. Product Strategy
                18.1.4.5.3. Channel Strategy
        18.1.5. Ximea Corp
            18.1.5.1. Overview
            18.1.5.2. Product Portfolio
            18.1.5.3. Profitability by Market Segments
            18.1.5.4. Sales Footprint
            18.1.5.5. Strategy Overview
                18.1.5.5.1. Marketing Strategy
                18.1.5.5.2. Product Strategy
                18.1.5.5.3. Channel Strategy
        18.1.6. LemnaTec GmbH
            18.1.6.1. Overview
            18.1.6.2. Product Portfolio
            18.1.6.3. Profitability by Market Segments
            18.1.6.4. Sales Footprint
            18.1.6.5. Strategy Overview
                18.1.6.5.1. Marketing Strategy
                18.1.6.5.2. Product Strategy
                18.1.6.5.3. Channel Strategy
        18.1.7. Satlantis Microsats
            18.1.7.1. Overview
            18.1.7.2. Product Portfolio
            18.1.7.3. Profitability by Market Segments
            18.1.7.4. Sales Footprint
            18.1.7.5. Strategy Overview
                18.1.7.5.1. Marketing Strategy
                18.1.7.5.2. Product Strategy
                18.1.7.5.3. Channel Strategy
        18.1.8. Silios Technologies
            18.1.8.1. Overview
            18.1.8.2. Product Portfolio
            18.1.8.3. Profitability by Market Segments
            18.1.8.4. Sales Footprint
            18.1.8.5. Strategy Overview
                18.1.8.5.1. Marketing Strategy
                18.1.8.5.2. Product Strategy
                18.1.8.5.3. Channel Strategy
        18.1.9. Photonfocus AG
            18.1.9.1. Overview
            18.1.9.2. Product Portfolio
            18.1.9.3. Profitability by Market Segments
            18.1.9.4. Sales Footprint
            18.1.9.5. Strategy Overview
                18.1.9.5.1. Marketing Strategy
                18.1.9.5.2. Product Strategy
                18.1.9.5.3. Channel Strategy
        18.1.10. Norsk Elektro Optikk AS
            18.1.10.1. Overview
            18.1.10.2. Product Portfolio
            18.1.10.3. Profitability by Market Segments
            18.1.10.4. Sales Footprint
            18.1.10.5. Strategy Overview
                18.1.10.5.1. Marketing Strategy
                18.1.10.5.2. Product Strategy
                18.1.10.5.3. Channel Strategy
19. Assumptions & Acronyms Used
20. Research Methodology
Recommendations

Technology

CCTV Camera Market

July 2023

REP-GB-1009

404 pages

Technology

Security Cameras (IR Illuminator) Market

June 2023

REP-GB-17380

315 pages

Explore Technology Insights

View Reports
Future Market Insights

Multispectral Camera Market

Schedule a Call