Reports

- Global Locations -

Headquarters

Future Market Insights, Inc.

Christiana Corporate, 200
Continental Drive, Suite 401,
Newark, Delaware - 19713,
United States

T: +1-845-579-5705

Americas

Future Market Insights, Inc.

616 Corporate Way, Suite 2-9018,
Valley Cottage, NY 10989, United States

T: +1-347-918-3531

MEA

Future Market Insights

1602-6 Jumeirah Bay X2 Tower, Plot No: JLT-PH2-X2A,
Jumeirah Lakes Towers, Dubai,
United Arab Emirates

Europe

Future Market Insights

3rd Floor, 207 Regent Street,
W1B 3HH London
United Kingdom

T: + 44 (0) 20 8123 9659
D: +44 (0) 20 3287 4268

Asia Pacific

Future Market Insights

IndiaLand Global Tech Park, Unit UG-1, Behind Grand HighStreet, Phase 1, Hinjawadi, MH, Pune – 411057, India

Static VAR Compensator Market Outlook from 2024 to 2034

As the world navigates the complexities of ever-growing electricity demand, the importance of technologies like static VAR compensators (SVCs) is increasing significantly. These compensators are widely used to maintain grid stability and efficiency, resulting in their demand growing at a CAGR of 5.0% through 2034.

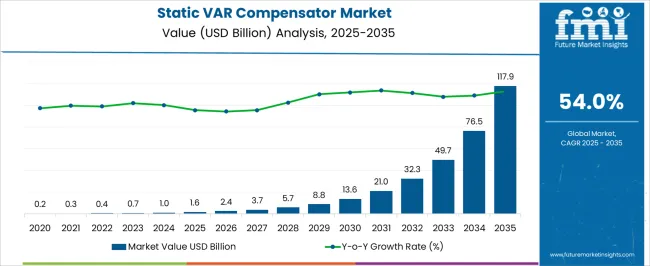
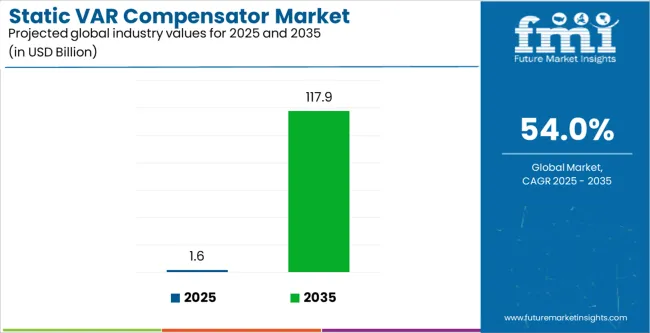
The rise of renewable energy is providing an additional boon to the SVC industry, with Future Market Insights’ analysts estimating the total market value to reach US$ 1,667.0 million by 2034, up from US$ 1,020.2 million in 2024. Sales of static VAR compensators (SVCs) totaled US$ 974.4 million in 2023.

Although solar and wind power are excellent clean energy sources, their output can be variable, prompting companies to install SVCs. This is because these compensators can help smooth out these fluctuations and ensure a more consistent electricity flow.

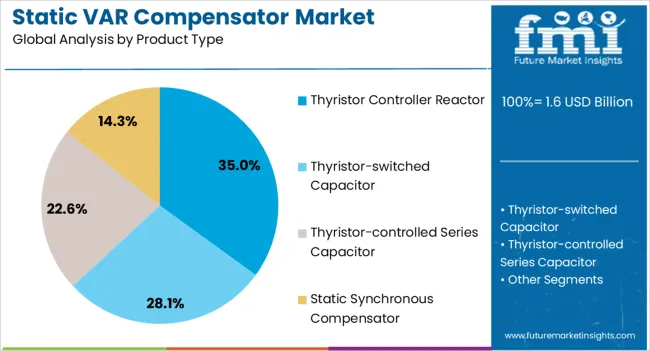
Currently, thyristor controller reactors dominate the market, accounting for a prominent volume share of 41.1% in 2024. However, demand for static synchronous compensators is predicted to grow at a higher CAGR of 5.1% during the assessment period.

Global Static VAR Compensator Market Forecast

Attributes Key Insights
Base Market Value (2023) US$ 974.4 million
Market Value in 2024 US$ 1,020.2 million
Global Static VAR Compensator Market Size in 2034 US$ 1,667.0 million
Value-based CAGR (2024 to 2034) 5.0%
Collective Value Share: Top 5 Countries (2024E) 54.0%

Don't pay for what you don't need

Customize your report by selecting specific countries or regions and save 30%!

Key SVC Market Highlights

  • Market to Grow Nearly 1.6X through 2034

The global static VAR compensator industry is forecast to grow around 1.6X through 2034. This can be attributed to the growing integration of renewable energy sources into power grids, increasing investments in upgrading aging infrastructure for enhanced efficiency, and escalating awareness of the importance of power quality and stability.

Government initiatives aimed at promoting clean energy and improving grid reliability will also positively impact static VAR compensator sales. By 2034, the total market revenue is set to reach US$ 1,667.0 million.

  • East Asia to Remain Hotbed for Static VAR Compensator Manufacturers

As per the latest analysis, East Asia is anticipated to retain its dominance in the global market during the assessment period. It is set to hold around 28.5% of the global static VAR compensator market share in 2034. This is attributed to several factors.

China’s rapid industrialization and urbanization have increased its energy demand. SVCs play an important role in providing grid stability and energy efficiency in these increasing demands, leading to their adoption in various industries.

The government of China is actively investing to upgrade its electricity grid and promote clean energy initiatives. Policies aimed at improving energy efficiency and reducing carbon emissions are encouraging the use of standardized VAR compensators, thus furthering market growth.

China is one of the world’s leading investors in renewable energy. Integrating renewable energies such as wind and solar into the grid requires sophisticated energy efficiency solutions, where SVCs prove to be of great value.

SVC Market Overview

SVCs are becoming essential solutions for maintaining grid stability and efficiency and ensuring reliable electricity supplies. These devices are widely used in electrical systems to rapidly control reactive power on high-voltage transmission networks.

SVCs are used for various purposes, such as voltage regulation, power factor correction, and grid stabilization, serving different industrial and utility needs. The need for SVCs to support the assimilation of renewable energy into the grid is set to rise due to the worldwide shift to renewable energy sources.

Concerns like grid instability due to load changes and renewable energy sources with fluctuating availability would propel the use of SVCs. Increasing investments by nations like India and Brazil in upgrading their power infrastructure to fulfill growing power needs will boost market growth.

Increasing government initiatives geared toward improving grid reliability and integrating renewable power sources will create lucrative opportunities for manufacturers. The growing adoption of electrical automobiles and the electrification of industries are other factors spurring sales growth.

Nikhil Kaitwade
Nikhil Kaitwade

Principal Consultant

Talk to Analyst

Find your sweet spots for generating winning opportunities in this market.

Historical Performance Vs. Future Static VAR Compensator Market Analysis

Global sales of SVCs grew at a CAGR of 2.3% between 2019 and 2023, with total market revenue reaching about US$ 974.4 million in 2023. In the forecast period, the worldwide SVC industry is set to progress at a CAGR of 5.0%, indicating a 2.7% spike from the historical growth rate.

Historical CAGR (2019 to 2023) 2.3%
Forecast CAGR (2024 to 2034) 5.0%

During the historical period, the global SVC market recorded slow growth. This was mostly due to economic uncertainties, slower adoption of renewable energy, limited infrastructure investments, and conservative spending patterns in the power sector.

Looking forward, the market is anticipated to advance at a steady CAGR, totaling a valuation of US$ 1,667.0 million by 2034. The future of the SVC market lies in its integration with smart grid technology.

By using advanced monitoring and control capabilities, SVCs can dynamically respond to grid conditions, optimize power flow, and enhance system reliability and efficiency. This integration will enable utilities to manage the complexities of modern power grids better, accommodate increasing renewable energy penetration, and mitigate grid congestion issues.

Emerging economies present significant growth opportunities for the SVC market. Countries like India, China, and Brazil are witnessing rapid urbanization, industrialization, and infrastructure development, leading to increased demand for electricity and greater strain on power grids.

As these emerging nations invest in upgrading their power infrastructure and integrating renewable energy sources, there will be a growing need for SVCs to ensure grid stability, optimize power quality, and support the efficient transmission of electricity. Hence, a steady CAGR has been predicted for the target industry from 2024 to 2034

Key Market Dynamics

  • Increasing Power Demand Set to Boost Market Growth

The global surge in electricity demand, particularly in developing regions, serves as a pivotal factor propelling the adoption of advanced technologies such as SVCs. This escalating demand stems from a multifaceted landscape of factors, including population growth, rapid urbanization, and increasing industrialization.

As societies embrace technological advances and elevate their standards of living, the reliance on electrical power becomes more pronounced. This, in turn, is intensifying the strain on existing power infrastructure, creating room for electronic devices like SVCs.

The imperative for enhanced power quality and grid stability emerges as a direct consequence of this escalating demand. SVCs play a crucial role in meeting these challenges by dynamically regulating reactive power, thereby maintaining grid stability and voltage levels.

The SVC technology proves instrumental in mitigating power fluctuations, reducing the risk of outages, and ensuring a reliable and consistent power supply. Consequently, as nations strive to meet the burgeoning energy needs of their populations, the adoption of SVCs stands out as an indispensable solution to fortify power systems.

  • Upgrading Aging Infrastructure Creating Growth Opportunities

Aging power infrastructure is another prominent factor creating opportunities for the global SVC industry. As power systems across various regions continue to age, the imperative for upgrades becomes increasingly apparent.

The conventional power infrastructure, marked by outdated technologies and equipment, often struggles to meet the growing demands of modern societies. In response to this challenge, utilities and governments globally are investing in comprehensive upgrades to enhance the efficiency, reliability, and performance of existing power grids.

SVCs emerge as a crucial solution within this context. These devices offer dynamic reactive power compensation, addressing voltage fluctuations and power quality issues prevalent in aging grids.

By installing SVCs, utilities can significantly improve the stability and reliability of their power distribution systems. The capability of SVCs to regulate voltage levels and mitigate grid instabilities positions them as indispensable components in the modernization initiatives aimed at rejuvenating aging power infrastructures.

The aging power infrastructure factor underscores the transformative role that SVCs play in revitalizing grids. These devices help companies in ensuring that they meet the evolving demands of a technologically advancing world while maintaining optimal efficiency and reliability.

Get the data you need at a Fraction of the cost

Personalize your report by choosing insights you need
and save 40%!

Emerging Opportunities in Static VAR Compensator Sector

  • Rise in Grid Modernization Initiatives Augmenting Growth

Grid modernization initiatives play a pivotal role in shaping the global SVC market. Governments and utilities are proactively investing in transformative grid modernization projects with the overarching goal of augmenting the efficiency, reliability, and stability of power systems. This strategic initiative reflects a response to the evolving needs of contemporary societies and the imperative to accommodate a burgeoning demand for electricity.

The compensators find themselves seamlessly integrated into these forward-looking modernization endeavors. As essential components of smart grid solutions, SVCs contribute to the optimization of power flow, voltage control, and grid stability. Their ability to dynamically regulate reactive power enhances the resilience of power systems in the face of changing demands and unforeseen fluctuations.

Under the banner of grid modernization, SVCs emerge as instrumental tools in fortifying power infrastructures against challenges such as voltage variations and instability. As governments and utilities globally embark on these initiatives, the adoption of SVCs underscores their commitment to ushering in a new era of technologically advanced, reliable, and efficient power distribution systems.

The synergy between grid modernization initiatives and SVC deployment exemplifies a strategic alliance focused on the future-proofing of power grids. Thus, increasing grid modernization initiatives will eventually propel demand through 2034.

Key Factors Restraining Static VAR Compensator Market Growth

  • High Initial Costs as a Barrier to Wide-scale Adoption of SVCs

The formidable challenge of high initial costs stands as a notable restraint in the widespread adoption of SVCs. The installation of these sophisticated systems involves a substantial upfront investment, encompassing equipment procurement, engineering, and installation expenses. This financial barrier proves particularly significant for utilities and industries operating within regions marked by stringent budget constraints.

For many entities, especially in developing economies, allocating substantial funds for SVC implementation might be a formidable hurdle. The capital-intensive nature of these projects can lead to hesitancy or delays in decision-making processes. Similarly, growing popularity of STATCOM may limit market growth.

The impact of high initial costs extends beyond mere affordability; it directly influences the pace and scale of SVC integration into power systems. As organizations carefully weigh the financial implications against the anticipated benefits, the market may witness slower adoption rates, inhibiting the realization of SVCs' potential in enhancing power quality and grid stability.

Overcoming cost restraint necessitates strategic financial planning, innovative financing models, and advocacy for the long-term benefits that SVCs bring to the reliability and efficiency of power infrastructures. Thus, companies need to focus on these remedies to counter market barriers.

Overview of Adjacent Markets

The section comprehensively evaluates three interrelated markets: the global SVC market, the power quality equipment industry, and the global compact power equipment rental market.

It dissects the distinctive characteristics of each market, encompassing their respective CAGRs and market values in 2024 while delving into the pivotal factors that influence their growth trajectories.

Examining these interconnected sectors can offer a more profound understanding that can be valuable in crafting distinct and differentiating strategies for pursuing growth and seizing opportunities within the SVC market.

Global Static VAR Compensator Market Analysis:

Attributes Global SVC Market Analysis
CAGR (2024 to 2034) 5.0%
Growth Factor Empowering renewable energy integration with SVCs for grid stability.
Key Trend Increasing focus on sustainable energy solutions.

Global Power Quality Equipment Market Outlook:

Attributes Power Quality Equipment Industry Analysis
CAGR (2024 to 2034) 6.2%
Growth Factor High adoption of power-quality equipment in industrial, commercial, and residential sectors.
Key Trend Transition towards renewable energy sources.

Compact Power Equipment Rental Market Forecast:

Attributes Compact Power Equipment Rental Market
CAGR (2024 to 2034) 6.4%
Growth Factor Growing construction and infrastructure transformation projects across all industry verticals.
Key Trend Development of new compact power equipment tools.

Country-wise Insights

The table below highlights key countries’ market revenues. China, the United States, and Japan are set to remain the top three consumers of VAR compensators, with projected valuations of US$ 257.8 million, US$ 169.8 million, and US$ 150.4 million, respectively, in 2034.

Countries Static VAR Compensator Market Revenue (2034)
China US$ 257.8 million
United States US$ 169.8 million
Japan US$ 150.4 million
India US$ 140.9 million
Poland US$ 140.7 million

The table below shows the estimated growth rates of the top five countries. Italy, Mexico, and KSA are set to record high CAGRs of 6.9%, 6.2%, and 6.1%, respectively, through 2034.

Countries SVC Market CAGR (2024 to 2034)
Italy 6.9%
Mexico 6.2%
KSA 6.1%
Czech Republic 6.1%
Canada 5.9%
Hungary 5.8%

China's Renewable Energy and Grid Modernization Initiatives Fueling Growth

When it comes to SVC adoption, China leads from the forefront. This is attributable to factors like increasing grid modernization initiatives, booming renewable energy sector, and strong presence of leading SVC manufacturers.

As per the latest analysis, China is set to record steady growth, with total market size reaching US$ 257.8 million by 2034. Over the next ten years, demand for static VAR compensators in China is predicted to rise at 3.8% CAGR.

China’s ambitious renewable energy targets and rapidly developing technology are increasing demand for SVCs. China’s renewables reached around 31.7% of total energy consumption, and the trend is set to escalate further, requiring robust grid stabilization plans. These insights highlight the potential of China as the largest market for SVCs.

The country’s massive investment in renewable energy and infrastructure, with escalating demand for electricity, is also increasing the need for SVC and other advanced energy management solutions. This will further boost market growth through 2034.

Recent government policies, such as the Renewable Energy Law, emphasize sustainable energy development and grid modernization. Prominent factors such as rapid urbanization, technological advances, and government policies will continue to contribute to making China a larger market.
United States to Remain an Attractive SVC Market Through 2034

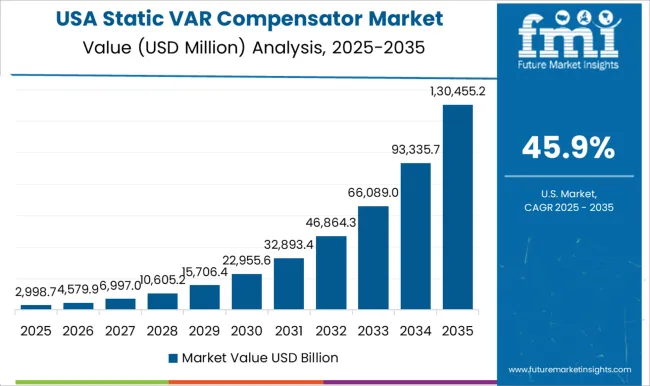
The growth of the market in the United States can be attributed to several key factors. First, the nation has a well-established and advanced electricity grid, which requires energy efficiency and produces very stable electricity. This demand is further compounded by renewable energy sources such as coupling solar and wind to electricity.

The United States market growth is also propelled by greater integration of renewable energy and grid modernization programs in states such as California and Texas. Similarly, high adoption of electric vehicles is prompting utilities to invest in SVC technology.

A supportive regulatory framework and government policies play an important role in promoting market development. Policies aimed at promoting clean energy and energy efficiency to incentivize companies will also encourage companies to invest in SVC technologies.

Sales of static VAR compensators in the United States are projected to soar at a CAGR of around 5.4% during the assessment period. Total valuation in the nation will reach around US$ 169.8 million by 2034.

Category-wise Insights

The section below shows the thyristor controller reactor segment dominating the industry, recording a CAGR of 4.7% through 2034. Based on end-use industry, the energy utilities segment is predicted to grow at 4.7% CAGR during the forecast period.

Thyristor Controller Reactor Remains Highly Sought-after Product

Top Segment (Product Type) Thyristor Controller Reactor
CAGR (2024 to 2034) 4.7%

The thyristor controller reactor segment stands out as a key segment in the global SVC market for several reasons. The reason for its widespread adoption is its ability to provide accurate and dynamic reactive power compensation, making it highly effective in voltage regulation and power factor correction applications in various industries.

Thyristor controller reactors provide excellent reliability and stable performance, allowing the grid to operate even more stable under varying load conditions. This reliability factor is essential for industries where uninterrupted power supply is essential, such as manufacturing and utilities.

Advances in thyristor technology have favored thyristor-controlled reactors over other types. The capability of thyristor-controlled reactors to operate in both capacitive and inductive modes gives them versatility and application potential in different grid conditions continues to increase.

Thyristor controller reactors are also more cost-effective than other product types. As a result, the target segment is anticipated to account for a significant volume share of 41.1% in 2024. On the other hand, demand for static synchronous compensators is forecast to rise at a CAGR of 5.1%.

SVC Adoption Remains High in Energy Utilities

Top Segment (End-use Industry) Energy Utilities
CAGR (2024 to 2034) 4.7%

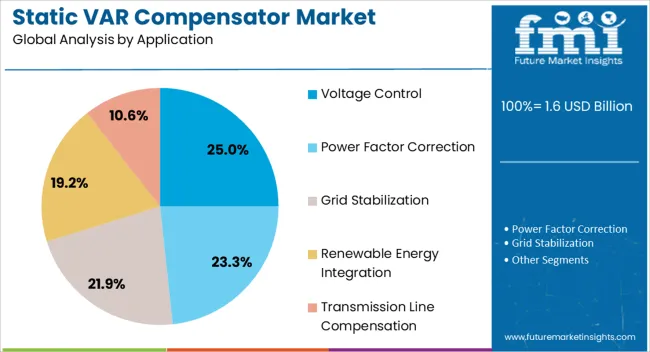
Demand for static VAR compensators remains high among energy utilities due to several factors. SVCs play a crucial role in voltage control, power factor correction, and grid stabilization, ensuring reliable and stable electricity supply to consumers.

Energy utilities rely on SVCs to manage voltage fluctuations, optimize power factors, and enhance grid stability, especially in regions with high renewable energy penetration. As a result, their adoption is growing significantly in energy utilities.

The increasing integration of renewable energy sources into the grid poses challenges in maintaining grid stability, which necessitates the deployment of SVCs by energy utilities. SVCs help utilities manage the variability of renewable energy generation and ensure smooth integration into the grid.

Aging power infrastructure and increasing electricity demand create the need for SVCs to modernize grids and improve system efficiency. As energy utilities strive to enhance grid reliability and efficiency, the demand for SVCs is set to remain robust in the foreseeable future.

As per the latest analysis, the energy utilities segment is projected to progress at 4.7% CAGR during the forecast period. It is set to attain a valuation of US$ 402.8 million by 2034.

Competitive Landscape

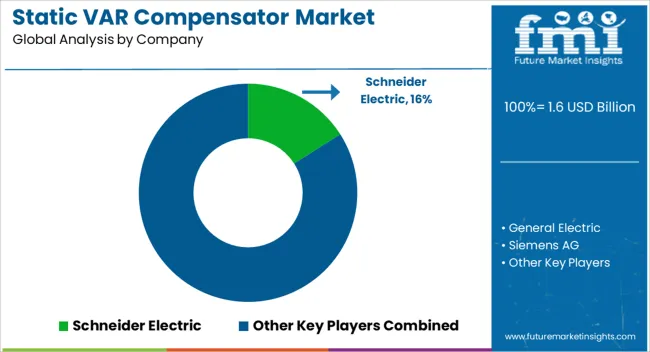
The global static VAR compensator market is fragmented, with leading players accounting for about 40% to 45% share. Schneider Electric, General Electric, Siemens AG, Mitsubishi Electric Corporation, ABB, Emerson Electric Co, Hyosung Corporation, Fuji Electric, NR Electric Co., Ltd., Nissin Electric Co., Ltd., S&C Electric Company, American Superconductor Corp., NR Electric Co., Ltd., and Merus Power Dynamics Oy are the leading manufacturers and suppliers of SVC listed in the report.

Key companies are investing in continuous research to develop new products with improved efficiency and reliability. They are also looking to offer innovative solutions that can integrate with renewable energy sources like solar and wind power. Similarly, strategies like acquisitions, new facility establishments, partnerships, and mergers are becoming popular as companies look to strengthen their footprint.

Recent Developments in Static VAR Compensator (SVC) Market

  • In January 2022, Germany-based Siemens and Nova Scotia Power (NSP) agreed to conduct a joint project to develop and demonstrate smart grid technology to manage the provinces´ electricity better and reduce greenhouse gas emissions.
  • In 2022, Japan-based Mitsubishi Electric Corporation launched three new Large DIPIPM+TM transfer-mold intelligent power modules.

Key Coverage in Global Static VAR Compensator Market Research Report

  • Market Analysis of Static VAR Compensator Deployment in Utility and Industrial Sectors
  • Trends in Static VAR Compensator Technology for Voltage Stability and Power Quality Improvement
  • Market Forecast for Static VAR Compensator Industry by Region and Application
  • Impact of Renewable Energy Integration and Grid Modernization on Static VAR Compensator Market
  • Market Dynamics Influencing the Adoption of Static VAR Compensators in Power Transmission Networks
  • Industry Growth Factors for Reactive Power Compensation Equipment
  • Analysis of Key Players and their Product Offerings in the Static VAR Compensator Market
  • Evaluation of Customer Preferences and Buying Behavior in the Power Quality Equipment Sector
  • Market Share of Static VAR Compensator Manufacturers
  • Technological Advancements and Innovations Driving the Static VAR Compensator Market
  • Top Players in Static VAR Compensator Production Sector
  • Reactive Power Compensation Sector Trends in the United States
  • Market Research on Pricing Strategies and Cost Factors Affecting Static VAR Compensator Procurement
  • Competitive Landscape in Power Quality Equipment Market
  • Opportunities for Market Expansion and Diversification in the Static VAR Compensator Industry

Scope of the Report

Attribute Details
Market Size (2024) US$ 1,020.2 million
Market Size (2034) US$ 1,667.0 million
Growth Rate (2024 to 2034) 5.0% CAGR
Historical Data 2019 to 2023
Forecast Period 2024 to 2034
Quantitative Units Value (US$ million) and Volume (Units)
Report Coverage Revenue Forecast, Volume Forecast, Company Ranking, Competitive Landscape, Growth Factors, Trends, and Pricing Analysis
Market Segments Covered
  • Voltage Level
  • Product Type
  • Application
  • End-use Industry
  • Region
Regions Covered
  • North America
  • Latin America
  • Western Europe
  • Eastern Europe
  • East Asia
  • South Asia Pacific
  • Middle East & Africa
Key Countries Covered
  • United States
  • Canada
  • Mexico
  • Brazil
  • Germany
  • Italy
  • France
  • United Kingdom
  • Spain
  • BENELUX
  • NORDICS
  • Poland
  • Hungary
  • Balkan and Baltics
  • Russia
  • India
  • Association of Southeast Asian Nations
  • Australia and New Zealand
  • China
  • Japan
  • South Korea
  • Kingdom of Saudi Arabia
  • Other GCC Countries
  • Türkiye
  • Other African Union
  • South Africa
Key Companies Profiled
  • Schneider Electric
  • General Electric
  • Siemens AG
  • Mitsubishi Electric Corporation
  • ABB
  • Emerson Electric Co
  • Hyosung Corporation
  • Fuji Electric
  • NR Electric Co., Ltd.
  • Nissin Electric Co., Ltd.
  • S&C Electric Company
  • American Superconductor Corp.
  • NR Electric Co., Ltd.
  • Merus Power Dynamics Oy

Market Segmentation of Static VAR Compensator Products

By Voltage Level:

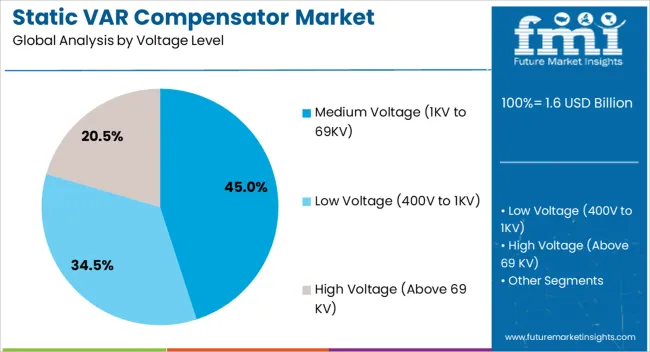
  • Low Voltage (400V to 1KV)
  • Medium Voltage (1KV to 69KV)
  • High Voltage (Above 69 KV)

By Product Type:

  • Thyristor Controller Reactor
  • Thyristor-switched Capacitor
  • Thyristor-controlled Series Capacitor
  • Static Synchronous Compensator

By Application:

  • Voltage Control
  • Power Factor Correction
  • Grid Stabilization
  • Renewable Energy Integration
  • Transmission Line Compensation

By End-use Industry:

  • Power Generation
  • Renewable
  • Non-renewable
  • Energy Utilities
  • Electric Traction
  • Mining and Metal
  • Oil and Gas
  • Textile
  • Cement
  • Others

By Region:

  • North America
  • Latin America
  • Western Europe
  • Eastern Europe
  • East Asia
  • South Asia Pacific
  • Middle East & Africa

Frequently Asked Questions

What was the value of the global market in 2023?

The global market was valued at US$ 974.4 million in 2023.

How big is the global market?

The global market value is set to reach US$ 1,020.2 million in 2024.

At what rate will the global demand rise through 2034?

Global demand is anticipated to rise at 5.0% CAGR.

What is the projected market size in 2034?

The global static VAR compensator market size is set to reach US$ 1,667.0 million by 2034.

Which product type segment is forecast to lead the market?

Thyristor controller reactor segment is set to dominate the market.

Table of Content

1. Executive Summary

    1.1. Global Market Outlook

    1.2. Demand Side Trends

    1.3. Supply Side Trends

    1.4. Analysis and Recommendations

2. Market Overview

    2.1. Market Coverage / Taxonomy

    2.2. Market Definition / Scope / Limitations

3. Key Market Trends

    3.1. Key Trends Impacting the Market

    3.2. Product Innovation / Development Trends

4. Key Success Factors

    4.1. Product Adoption / Usage Analysis

    4.2. Product USP’s / Features

    4.3. Strategic Promotional Strategies

5. Global Market Demand Analysis 2019 to 2023 and Forecast, 2024 to 2034

    5.1. Historical Market Volume (Units) Analysis, 2019 to 2023

    5.2. Current and Future Market Volume (Units) Projections, 2024 to 2034

    5.3. Y-o-Y Growth Trend Analysis

6. Global Market - Pricing Analysis

    6.1. Regional Pricing Analysis By Voltage Level

    6.2. Global Average Pricing Analysis Benchmark

7. Global Market Demand (in Value or Size in US$ Million) Analysis 2019 to 2023 and Forecast, 2024 to 2034

    7.1. Historical Market Value (US$ million) Analysis, 2019 to 2023

    7.2. Current and Future Market Value (US$ million) Projections, 2024 to 2034

        7.2.1. Y-o-Y Growth Trend Analysis

        7.2.2. Absolute $ Opportunity Analysis

8. Market Background

    8.1. Macro-Economic Factors

        8.1.1. Share of World Electric Generation Overview

        8.1.2. Global Primary Energy Consumption By Source in TWh (terawatt-hours) Outlook

        8.1.3. Global Energy Consumption Overview

        8.1.4. Global Real GDP Growth Outlook

        8.1.5. Global Economic Outlook

        8.1.6. Global Oil & Gas Consumption Forecast Outlook

        8.1.7. Global Textile Industry Overview

    8.2. Forecast Factors - Relevance & Impact

        8.2.1. Renewable Energy Capacity Growth

        8.2.2. Grid Expansion and Modernization Projects

        8.2.3. Government Policies and Regulations

        8.2.4. Technological Advancements

        8.2.5. Energy Storage System Deployments

        8.2.6. Industrialization and Urbanization Trends

        8.2.7. Demand for Power Quality Solutions

        8.2.8. Smart Grid Deployments

    8.3. Value Chain

        8.3.1. Product Manufacturers

        8.3.2. End-use Industry

        8.3.3. Avg. Profitability Margins

    8.4. COVID-19 Crisis – Impact Assessment

        8.4.1. Current Statistics

        8.4.2. Short-Mid-Long Term Outlook

        8.4.3. Likely Rebound

    8.5. Market Dynamics

        8.5.1. Drivers

        8.5.2. Restraints

        8.5.3. Opportunity Analysis

    8.6. PESTLE Analysis

    8.7. Patent Analysis

9. Global Market Analysis 2019 to 2023 and Forecast 2024 to 2034, by Region

    9.1. Global Market CAGR Variance Analysis, By Value (%)

    9.2. Global Market Forecast CAGR Analysis, By Value (%)

    9.3. Global Market Size (US$ million), Volume (Units), and Absolute $ Opportunity (US$ million), YOY Growth 2019 to 2034 by Region

    9.4. Global Market Volume (Units) & Value Share (%) Historical & Forecast Analysis by Region

        9.4.1. North America

        9.4.2. Latin America

        9.4.3. East Asia

        9.4.4. South Asia Pacific

        9.4.5. Western Europe

        9.4.6. Eastern Europe

        9.4.7. Middle East and Africa

    9.5. Market Attractiveness Analysis By Region

10. Global Market Analysis 2019 to 2023 and Forecast 2024 to 2034, By Voltage Level

    10.1. Global Market CAGR Variance Analysis, By Value (%)

    10.2. Global Market Forecast CAGR Analysis, By Value (%)

    10.3. Global Market Size (US$ million), Volume (Units), and Absolute $ Opportunity (US$ million), YOY Growth 2019 to 2034 by Voltage Level

    10.4. Global Market Volume (Units) & Value Share (%) Historical & Forecast Analysis by Voltage Level

        10.4.1. Low Voltage (400V to 1KV)

        10.4.2. Medium Voltage (1KV to 69KV)

        10.4.3. High Voltage (Above 69 KV)

    10.5. Market Attractiveness Analysis By Voltage Level

11. Global Market Analysis 2019 to 2023 and Forecast 2024 to 2034, By Product Type

    11.1. Global Market CAGR Variance Analysis, By Value (%)

    11.2. Global Market Forecast CAGR Analysis, By Value (%)

    11.3. Global Market Size (US$ million), Volume (Units), and Absolute $ Opportunity (US$ million), YOY Growth 2019 to 2034 by Product Type

    11.4. Global Market Volume (Units) & Value Share (%) Historical & Forecast Analysis by Product Type

        11.4.1. Thyristor Controller Reactor

        11.4.2. Thyristor-switched Capacitor

        11.4.3. Thyristor-controlled Series Capacitor

        11.4.4. Static Synchronous Compensator

    11.5. Market Attractiveness Analysis By Product Type

12. Global Market Analysis 2019 to 2023 and Forecast 2024 to 2034, By Application 

    12.1. Global Market CAGR Variance Analysis, By Value (%)

    12.2. Global Market Forecast CAGR Analysis, By Value (%)

    12.3. Global Market Size (US$ million), Volume (Units), and Absolute $ Opportunity (US$ million), YOY Growth 2019 to 2034 by Application 

    12.4. Global Market Volume (Units) & Value Share (%) Historical & Forecast Analysis by Application

        12.4.1. Voltage Control

        12.4.2. Power Factor Correction

        12.4.3. Grid Stabilization

        12.4.4. Renewable Energy Integration

        12.4.5. Transmission Line Compensation

    12.5. Market Attractiveness Analysis By Application

13. Global Market Analysis 2019 to 2023 and Forecast 2024 to 2034, By End-use Industry

    13.1. Global Market CAGR Variance Analysis, By Value (%)

    13.2. Global Market Forecast CAGR Analysis, By Value (%)

    13.3. Global Market Size (US$ million), Volume (Units), and Absolute $ Opportunity (US$ million), YOY Growth 2019 to 2034 by End-use Industry

    13.4. Global Market Volume (Units) & Value Share (%) Historical & Forecast Analysis by End-use Industry

        13.4.1. Power Generation

            13.4.1.1. Renewable

            13.4.1.2. Non-renewable

        13.4.2. Energy Utilities

        13.4.3. Electric Traction

        13.4.4. Mining and Metal

        13.4.5. Oil and Gas

        13.4.6. Textile

        13.4.7. Cement

        13.4.8. Others

    13.5. Market Attractiveness Analysis By End-use Industry

14. North America Market Analysis 2019 to 2023 and Forecast 2024 to 2034

    14.1. North America Market CAGR Variance Analysis, By Value (%)

    14.2. North America Market Forecast CAGR Analysis, By Value (%)

    14.3. North America Market Size (US$ million), Volume (Units), and Absolute $ Opportunity (US$ million), YOY Growth 2019 to 2034

    14.4. North America Market Volume (Units) & Value Share (%) Historical & Forecast Analysis

        14.4.1. By Country

            14.4.1.1. United States

            14.4.1.2. Canada

            14.4.1.3. Mexico

        14.4.2. By Voltage Level

        14.4.3. By Product Type

        14.4.4. By Application

        14.4.5. By End-use Industry

    14.5. Market Attractiveness Analysis

        14.5.1. By Country

        14.5.2. By Voltage Level

        14.5.3. By Product Type

        14.5.4. By Application

        14.5.5. By End-use Industry

    14.6. Market Trends

15. Latin America Market Analysis 2019 to 2023 and Forecast 2024 to 2034

    15.1. Latin America Market CAGR Variance Analysis, By Value (%)

    15.2. Latin America Market Forecast CAGR Analysis, By Value (%)

    15.3. Latin America Market Size (US$ million), Volume (Units), and Absolute $ Opportunity (US$ million), YOY Growth 2019 to 2034

    15.4. Latin America Market Volume (Units) & Value Share (%) Historical & Forecast Analysis

        15.4.1. By Country

            15.4.1.1. Brazil

            15.4.1.2. Chile

            15.4.1.3. Rest of Latin America

        15.4.2. By Voltage Level

        15.4.3. By Product Type

        15.4.4. By Application

        15.4.5. By End-use Industry

    15.5. Market Attractiveness Analysis

        15.5.1. By Country

        15.5.2. By Voltage Level

        15.5.3. By Product Type

        15.5.4. By Application

        15.5.5. By End-use Industry

    15.6. Market Trends

16. Western Europe Market Analysis 2019 to 2023 and Forecast 2024 to 2034

    16.1. Western Europe Market CAGR Variance Analysis, By Value (%)

    16.2. Western Europe Market Forecast CAGR Analysis, By Value (%)

    16.3. Western Europe Market Size (US$ million), Volume (Units), and Absolute $ Opportunity (US$ million), YOY Growth 2019 to 2034

    16.4. Western Europe Market Volume (Units) & Value Share (%) Historical & Forecast Analysis

        16.4.1. By Country

            16.4.1.1. Germany

            16.4.1.2. Italy

            16.4.1.3. France

            16.4.1.4. United Kingdom

            16.4.1.5. Spain

            16.4.1.6. BENELUX

            16.4.1.7. NORDICS

            16.4.1.8. Rest of W. Europe

        16.4.2. By Voltage Level

        16.4.3. By Product Type

        16.4.4. By Application

        16.4.5. By End-use Industry

    16.5. Market Attractiveness Analysis

        16.5.1. By Country

        16.5.2. By Voltage Level

        16.5.3. By Product Type

        16.5.4. By Application

        16.5.5. By End-use Industry

    16.6. Market Trends

17. Eastern Europe Market Analysis 2019 to 2023 and Forecast 2024 to 2034

    17.1. Eastern Europe Market CAGR Variance Analysis, By Value (%)

    17.2. Eastern Europe Market Forecast CAGR Analysis, By Value (%)

    17.3. Eastern Europe Market Size (US$ million), Volume (Units), and Absolute $ Opportunity (US$ million), YOY Growth 2019 to 2034

    17.4. Eastern Europe Market Volume (Units) & Value Share (%) Historical & Forecast Analysis

        17.4.1. By Country

            17.4.1.1. Russia

            17.4.1.2. Poland

            17.4.1.3. Hungary

            17.4.1.4. Balkan & Baltics

            17.4.1.5. Rest of E. Europe

        17.4.2. By Voltage Level

        17.4.3. By Product Type

        17.4.4. By Application

        17.4.5. By End-use Industry

    17.5. Market Attractiveness Analysis

        17.5.1. By Country

        17.5.2. By Voltage Level

        17.5.3. By Product Type

        17.5.4. By Application

        17.5.5. By End-use Industry

    17.6. Market Trends

18. East Asia Market Analysis 2019 to 2023 and Forecast 2024 to 2034

    18.1. East Asia Market CAGR Variance Analysis, By Value (%)

    18.2. East Asia Market Forecast CAGR Analysis, By Value (%)

    18.3. East Asia Market Size (US$ million), Volume (Units), and Absolute $ Opportunity (US$ million), YOY Growth 2019 to 2034

    18.4. East Asia Market Volume (Units) & Value Share (%) Historical & Forecast Analysis

        18.4.1. By Country

            18.4.1.1. China

            18.4.1.2. Japan

            18.4.1.3. South Korea

        18.4.2. By Voltage Level

        18.4.3. By Product Type

        18.4.4. By Application

        18.4.5. By End-use Industry

    18.5. Market Attractiveness Analysis

        18.5.1. By Country

        18.5.2. By Voltage Level

        18.5.3. By Product Type

        18.5.4. By Application

        18.5.5. By End-use Industry

    18.6. Market Trends

19. South Asia Pacific Market Analysis 2019 to 2023 and Forecast 2024 to 2034

    19.1. South Asia Pacific Market CAGR Variance Analysis, By Value (%)

    19.2. South Asia Pacific Market Forecast CAGR Analysis, By Value (%)

    19.3. South Asia Pacific Market Size (US$ million), Volume (Units), and Absolute $ Opportunity (US$ million), YOY Growth 2019 to 2034

    19.4. South Asia Pacific Market Volume (Units) & Value Share (%) Historical & Forecast Analysis

        19.4.1. By Country

            19.4.1.1. India

            19.4.1.2. ASEAN

            19.4.1.3. ANZ

            19.4.1.4. Rest of South Asia & Pacific

        19.4.2. By Voltage Level

        19.4.3. By Product Type

        19.4.4. By Application

        19.4.5. By End-use Industry

    19.5. Market Attractiveness Analysis

        19.5.1. By Country

        19.5.2. By Voltage Level

        19.5.3. By Product Type

        19.5.4. By Application

        19.5.5. By End-use Industry

    19.6. Market Trends

20. Middle East and Africa Market Analysis 2019 to 2023 and Forecast 2024 to 2034

    20.1. Middle East Africa Market CAGR Variance Analysis, By Value (%)

    20.2. Middle East Africa Market Forecast CAGR Analysis, By Value (%)

    20.3. Middle East Africa Market Size (US$ million), Volume (Units), and Absolute $ Opportunity (US$ million), YOY Growth 2019 to 2034

    20.4. Middle East Africa Market Volume (Units) & Value Share (%) Historical & Forecast Analysis

        20.4.1. By Country

            20.4.1.1. KSA

            20.4.1.2. Other GCC Countries

            20.4.1.3. Türkiye

            20.4.1.4. South Africa

            20.4.1.5. Other African Union

            20.4.1.6. Rest of Middle East & Africa

        20.4.2. By Voltage Level

        20.4.3. By Product Type

        20.4.4. By Application

        20.4.5. By End-use Industry

    20.5. Market Attractiveness Analysis

        20.5.1. By Country

        20.5.2. By Voltage Level

        20.5.3. By Product Type

        20.5.4. By Application

        20.5.5. By End-use Industry

    20.6. Market Trends

21. Country-wise Market Analysis 

    21.1. Introduction

        21.1.1. Market Value Proportion Analysis, By Key Countries

        21.1.2. Global Vs. Country Growth Comparison

    21.2. United States Market Analysis

        21.2.1. By Voltage Level

        21.2.2. By Product Type

        21.2.3. By Application

        21.2.4. By End-use Industry

    21.3. Canada Market Analysis

        21.3.1. By Voltage Level

        21.3.2. By Product Type

        21.3.3. By Application

        21.3.4. By End-use Industry

    21.4. Mexico Market Analysis

        21.4.1. By Voltage Level

        21.4.2. By Product Type

        21.4.3. By Application

        21.4.4. By End-use Industry

    21.5. Brazil Market Analysis

        21.5.1. By Voltage Level

        21.5.2. By Product Type

        21.5.3. By Application

        21.5.4. By End-use Industry

    21.6. Chile Market Analysis

        21.6.1. By Voltage Level

        21.6.2. By Product Type

        21.6.3. By Application

        21.6.4. By End-use Industry

    21.7. China Market Analysis

        21.7.1. By Voltage Level

        21.7.2. By Product Type

        21.7.3. By Application

        21.7.4. By End-use Industry

    21.8. Japan Market Analysis

        21.8.1. By Voltage Level

        21.8.2. By Product Type

        21.8.3. By Application

        21.8.4. By End-use Industry

    21.9. South Korea Market Analysis

        21.9.1. By Voltage Level

        21.9.2. By Product Type

        21.9.3. By Application

        21.9.4. By End-use Industry

    21.10. India Market Analysis

        21.10.1. By Voltage Level

        21.10.2. By Product Type

        21.10.3. By Application

        21.10.4. By End-use Industry

    21.11. ASEAN Market Analysis

        21.11.1. By Voltage Level

        21.11.2. By Product Type

        21.11.3. By Application

        21.11.4. By End-use Industry

    21.12. ANZ Market Analysis

        21.12.1. By Voltage Level

        21.12.2. By Product Type

        21.12.3. By Application

        21.12.4. By End-use Industry

    21.13. Germany Market Analysis

        21.13.1. By Voltage Level

        21.13.2. By Product Type

        21.13.3. By Application

        21.13.4. By End-use Industry

    21.14. Italy Market Analysis

        21.14.1. By Voltage Level

        21.14.2. By Product Type

        21.14.3. By Application

        21.14.4. By End-use Industry

    21.15. France Market Analysis

        21.15.1. By Voltage Level

        21.15.2. By Product Type

        21.15.3. By Application

        21.15.4. By End-use Industry

    21.16. United Kingdom Market Analysis

        21.16.1. By Voltage Level

        21.16.2. By Product Type

        21.16.3. By Application

        21.16.4. By End-use Industry

    21.17. Spain Market Analysis

        21.17.1. By Voltage Level

        21.17.2. By Product Type

        21.17.3. By Application

        21.17.4. By End-use Industry

    21.18. BENELUX Market Analysis

        21.18.1. By Voltage Level

        21.18.2. By Product Type

        21.18.3. By Application

        21.18.4. By End-use Industry

    21.19. NORDICS Market Analysis

        21.19.1. By Voltage Level

        21.19.2. By Product Type

        21.19.3. By Application

        21.19.4. By End-use Industry

    21.20. Russia Market Analysis

        21.20.1. By Voltage Level

        21.20.2. By Product Type

        21.20.3. By Application

        21.20.4. By End-use Industry

    21.21. Poland Market Analysis

        21.21.1. By Voltage Level

        21.21.2. By Product Type

        21.21.3. By Application

        21.21.4. By End-use Industry

    21.22. Hungary Market Analysis

        21.22.1. By Voltage Level

        21.22.2. By Product Type

        21.22.3. By Application

        21.22.4. By End-use Industry

    21.23. Balkan & Baltics Market Analysis

        21.23.1. By Voltage Level

        21.23.2. By Product Type

        21.23.3. By Application

        21.23.4. By End-use Industry

    21.24. KSA Market Analysis

        21.24.1. By Voltage Level

        21.24.2. By Product Type

        21.24.3. By Application

        21.24.4. By End-use Industry

    21.25. Other GCC Countries Market Analysis

        21.25.1. By Voltage Level

        21.25.2. By Product Type

        21.25.3. By Application

        21.25.4. By End-use Industry

    21.26. Türkiye Market Analysis

        21.26.1. By Voltage Level

        21.26.2. By Product Type

        21.26.3. By Application

        21.26.4. By End-use Industry

    21.27. South Africa Market Analysis

        21.27.1. By Voltage Level

        21.27.2. By Product Type

        21.27.3. By Application

        21.27.4. By End-use Industry

22. Market Structure Analysis

    22.1. Market Analysis by Tier of Companies

    22.2. Market Concentration

    22.3. Market Share Analysis of Top Players

23. Competition Analysis

    23.1. Competition Dashboard

    23.2. Competition Benchmarking

    23.3. Competition Deep Dive

        23.3.1. Schneider Electric

            23.3.1.1. Overview

            23.3.1.2. Product Portfolio

            23.3.1.3. Profitability by Market Segments

            23.3.1.4. Sales Footprint

            23.3.1.5. Strategy Overview

        23.3.2. General Electric

        23.3.3. Siemens AG

        23.3.4. Mitsubishi Electric Corporation

        23.3.5. ABB

        23.3.6. Emerson Electric Co

        23.3.7. Hyosung Corporation

        23.3.8. Fuji Electric

        23.3.9. NR Electric Co., Ltd.

        23.3.10. Nissin Electric Co., Ltd.

        23.3.11. S&C Electric Company

        23.3.12. American Superconductor Corp.

        23.3.13. NR Electric Co., Ltd.

        23.3.14. Merus Power Dynamics Oy

24. Assumptions and Acronyms Used

25. Research Methodology

List of Tables

Table 1: Global Market Value (US$ million) Forecast by Region, 2019 & 2034

Table 2: Global Market Volume (Unit) Forecast by Region, 2019 & 2034

Table 3: Global Market Value (US$ million) Forecast by Voltage Level, 2019 & 2034

Table 4: Global Market Volume (Unit) Forecast by Voltage Level, 2019 & 2034

Table 5: Global Market Value (US$ million) Forecast by Product Type, 2019 & 2034

Table 6: Global Market Volume (Unit) Forecast by Product Type, 2019 & 2034

Table 7: Global Market Value (US$ million) Forecast by Application, 2019 & 2034

Table 8: Global Market Volume (Unit) Forecast by Application, 2019 & 2034

Table 9: Global Market Value (US$ million) Forecast by End-use Industry, 2019 & 2034

Table 10: Global Market Volume (Unit) Forecast by End-use Industry, 2019 & 2034

Table 11: North America Market Value (US$ million) Forecast by Country, 2019 & 2034

Table 12: North America Market Volume (Unit) Forecast by Country, 2019 & 2034

Table 13: North America Market Value (US$ million) Forecast by Voltage Level, 2019 & 2034

Table 14: North America Market Volume (Unit) Forecast by Voltage Level, 2019 & 2034

Table 15: North America Market Value (US$ million) Forecast by Product Type, 2019 & 2034

Table 16: North America Market Volume (Unit) Forecast by Product Type, 2019 & 2034

Table 17: North America Market Value (US$ million) Forecast by Application, 2019 & 2034

Table 18: North America Market Volume (Unit) Forecast by Application, 2019 & 2034

Table 19: North America Market Value (US$ million) Forecast by End-use Industry, 2019 & 2034

Table 20: North America Market Volume (Unit) Forecast by End-use Industry, 2019 & 2034

Table 21: Latin America Market Value (US$ million) Forecast by Country, 2019 & 2034

Table 22: Latin America Market Volume (Unit) Forecast by Country, 2019 & 2034

Table 23: Latin America Market Value (US$ million) Forecast by Voltage Level, 2019 & 2034

Table 24: Latin America Market Volume (Unit) Forecast by Voltage Level, 2019 & 2034

Table 25: Latin America Market Value (US$ million) Forecast by Product Type, 2019 & 2034

Table 26: Latin America Market Volume (Unit) Forecast by Product Type, 2019 & 2034

Table 27: Latin America Market Value (US$ million) Forecast by Application, 2019 & 2034

Table 28: Latin America Market Volume (Unit) Forecast by Application, 2019 & 2034

Table 29: Latin America Market Value (US$ million) Forecast by End-use Industry, 2019 & 2034

Table 30: Latin America Market Volume (Unit) Forecast by End-use Industry, 2019 & 2034

Table 31: Western Europe Market Value (US$ million) Forecast by Country, 2019 & 2034

Table 32: Western Europe Market Volume (Unit) Forecast by Country, 2019 & 2034

Table 33: Western Europe Market Value (US$ million) Forecast by Voltage Level, 2019 & 2034

Table 34: Western Europe Market Volume (Unit) Forecast by Voltage Level, 2019 & 2034

Table 35: Western Europe Market Value (US$ million) Forecast by Product Type, 2019 & 2034

Table 36: Western Europe Market Volume (Unit) Forecast by Product Type, 2019 & 2034

Table 37: Western Europe Market Value (US$ million) Forecast by Application, 2019 & 2034

Table 38: Western Europe Market Volume (Unit) Forecast by Application, 2019 & 2034

Table 39: Western Europe Market Value (US$ million) Forecast by End-use Industry, 2019 & 2034

Table 40: Western Europe Market Volume (Unit) Forecast by End-use Industry, 2019 & 2034

Table 41: Eastern Europe Market Value (US$ million) Forecast by Country, 2019 & 2034

Table 42: Eastern Europe Market Volume (Unit) Forecast by Country, 2019 & 2034

Table 43: Eastern Europe Market Value (US$ million) Forecast by Voltage Level, 2019 & 2034

Table 44: Eastern Europe Market Volume (Unit) Forecast by Voltage Level, 2019 & 2034

Table 45: Eastern Europe Market Value (US$ million) Forecast by Product Type, 2019 & 2034

Table 46: Eastern Europe Market Volume (Unit) Forecast by Product Type, 2019 & 2034

Table 47: Eastern Europe Market Value (US$ million) Forecast by Application, 2019 & 2034

Table 48: Eastern Europe Market Volume (Unit) Forecast by Application, 2019 & 2034

Table 49: Eastern Europe Market Value (US$ million) Forecast by End-use Industry, 2019 & 2034

Table 50: Eastern Europe Market Volume (Unit) Forecast by End-use Industry, 2019 & 2034

Table 51: East Asia Market Value (US$ million) Forecast by Country, 2019 & 2034

Table 52: East Asia Market Volume (Unit) Forecast by Country, 2019 & 2034

Table 53: East Asia Market Value (US$ million) Forecast by Voltage Level, 2019 & 2034

Table 54: East Asia Market Volume (Unit) Forecast by Voltage Level, 2019 & 2034

Table 55: East Asia Market Value (US$ million) Forecast by Product Type, 2019 & 2034

Table 56: East Asia Market Volume (Unit) Forecast by Product Type, 2019 & 2034

Table 57: East Asia Market Value (US$ million) Forecast by Application, 2019 & 2034

Table 58: East Asia Market Volume (Unit) Forecast by Application, 2019 & 2034

Table 59: East Asia Market Value (US$ million) Forecast by End-use Industry, 2019 & 2034

Table 60: East Asia Market Volume (Unit) Forecast by End-use Industry, 2019 & 2034

Table 61: South Asia Pacific Market Value (US$ million) Forecast by Country, 2019 & 2034

Table 62: South Asia Pacific Market Volume (Unit) Forecast by Country, 2019 & 2034

Table 63: South Asia Pacific Market Value (US$ million) Forecast by Voltage Level, 2019 & 2034

Table 64: South Asia Pacific Market Volume (Unit) Forecast by Voltage Level, 2019 & 2034

Table 65: South Asia Pacific Market Value (US$ million) Forecast by Product Type, 2019 & 2034

Table 66: South Asia Pacific Market Volume (Unit) Forecast by Product Type, 2019 & 2034

Table 67: South Asia Pacific Market Value (US$ million) Forecast by Application, 2019 & 2034

Table 68: South Asia Pacific Market Volume (Unit) Forecast by Application, 2019 & 2034

Table 69: South Asia Pacific Market Value (US$ million) Forecast by End-use Industry, 2019 & 2034

Table 70: South Asia Pacific Market Volume (Unit) Forecast by End-use Industry, 2019 & 2034

Table 71: Middle East & Africa Market Value (US$ million) Forecast by Country, 2019 & 2034

Table 72: Middle East & Africa Market Volume (Unit) Forecast by Country, 2019 & 2034

Table 73: Middle East & Africa Market Value (US$ million) Forecast by Voltage Level, 2019 & 2034

Table 74: Middle East & Africa Market Volume (Unit) Forecast by Voltage Level, 2019 & 2034

Table 75: Middle East & Africa Market Value (US$ million) Forecast by Product Type, 2019 & 2034

Table 76: Middle East & Africa Market Volume (Unit) Forecast by Product Type, 2019 & 2034

Table 77: Middle East & Africa Market Value (US$ million) Forecast by Application, 2019 & 2034

Table 78: Middle East & Africa Market Volume (Unit) Forecast by Application, 2019 & 2034

Table 79: Middle East & Africa Market Value (US$ million) Forecast by End-use Industry, 2019 & 2034

Table 80: Middle East & Africa Market Volume (Unit) Forecast by End-use Industry, 2019 & 2034

List of Charts

Figure 1: Global Market Value (US$ million) by Voltage Level, 2024 & 2034

Figure 2: Global Market Value (US$ million) by Product Type, 2024 & 2034

Figure 3: Global Market Value (US$ million) by Application, 2024 & 2034

Figure 4: Global Market Value (US$ million) by End-use Industry, 2024 & 2034

Figure 5: Global Market Value (US$ million) by Region, 2024 & 2034

Figure 6: Global Market Value (US$ million) Analysis by Region, 2019 & 2034

Figure 7: Global Market Volume (Unit) Analysis by Region, 2019 & 2034

Figure 8: Global Market Value Share (%) and BPS Analysis by Region, 2024 & 2034

Figure 9: Global Market Y-o-Y Growth (%) Projections by Region, 2024 to 2034

Figure 10: Global Market Value (US$ million) Analysis by Voltage Level, 2019 & 2034

Figure 11: Global Market Volume (Unit) Analysis by Voltage Level, 2019 & 2034

Figure 12: Global Market Value Share (%) and BPS Analysis by Voltage Level, 2024 & 2034

Figure 13: Global Market Y-o-Y Growth (%) Projections by Voltage Level, 2024 to 2034

Figure 14: Global Market Value (US$ million) Analysis by Product Type, 2019 & 2034

Figure 15: Global Market Volume (Unit) Analysis by Product Type, 2019 & 2034

Figure 16: Global Market Value Share (%) and BPS Analysis by Product Type, 2024 & 2034

Figure 17: Global Market Y-o-Y Growth (%) Projections by Product Type, 2024 to 2034

Figure 18: Global Market Value (US$ million) Analysis by Application, 2019 & 2034

Figure 19: Global Market Volume (Unit) Analysis by Application, 2019 & 2034

Figure 20: Global Market Value Share (%) and BPS Analysis by Application, 2024 & 2034

Figure 21: Global Market Y-o-Y Growth (%) Projections by Application, 2024 to 2034

Figure 22: Global Market Value (US$ million) Analysis by End-use Industry, 2019 & 2034

Figure 23: Global Market Volume (Unit) Analysis by End-use Industry, 2019 & 2034

Figure 24: Global Market Value Share (%) and BPS Analysis by End-use Industry, 2024 & 2034

Figure 25: Global Market Y-o-Y Growth (%) Projections by End-use Industry, 2024 to 2034

Figure 26: Global Market Attractiveness by Voltage Level, 2024 to 2034

Figure 27: Global Market Attractiveness by Product Type, 2024 to 2034

Figure 28: Global Market Attractiveness by Application, 2024 to 2034

Figure 29: Global Market Attractiveness by End-use Industry, 2024 to 2034

Figure 30: Global Market Attractiveness by Region, 2024 to 2034

Figure 31: North America Market Value (US$ million) by Voltage Level, 2024 & 2034

Figure 32: North America Market Value (US$ million) by Product Type, 2024 & 2034

Figure 33: North America Market Value (US$ million) by Application, 2024 & 2034

Figure 34: North America Market Value (US$ million) by End-use Industry, 2024 & 2034

Figure 35: North America Market Value (US$ million) by Country, 2024 & 2034

Figure 36: North America Market Value (US$ million) Analysis by Country, 2019 & 2034

Figure 37: North America Market Volume (Unit) Analysis by Country, 2019 & 2034

Figure 38: North America Market Value Share (%) and BPS Analysis by Country, 2024 & 2034

Figure 39: North America Market Y-o-Y Growth (%) Projections by Country, 2024 to 2034

Figure 40: North America Market Value (US$ million) Analysis by Voltage Level, 2019 & 2034

Figure 41: North America Market Volume (Unit) Analysis by Voltage Level, 2019 & 2034

Figure 42: North America Market Value Share (%) and BPS Analysis by Voltage Level, 2024 & 2034

Figure 43: North America Market Y-o-Y Growth (%) Projections by Voltage Level, 2024 to 2034

Figure 44: North America Market Value (US$ million) Analysis by Product Type, 2019 & 2034

Figure 45: North America Market Volume (Unit) Analysis by Product Type, 2019 & 2034

Figure 46: North America Market Value Share (%) and BPS Analysis by Product Type, 2024 & 2034

Figure 47: North America Market Y-o-Y Growth (%) Projections by Product Type, 2024 to 2034

Figure 48: North America Market Value (US$ million) Analysis by Application, 2019 & 2034

Figure 49: North America Market Volume (Unit) Analysis by Application, 2019 & 2034

Figure 50: North America Market Value Share (%) and BPS Analysis by Application, 2024 & 2034

Figure 51: North America Market Y-o-Y Growth (%) Projections by Application, 2024 to 2034

Figure 52: North America Market Value (US$ million) Analysis by End-use Industry, 2019 & 2034

Figure 53: North America Market Volume (Unit) Analysis by End-use Industry, 2019 & 2034

Figure 54: North America Market Value Share (%) and BPS Analysis by End-use Industry, 2024 & 2034

Figure 55: North America Market Y-o-Y Growth (%) Projections by End-use Industry, 2024 to 2034

Figure 56: North America Market Attractiveness by Voltage Level, 2024 to 2034

Figure 57: North America Market Attractiveness by Product Type, 2024 to 2034

Figure 58: North America Market Attractiveness by Application, 2024 to 2034

Figure 59: North America Market Attractiveness by End-use Industry, 2024 to 2034

Figure 60: North America Market Attractiveness by Country, 2024 to 2034

Figure 61: Latin America Market Value (US$ million) by Voltage Level, 2024 & 2034

Figure 62: Latin America Market Value (US$ million) by Product Type, 2024 & 2034

Figure 63: Latin America Market Value (US$ million) by Application, 2024 & 2034

Figure 64: Latin America Market Value (US$ million) by End-use Industry, 2024 & 2034

Figure 65: Latin America Market Value (US$ million) by Country, 2024 & 2034

Figure 66: Latin America Market Value (US$ million) Analysis by Country, 2019 & 2034

Figure 67: Latin America Market Volume (Unit) Analysis by Country, 2019 & 2034

Figure 68: Latin America Market Value Share (%) and BPS Analysis by Country, 2024 & 2034

Figure 69: Latin America Market Y-o-Y Growth (%) Projections by Country, 2024 to 2034

Figure 70: Latin America Market Value (US$ million) Analysis by Voltage Level, 2019 & 2034

Figure 71: Latin America Market Volume (Unit) Analysis by Voltage Level, 2019 & 2034

Figure 72: Latin America Market Value Share (%) and BPS Analysis by Voltage Level, 2024 & 2034

Figure 73: Latin America Market Y-o-Y Growth (%) Projections by Voltage Level, 2024 to 2034

Figure 74: Latin America Market Value (US$ million) Analysis by Product Type, 2019 & 2034

Figure 75: Latin America Market Volume (Unit) Analysis by Product Type, 2019 & 2034

Figure 76: Latin America Market Value Share (%) and BPS Analysis by Product Type, 2024 & 2034

Figure 77: Latin America Market Y-o-Y Growth (%) Projections by Product Type, 2024 to 2034

Figure 78: Latin America Market Value (US$ million) Analysis by Application, 2019 & 2034

Figure 79: Latin America Market Volume (Unit) Analysis by Application, 2019 & 2034

Figure 80: Latin America Market Value Share (%) and BPS Analysis by Application, 2024 & 2034

Figure 81: Latin America Market Y-o-Y Growth (%) Projections by Application, 2024 to 2034

Figure 82: Latin America Market Value (US$ million) Analysis by End-use Industry, 2019 & 2034

Figure 83: Latin America Market Volume (Unit) Analysis by End-use Industry, 2019 & 2034

Figure 84: Latin America Market Value Share (%) and BPS Analysis by End-use Industry, 2024 & 2034

Figure 85: Latin America Market Y-o-Y Growth (%) Projections by End-use Industry, 2024 to 2034

Figure 86: Latin America Market Attractiveness by Voltage Level, 2024 to 2034

Figure 87: Latin America Market Attractiveness by Product Type, 2024 to 2034

Figure 88: Latin America Market Attractiveness by Application, 2024 to 2034

Figure 89: Latin America Market Attractiveness by End-use Industry, 2024 to 2034

Figure 90: Latin America Market Attractiveness by Country, 2024 to 2034

Figure 91: Western Europe Market Value (US$ million) by Voltage Level, 2024 & 2034

Figure 92: Western Europe Market Value (US$ million) by Product Type, 2024 & 2034

Figure 93: Western Europe Market Value (US$ million) by Application, 2024 & 2034

Figure 94: Western Europe Market Value (US$ million) by End-use Industry, 2024 & 2034

Figure 95: Western Europe Market Value (US$ million) by Country, 2024 & 2034

Figure 96: Western Europe Market Value (US$ million) Analysis by Country, 2019 & 2034

Figure 97: Western Europe Market Volume (Unit) Analysis by Country, 2019 & 2034

Figure 98: Western Europe Market Value Share (%) and BPS Analysis by Country, 2024 & 2034

Figure 99: Western Europe Market Y-o-Y Growth (%) Projections by Country, 2024 to 2034

Figure 100: Western Europe Market Value (US$ million) Analysis by Voltage Level, 2019 & 2034

Figure 101: Western Europe Market Volume (Unit) Analysis by Voltage Level, 2019 & 2034

Figure 102: Western Europe Market Value Share (%) and BPS Analysis by Voltage Level, 2024 & 2034

Figure 103: Western Europe Market Y-o-Y Growth (%) Projections by Voltage Level, 2024 to 2034

Figure 104: Western Europe Market Value (US$ million) Analysis by Product Type, 2019 & 2034

Figure 105: Western Europe Market Volume (Unit) Analysis by Product Type, 2019 & 2034

Figure 106: Western Europe Market Value Share (%) and BPS Analysis by Product Type, 2024 & 2034

Figure 107: Western Europe Market Y-o-Y Growth (%) Projections by Product Type, 2024 to 2034

Figure 108: Western Europe Market Value (US$ million) Analysis by Application, 2019 & 2034

Figure 109: Western Europe Market Volume (Unit) Analysis by Application, 2019 & 2034

Figure 110: Western Europe Market Value Share (%) and BPS Analysis by Application, 2024 & 2034

Figure 111: Western Europe Market Y-o-Y Growth (%) Projections by Application, 2024 to 2034

Figure 112: Western Europe Market Value (US$ million) Analysis by End-use Industry, 2019 & 2034

Figure 113: Western Europe Market Volume (Unit) Analysis by End-use Industry, 2019 & 2034

Figure 114: Western Europe Market Value Share (%) and BPS Analysis by End-use Industry, 2024 & 2034

Figure 115: Western Europe Market Y-o-Y Growth (%) Projections by End-use Industry, 2024 to 2034

Figure 116: Western Europe Market Attractiveness by Voltage Level, 2024 to 2034

Figure 117: Western Europe Market Attractiveness by Product Type, 2024 to 2034

Figure 118: Western Europe Market Attractiveness by Application, 2024 to 2034

Figure 119: Western Europe Market Attractiveness by End-use Industry, 2024 to 2034

Figure 120: Western Europe Market Attractiveness by Country, 2024 to 2034

Figure 121: Eastern Europe Market Value (US$ million) by Voltage Level, 2024 & 2034

Figure 122: Eastern Europe Market Value (US$ million) by Product Type, 2024 & 2034

Figure 123: Eastern Europe Market Value (US$ million) by Application, 2024 & 2034

Figure 124: Eastern Europe Market Value (US$ million) by End-use Industry, 2024 & 2034

Figure 125: Eastern Europe Market Value (US$ million) by Country, 2024 & 2034

Figure 126: Eastern Europe Market Value (US$ million) Analysis by Country, 2019 & 2034

Figure 127: Eastern Europe Market Volume (Unit) Analysis by Country, 2019 & 2034

Figure 128: Eastern Europe Market Value Share (%) and BPS Analysis by Country, 2024 & 2034

Figure 129: Eastern Europe Market Y-o-Y Growth (%) Projections by Country, 2024 to 2034

Figure 130: Eastern Europe Market Value (US$ million) Analysis by Voltage Level, 2019 & 2034

Figure 131: Eastern Europe Market Volume (Unit) Analysis by Voltage Level, 2019 & 2034

Figure 132: Eastern Europe Market Value Share (%) and BPS Analysis by Voltage Level, 2024 & 2034

Figure 133: Eastern Europe Market Y-o-Y Growth (%) Projections by Voltage Level, 2024 to 2034

Figure 134: Eastern Europe Market Value (US$ million) Analysis by Product Type, 2019 & 2034

Figure 135: Eastern Europe Market Volume (Unit) Analysis by Product Type, 2019 & 2034

Figure 136: Eastern Europe Market Value Share (%) and BPS Analysis by Product Type, 2024 & 2034

Figure 137: Eastern Europe Market Y-o-Y Growth (%) Projections by Product Type, 2024 to 2034

Figure 138: Eastern Europe Market Value (US$ million) Analysis by Application, 2019 & 2034

Figure 139: Eastern Europe Market Volume (Unit) Analysis by Application, 2019 & 2034

Figure 140: Eastern Europe Market Value Share (%) and BPS Analysis by Application, 2024 & 2034

Figure 141: Eastern Europe Market Y-o-Y Growth (%) Projections by Application, 2024 to 2034

Figure 142: Eastern Europe Market Value (US$ million) Analysis by End-use Industry, 2019 & 2034

Figure 143: Eastern Europe Market Volume (Unit) Analysis by End-use Industry, 2019 & 2034

Figure 144: Eastern Europe Market Value Share (%) and BPS Analysis by End-use Industry, 2024 & 2034

Figure 145: Eastern Europe Market Y-o-Y Growth (%) Projections by End-use Industry, 2024 to 2034

Figure 146: Eastern Europe Market Attractiveness by Voltage Level, 2024 to 2034

Figure 147: Eastern Europe Market Attractiveness by Product Type, 2024 to 2034

Figure 148: Eastern Europe Market Attractiveness by Application, 2024 to 2034

Figure 149: Eastern Europe Market Attractiveness by End-use Industry, 2024 to 2034

Figure 150: Eastern Europe Market Attractiveness by Country, 2024 to 2034

Figure 151: East Asia Market Value (US$ million) by Voltage Level, 2024 & 2034

Figure 152: East Asia Market Value (US$ million) by Product Type, 2024 & 2034

Figure 153: East Asia Market Value (US$ million) by Application, 2024 & 2034

Figure 154: East Asia Market Value (US$ million) by End-use Industry, 2024 & 2034

Figure 155: East Asia Market Value (US$ million) by Country, 2024 & 2034

Figure 156: East Asia Market Value (US$ million) Analysis by Country, 2019 & 2034

Figure 157: East Asia Market Volume (Unit) Analysis by Country, 2019 & 2034

Figure 158: East Asia Market Value Share (%) and BPS Analysis by Country, 2024 & 2034

Figure 159: East Asia Market Y-o-Y Growth (%) Projections by Country, 2024 to 2034

Figure 160: East Asia Market Value (US$ million) Analysis by Voltage Level, 2019 & 2034

Figure 161: East Asia Market Volume (Unit) Analysis by Voltage Level, 2019 & 2034

Figure 162: East Asia Market Value Share (%) and BPS Analysis by Voltage Level, 2024 & 2034

Figure 163: East Asia Market Y-o-Y Growth (%) Projections by Voltage Level, 2024 to 2034

Figure 164: East Asia Market Value (US$ million) Analysis by Product Type, 2019 & 2034

Figure 165: East Asia Market Volume (Unit) Analysis by Product Type, 2019 & 2034

Figure 166: East Asia Market Value Share (%) and BPS Analysis by Product Type, 2024 & 2034

Figure 167: East Asia Market Y-o-Y Growth (%) Projections by Product Type, 2024 to 2034

Figure 168: East Asia Market Value (US$ million) Analysis by Application, 2019 & 2034

Figure 169: East Asia Market Volume (Unit) Analysis by Application, 2019 & 2034

Figure 170: East Asia Market Value Share (%) and BPS Analysis by Application, 2024 & 2034

Figure 171: East Asia Market Y-o-Y Growth (%) Projections by Application, 2024 to 2034

Figure 172: East Asia Market Value (US$ million) Analysis by End-use Industry, 2019 & 2034

Figure 173: East Asia Market Volume (Unit) Analysis by End-use Industry, 2019 & 2034

Figure 174: East Asia Market Value Share (%) and BPS Analysis by End-use Industry, 2024 & 2034

Figure 175: East Asia Market Y-o-Y Growth (%) Projections by End-use Industry, 2024 to 2034

Figure 176: East Asia Market Attractiveness by Voltage Level, 2024 to 2034

Figure 177: East Asia Market Attractiveness by Product Type, 2024 to 2034

Figure 178: East Asia Market Attractiveness by Application, 2024 to 2034

Figure 179: East Asia Market Attractiveness by End-use Industry, 2024 to 2034

Figure 180: East Asia Market Attractiveness by Country, 2024 to 2034

Figure 181: South Asia Pacific Market Value (US$ million) by Voltage Level, 2024 & 2034

Figure 182: South Asia Pacific Market Value (US$ million) by Product Type, 2024 & 2034

Figure 183: South Asia Pacific Market Value (US$ million) by Application, 2024 & 2034

Figure 184: South Asia Pacific Market Value (US$ million) by End-use Industry, 2024 & 2034

Figure 185: South Asia Pacific Market Value (US$ million) by Country, 2024 & 2034

Figure 186: South Asia Pacific Market Value (US$ million) Analysis by Country, 2019 & 2034

Figure 187: South Asia Pacific Market Volume (Unit) Analysis by Country, 2019 & 2034

Figure 188: South Asia Pacific Market Value Share (%) and BPS Analysis by Country, 2024 & 2034

Figure 189: South Asia Pacific Market Y-o-Y Growth (%) Projections by Country, 2024 to 2034

Figure 190: South Asia Pacific Market Value (US$ million) Analysis by Voltage Level, 2019 & 2034

Figure 191: South Asia Pacific Market Volume (Unit) Analysis by Voltage Level, 2019 & 2034

Figure 192: South Asia Pacific Market Value Share (%) and BPS Analysis by Voltage Level, 2024 & 2034

Figure 193: South Asia Pacific Market Y-o-Y Growth (%) Projections by Voltage Level, 2024 to 2034

Figure 194: South Asia Pacific Market Value (US$ million) Analysis by Product Type, 2019 & 2034

Figure 195: South Asia Pacific Market Volume (Unit) Analysis by Product Type, 2019 & 2034

Figure 196: South Asia Pacific Market Value Share (%) and BPS Analysis by Product Type, 2024 & 2034

Figure 197: South Asia Pacific Market Y-o-Y Growth (%) Projections by Product Type, 2024 to 2034

Figure 198: South Asia Pacific Market Value (US$ million) Analysis by Application, 2019 & 2034

Figure 199: South Asia Pacific Market Volume (Unit) Analysis by Application, 2019 & 2034

Figure 200: South Asia Pacific Market Value Share (%) and BPS Analysis by Application, 2024 & 2034

Figure 201: South Asia Pacific Market Y-o-Y Growth (%) Projections by Application, 2024 to 2034

Figure 202: South Asia Pacific Market Value (US$ million) Analysis by End-use Industry, 2019 & 2034

Figure 203: South Asia Pacific Market Volume (Unit) Analysis by End-use Industry, 2019 & 2034

Figure 204: South Asia Pacific Market Value Share (%) and BPS Analysis by End-use Industry, 2024 & 2034

Figure 205: South Asia Pacific Market Y-o-Y Growth (%) Projections by End-use Industry, 2024 to 2034

Figure 206: South Asia Pacific Market Attractiveness by Voltage Level, 2024 to 2034

Figure 207: South Asia Pacific Market Attractiveness by Product Type, 2024 to 2034

Figure 208: South Asia Pacific Market Attractiveness by Application, 2024 to 2034

Figure 209: South Asia Pacific Market Attractiveness by End-use Industry, 2024 to 2034

Figure 210: South Asia Pacific Market Attractiveness by Country, 2024 to 2034

Figure 211: Middle East & Africa Market Value (US$ million) by Voltage Level, 2024 & 2034

Figure 212: Middle East & Africa Market Value (US$ million) by Product Type, 2024 & 2034

Figure 213: Middle East & Africa Market Value (US$ million) by Application, 2024 & 2034

Figure 214: Middle East & Africa Market Value (US$ million) by End-use Industry, 2024 & 2034

Figure 215: Middle East & Africa Market Value (US$ million) by Country, 2024 & 2034

Figure 216: Middle East & Africa Market Value (US$ million) Analysis by Country, 2019 & 2034

Figure 217: Middle East & Africa Market Volume (Unit) Analysis by Country, 2019 & 2034

Figure 218: Middle East & Africa Market Value Share (%) and BPS Analysis by Country, 2024 & 2034

Figure 219: Middle East & Africa Market Y-o-Y Growth (%) Projections by Country, 2024 to 2034

Figure 220: Middle East & Africa Market Value (US$ million) Analysis by Voltage Level, 2019 & 2034

Figure 221: Middle East & Africa Market Volume (Unit) Analysis by Voltage Level, 2019 & 2034

Figure 222: Middle East & Africa Market Value Share (%) and BPS Analysis by Voltage Level, 2024 & 2034

Figure 223: Middle East & Africa Market Y-o-Y Growth (%) Projections by Voltage Level, 2024 to 2034

Figure 224: Middle East & Africa Market Value (US$ million) Analysis by Product Type, 2019 & 2034

Figure 225: Middle East & Africa Market Volume (Unit) Analysis by Product Type, 2019 & 2034

Figure 226: Middle East & Africa Market Value Share (%) and BPS Analysis by Product Type, 2024 & 2034

Figure 227: Middle East & Africa Market Y-o-Y Growth (%) Projections by Product Type, 2024 to 2034

Figure 228: Middle East & Africa Market Value (US$ million) Analysis by Application, 2019 & 2034

Figure 229: Middle East & Africa Market Volume (Unit) Analysis by Application, 2019 & 2034

Figure 230: Middle East & Africa Market Value Share (%) and BPS Analysis by Application, 2024 & 2034

Figure 231: Middle East & Africa Market Y-o-Y Growth (%) Projections by Application, 2024 to 2034

Figure 232: Middle East & Africa Market Value (US$ million) Analysis by End-use Industry, 2019 & 2034

Figure 233: Middle East & Africa Market Volume (Unit) Analysis by End-use Industry, 2019 & 2034

Figure 234: Middle East & Africa Market Value Share (%) and BPS Analysis by End-use Industry, 2024 & 2034

Figure 235: Middle East & Africa Market Y-o-Y Growth (%) Projections by End-use Industry, 2024 to 2034

Figure 236: Middle East & Africa Market Attractiveness by Voltage Level, 2024 to 2034

Figure 237: Middle East & Africa Market Attractiveness by Product Type, 2024 to 2034

Figure 238: Middle East & Africa Market Attractiveness by Application, 2024 to 2034

Figure 239: Middle East & Africa Market Attractiveness by End-use Industry, 2024 to 2034

Figure 240: Middle East & Africa Market Attractiveness by Country, 2024 to 2034

Recommendations

Industrial Automation

Compact Power Equipment Rental Market

Published : July 2023

Industrial Automation

Power Quality Equipment Market

Published : December 2022

Industrial Automation

Mooring Compensators Market

Published : October 2022

Industrial Automation

Shunt Reactor Market

Published : August 2020

Explore Industrial Automation Insights

View Reports

Static VAR Compensator Market