Anti-static Foam Packaging Market Size and Share Forecast Outlook 2025 to 2035

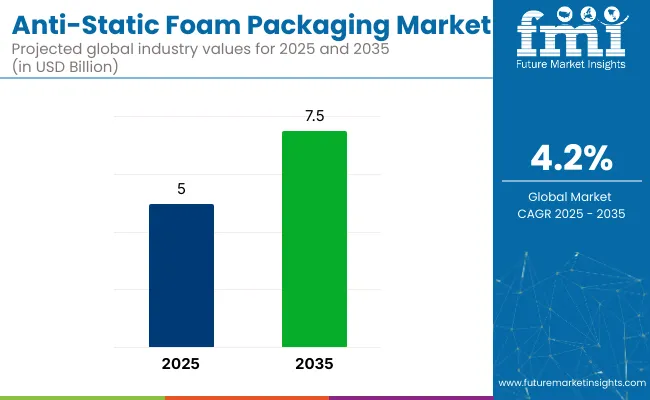
The global anti-static foam packaging market is projected to grow from USD 5.0 billion in 2025 to USD 7.5 billion by 2035, registering a CAGR of 4.2% during the forecast period. Sales in 2024 were recorded at USD 4.3 billion.
Quick Stats of Anti-Static Foam Packaging Market

  • Market Value (2025): USD 5.0 billion
  • Forecast Value (2035): USD 7.5 billion
  • Forecast CAGR: 4.2%
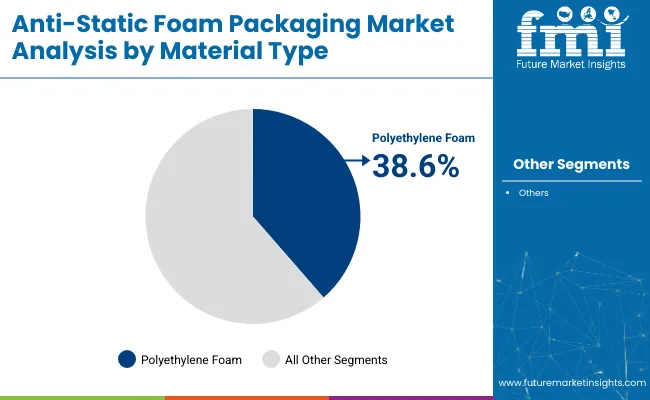
  • Material Type Leader in 2025: Polyethylene foam (38.6% market share)
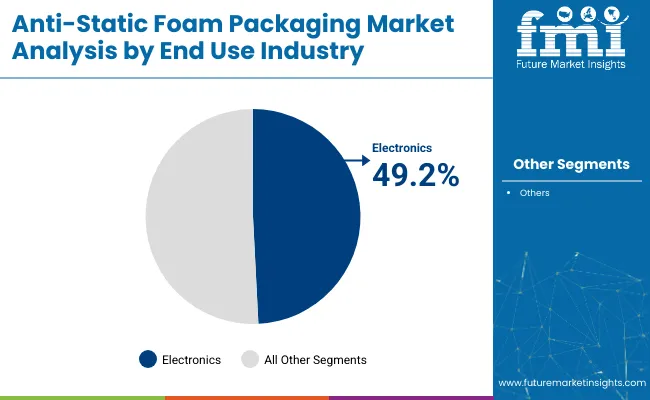
  • Top End Use: Electronics (49.2% share)
  • Key Growth Country: Asia Pacific (China to register CAGR of 8.7%)

Anti Static Foam Packaging Market

Attributes Description
Estimated Market Size (2025E) USD 5.0 billion
Projected Market Value (2035F) USD 7.5 billion
Value-based CAGR (2025 to 2035) 4.2%

This growth is primarily driven by the expanding consumer electronics industry and the rising need for ESD-safe packaging solutions in logistics and semiconductor sectors. Anti-static foam, typically made from polyethylene or polyurethane, protects delicate electronics from damage caused by electrostatic discharge during transit or assembly. The market is also benefitting from broader demand in medical device packaging, automotive electronics, and aerospace components.

In February 2024, Pregis, a global protective packaging leader, introduced a new certified-circular polyethylene (PE) foam solution in collaboration with ExxonMobil. The foam is manufactured at ISCC PLUS-certified facilities in Kentucky and California and is aimed at helping brands meet circularity goals. Additionally, in its 2024 Sustainability Report, Kevin Baudhuin, CEO of Pregis, stated: “In 2024, we made progress that matters.

The engine behind this momentum is our people. Their creativity, passion, and persistence power every milestone. In 2024 alone, our teams helped achieve measurable reductions in carbon emissions, diverted more waste from landfills, and scaled production of circular materials. Recent innovations in the market include recyclable pink anti-static foam and conductive foam variants designed for circuit boards and server components.

Smart traceability features such as printed QR codes and batch-specific conductivity metrics are being integrated to meet OEM and compliance requirements.The Asia-Pacific region is expected to remain dominant due to its strong semiconductor manufacturing base in China, Taiwan, and South Korea. Companies are expected to focus on automation, lightweight foams, and regulatory-compliant packaging materials to meet evolving global standards and ESG benchmarks.

Analyzing Anti-Static Foam Packaging Market by Top Investment Segment

The market has been segmented based on material type, packaging type, end use industry, density, and region. By material type, polyethylene foam, polyurethane foam, polystyrene foam, and polyvinyl chloride foam are utilized for their cushioning properties, electrostatic discharge protection, and compatibility with sensitive components.

Packaging formats such as bags, trays, sheets, and rolls have been adopted to suit a range of protective applications in storage, shipping, and display. End use industries include electronics, aerospace, automotive, medical, and consumer goods, reflecting increasing demand for static-sensitive packaging in high-value product categories.

Density-based segmentation low, medium, and high addresses performance requirements related to impact resistance, compressibility, and material strength. Regional segmentation covers North America, Europe, South America, Asia Pacific, and the Middle East & Africa to capture variations in electronics manufacturing hubs, export-oriented industries, and packaging innovation ecosystems.
Polyethylene Foam to Dominate Owing to Versatility and Cost-Effective Cushioning

Anti Static Foam Packaging Market Analysis By Material Type

The polyethylene foam segment is expected to capture the highest share of 38.6% in the anti-static foam packaging market by 2025, primarily due to its lightweight nature, strong cushioning ability, and broad applicability across sensitive electronic and consumer goods packaging.

Polyethylene foam provides a balance between softness and durability, making it ideal for shock absorption and vibration dampening essential for transporting fragile devices and instruments. Its closed-cell structure enhances resistance to moisture, dust, and most chemicals, which is critical in protective packaging for high-value electronics, automotive components, and industrial sensors.

Polyethylene foam also offers superior flexibility, allowing it to be easily cut, laminated, and thermo-formed into customized profiles for trays, inserts, and corner pads. The anti-static variant of polyethylene foam prevents the buildup of electrostatic discharge (ESD), which can damage microprocessors, semiconductors, and circuit boards during transit.

As e-commerce accelerates the global movement of sensitive products, packaging that assures ESD protection, impact resistance, and sustainability is in high demand. Given its lower cost compared to polyurethane or polystyrene alternatives, polyethylene foam remains the preferred material for both high-volume and specialized applications across multiple regions.
Electronics Segment to Lead End-Use Driven by ESD-Sensitive Product Packaging

Anti Static Foam Packaging Market Analysis By End Use Industry

The electronics segment is projected to dominate the end-use industry category with a 49.2% share in 2025, as the global surge in semiconductor, consumer electronics, and smart device shipments fuels the need for robust ESD-safe packaging.

Anti-static foam packaging plays a vital role in safeguarding critical components such as integrated circuits (ICs), PCBs, displays, and sensors from electrostatic discharge during manufacturing, assembly, and logistics. The rapid expansion of sectors like 5G infrastructure, wearable tech, electric vehicles (EVs), and industrial automation has intensified the need for protective packaging solutions that meet ISO and ANSI ESD compliance standards.

Manufacturers across APAC, North America, and Europe are increasingly integrating anti-static foam in tray-based shipping systems, protective clamshells, and die-cut inserts to ensure product integrity from plant to end-user.

Anti-static foam packaging supports lean inventory and just-in-time (JIT) practices in electronics manufacturing by enabling component organization and secure in-process storage. As OEMs and electronics exporters face mounting quality assurance demands, this segment is projected to remain the cornerstone of the anti-static foam packaging market, with innovation focusing on recyclability, flame resistance, and cleanroom compatibility.

Challenges and Opportunities in the Anti-static Foam Packaging Market

Challenges

High Production Costs and Limited Recycling Infrastructure

Challenges exist within the anti-static foam packaging market for production costs and sustainability. Specialty materials used for ESD, like conductive or dissipative polyethylene (PE) and polyurethane (PU) foams, have a higher cost of manufacturing than conventional packaging solutions.

This cost consideration results in anti-static foam being less available for small and mid-sized enterprises (SMEs), who may resort to lower cost options with the risk of damage incurred by static.

Anti-static foam is made of poly plastic, which has a limited recycling infrastructure. Anti-static packaging is essential for safeguarding sensitive electronic components, yet the disposal and recyclability of these materials are still significant challenges.

Many foam-based solutions are non-biodegradable and hard to process in typical recycling plants. Moreover, the chemical additives of conductive and dissipative foam also pose a problem during the recycling, resulting in more waste.

To overcome these challenges, producers will have to invest in up to date production systems migrating to cost-effective production approaches such as automation and optimizing materials to reduce their manufacturing costs.

By using biodegradable or recyclable materials to produce the foams, developing environmentally safe anti-static foams is going to help with sustainability without sacrificing anti-static foams' efficiency. Building programs with waste management companies so more programs can be recycled can also improve the circular economy for anti-static forms of packaging.

Opportunity

Growing Demand from the Electronics and Automotive Sectors

Anti-static foam packaging is becoming increasingly popular as the use of electronic devices from consumer products to industrial equipment grows. The evolution of semiconductors, printed circuit boards (PCBs), and other sensitive electronic components drives the demand for adequate ESD protection.

As 5G networks, IoT (Internet of Things) devices, and high-performance computing continue to proliferate, manufacturers need dependable packaging solutions to avoid static-induced failures.

Apart from electronics, the automotive sector is one of the major contributors to the anti-static foam packaging market. The increasing demand for electric vehicles (EVs) has created a growing need for lithium-ion battery protection, which necessitates the use of specialized ESD-safe packaging to mitigate short circuits and component failures.

Automotive Manufacturers also use anti-static foam for transporting electrical control modules, sensors, and other vulnerable components.

Covered by ESD protective materials, products and people are at the forefront of ESD protection and awareness, and as customers look for innovative solutions, so too should ESD protection particularly in the areas of material science, for instance there will be an increase in bio-based conductive foams and hybrid packages that bring ESD protection together with other forms of protection such as barrier protection and mechanical robustness.

Strengthening of supply chain networks by expanding coverage and upgrading distribution networks would play an equally important role in catering to the rising demand from global electronics and automotive markets.
Country-wise Outlook - Anti-static Foam Packaging Market

Country Wise Analysis Of Anti Static Foam Packaging Market

United States

The USA anti-static foam packaging market is anticipated to witness significant growth due to the proliferation of the channels of protective packaging in the electronics sector, automotive sector, and aerospace sector. Demand for ESD-safe packaging is increasing as semiconductor manufacturing processes multiply and e-commerce sales of electronic components (including semiconductors) rise dramatically.

In addition, the healthcare industry is using anti-static foam packing to shield sensitive medical devices and equipment. With stricter regulation on Sustainable Packaging, the demand for recyclable and biodegradable anti-static foam materials is also on the rise.

Country CAGR (2025 to 2035)
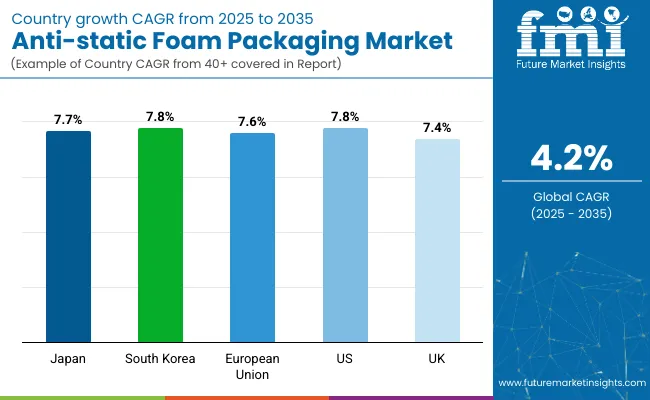
USA 7.8%

United Kingdom

The high-tech manufacturing sector (electronics, defence, and telecommunications) in the UK is largely driving the demand for anti-static foam packaging in the UK. The emergence of industry along with the growing emphasis on data centres and semiconductor manufacturing is fuelling the demand for electrostatic discharge (ESD) protection solutions.

Moreover, sustainable initiatives and plastic waste reduction strategy are motivating companies to come up with eco-friendly alternatives like biodegradable and reusable anti-static foam materials.

Country CAGR (2025 to 2035)
UK 7.4%

European Union

Because of their robust electronics, automotive, and aerospace sectors, Germany, France, and the Netherlands dominate the market for anti-static foam packaging in the EU. With the EU placing an increasingly emphasis on sustainability and circular economy principles, companies are becoming much more interested in recyclable anti-static foam solutions.

German and French production of electric vehicles (EVs) and semiconductors is also driving demand for ESD-safe packaging. Moreover, the growth of e-commerce across Europe is further increasing the demand for secure packaging solutions for electronic goods.

Country CAGR (2025 to 2035)
European Union (EU) 7.6%

Japan

Japan's market for anti-static foam packaging is expanding as the country leads in semiconductor technology, consumer electronics, and precision manufacturing. These industries need to implement advanced packaging solutions that effectively protect high value electronics components from Electric Discharge Damage.

The need for ultra-thin and high-performance ESD foam materials in Japan is being propelled by its commitment to technological advancement. Further driving market growth is the automotive industry's growing adoption of electronic elements, such as EV battery systems.

Country CAGR (2025 to 2035)
Japan 7.7%

South Korea

Running major semiconductor and electronics companies, South Korea is stimulating the growth of anti-static foam packaging market. The growing requirements for robust ESD protection strategies in turning out high-performance electronic devices are in line with the country’s global leadership in display panel manufacturing and advanced computing technologies.

Moreover, the growing production of electric vehicles and batteries in South Korea is also driving demand for anti-static foam packaging with properties to protect lithium-ion batteries and electronic components.

Country CAGR (2025 to 2035)
South Korea 7.8%

Competitive Outlook: Anti-static Foam Packaging Market

Antistatic foam packaging market has been projected to witness a soaring demand across various applications where electronics components require packaging. Important changes include sustainable, biodegradable foam materials, a better shock-absorbing process, and improved electrostatic discharge (ESD) protection.

Companies are targeting high-performance conductive and dissipative foam solutions to ensure product safety and adherence to ESD regulations.

Key Companies

  • EZ Flow Foam System
  • Sealed Air Corporation
  • BASF SE
  • Bolloré Group
  • Polymer Technologies
  • Intertape Polymer Group
  • Aerofoam Industries
  • Foam King
  • Pregis LLC

Key Segmentation

By Material Type:

  • Polyethylene Foam
  • Polyurethane Foam
  • Polystyrene Foam
  • Polyvinyl Chloride Foam

By Packaging Type:

  • Bags
  • Trays
  • Sheets
  • Rolls

By End Use Industry:

  • Electronics
  • Aerospace
  • Automotive
  • Medical
  • Consumer Goods

By Density:

  • Low Density
  • Medium Density
  • High Density

By Region:

  • North America
  • Europe
  • South America
  • Asia Pacific
  • Middle East and Africa

Table of Content

  1. Executive Summary
    • Global Market Outlook
    • Demand-side Trends
    • Supply-side Trends
    • Technology Roadmap Analysis
    • Analysis and Recommendations
  2. Market Overview
    • Market Coverage/Taxonomy
    • Market Definition/Scope/Limitations
  3. Market Background
    • Market Dynamics
      • Drivers
      • Restraints
      • Opportunity
      • Trends
    • Scenario Forecast
      • Demand in Optimistic Scenario
      • Demand in Likely Scenario
      • Demand in Conservative Scenario
    • Opportunity Map Analysis
    • Product Life Cycle Analysis
    • Supply Chain Analysis
      • Supply Side Participants and their Roles
        • Producers
        • Mid-Level Participants (Traders/ Agents/ Brokers)
        • Wholesalers and Distributors
      • Value Added and Value Created at Node in the Supply Chain
      • List of Raw Material Suppliers
      • List of Existing and Potential Buyer’s
    • Investment Feasibility Matrix
    • Value Chain Analysis
      • Profit Margin Analysis
      • Wholesalers and Distributors
      • Retailers
    • PESTLE and Porter’s Analysis
    • Regulatory Landscape
      • By Key Regions
      • By Key Countries
    • Regional Parent Market Outlook
    • Production and Consumption Statistics
    • Import and Export Statistics
  4. Global Market Analysis 2020 to 2024 and Forecast, 2025 to 2035
    • Historical Market Size Value (USD Million) & Volume (Units) Analysis, 2020 to 2024
    • Current and Future Market Size Value (USD Million) & Volume (Units) Projections, 2025 to 2035
      • Y-o-Y Growth Trend Analysis
      • Absolute $ Opportunity Analysis
  5. Global Market Pricing Analysis 2020 to 2024 and Forecast 2025 to 2035
  6. Global Market Analysis 2020 to 2024 and Forecast 2025 to 2035, By Material Type
    • Introduction/Key Findings
    • Historical Market Size Value (USD Million) & Volume (Units) Analysis By Material Type , 2020 to 2024
    • Current and Future Market Size Value (USD Million) & Volume (Units) Analysis and Forecast By Material Type , 2025 to 2035
      • Polyethylene Foam
      • Polyurethane Foam
      • Polystyrene Foam
      • Polyvinyl Chloride Foam
    • Y-o-Y Growth Trend Analysis By Material Type , 2020 to 2024
    • Absolute $ Opportunity Analysis By Material Type , 2025 to 2035
  7. Global Market Analysis 2020 to 2024 and Forecast 2025 to 2035, By Packaging Type
    • Introduction/Key Findings
    • Historical Market Size Value (USD Million) & Volume (Units) Analysis By Packaging Type , 2020 to 2024
    • Current and Future Market Size Value (USD Million) & Volume (Units) Analysis and Forecast By Packaging Type , 2025 to 2035
      • Bags
      • Trays
      • Sheets
      • Rolls
    • Y-o-Y Growth Trend Analysis By Packaging Type , 2020 to 2024
    • Absolute $ Opportunity Analysis By Packaging Type , 2025 to 2035
  8. Global Market Analysis 2020 to 2024 and Forecast 2025 to 2035, By End Use
    • Introduction/Key Findings
    • Historical Market Size Value (USD Million) & Volume (Units) Analysis By End Use, 2020 to 2024
    • Current and Future Market Size Value (USD Million) & Volume (Units) Analysis and Forecast By End Use, 2025 to 2035
      • Electronics
      • Aerospace
      • Automotive
      • Medical
      • Consumer Goods
    • Y-o-Y Growth Trend Analysis By End Use, 2020 to 2024
    • Absolute $ Opportunity Analysis By End Use, 2025 to 2035
  9. Global Market Analysis 2020 to 2024 and Forecast 2025 to 2035, By Density
    • Introduction/Key Findings
    • Historical Market Size Value (USD Million) & Volume (Units) Analysis By Density , 2020 to 2024
    • Current and Future Market Size Value (USD Million) & Volume (Units) Analysis and Forecast By Density , 2025 to 2035
      • Low Density
      • Medium Density
      • High Density
    • Y-o-Y Growth Trend Analysis By Density , 2020 to 2024
    • Absolute $ Opportunity Analysis By Density , 2025 to 2035
  10. Global Market Analysis 2020 to 2024 and Forecast 2025 to 2035, By Region
    • Introduction
    • Historical Market Size Value (USD Million) & Volume (Units) Analysis By Region, 2020 to 2024
    • Current Market Size Value (USD Million) & Volume (Units) Analysis and Forecast By Region, 2025 to 2035
      • North America
      • Latin America
      • Europe
      • East Asia
      • South Asia
      • Oceania
      • MEA
    • Market Attractiveness Analysis By Region
  11. North America Market Analysis 2020 to 2024 and Forecast 2025 to 2035, By Country
    • Historical Market Size Value (USD Million) & Volume (Units) Trend Analysis By Market Taxonomy, 2020 to 2024
    • Market Size Value (USD Million) & Volume (Units) Forecast By Market Taxonomy, 2025 to 2035
      • By Country
        • USA
        • Canada
      • By Material Type
      • By Packaging Type
      • By End Use
      • By Density
    • Market Attractiveness Analysis
      • By Country
      • By Material Type
      • By Packaging Type
      • By End Use
      • By Density
    • Key Takeaways
  12. Latin America Market Analysis 2020 to 2024 and Forecast 2025 to 2035, By Country
    • Historical Market Size Value (USD Million) & Volume (Units) Trend Analysis By Market Taxonomy, 2020 to 2024
    • Market Size Value (USD Million) & Volume (Units) Forecast By Market Taxonomy, 2025 to 2035
      • By Country
        • Brazil
        • Mexico
        • Argentina
        • Chile
        • Peru
        • Rest of Latin America
      • By Material Type
      • By Packaging Type
      • By End Use
      • By Density
    • Market Attractiveness Analysis
      • By Country
      • By Material Type
      • By Packaging Type
      • By End Use
      • By Density
    • Key Takeaways
  13. Europe Market Analysis 2020 to 2024 and Forecast 2025 to 2035, By Country
    • Historical Market Size Value (USD Million) & Volume (Units) Trend Analysis By Market Taxonomy, 2020 to 2024
    • Market Size Value (USD Million) & Volume (Units) Forecast By Market Taxonomy, 2025 to 2035
      • By Country
        • Germany
        • Italy
        • France
        • UK
        • Spain
        • Russia
        • BENELUX
        • Rest of Europe
      • By Material Type
      • By Packaging Type
      • By End Use
      • By Density
    • Market Attractiveness Analysis
      • By Country
      • By Material Type
      • By Packaging Type
      • By End Use
      • By Density
    • Key Takeaways
  14. East Asia Market Analysis 2020 to 2024 and Forecast 2025 to 2035, By Country
    • Historical Market Size Value (USD Million) & Volume (Units) Trend Analysis By Market Taxonomy, 2020 to 2024
    • Market Size Value (USD Million) & Volume (Units) Forecast By Market Taxonomy, 2025 to 2035
      • By Country
        • China
        • Japan
        • South Korea
      • By Material Type
      • By Packaging Type
      • By End Use
      • By Density
    • Market Attractiveness Analysis
      • By Country
      • By Material Type
      • By Packaging Type
      • By End Use
      • By Density
    • Key Takeaways
  15. South Asia Market Analysis 2020 to 2024 and Forecast 2025 to 2035, By Country
    • Historical Market Size Value (USD Million) & Volume (Units) Trend Analysis By Market Taxonomy, 2020 to 2024
    • Market Size Value (USD Million) & Volume (Units) Forecast By Market Taxonomy, 2025 to 2035
      • By Country
        • India
        • Thailand
        • Malaysia
        • Indonesia
        • Rest of South Asia
      • By Material Type
      • By Packaging Type
      • By End Use
      • By Density
    • Market Attractiveness Analysis
      • By Country
      • By Material Type
      • By Packaging Type
      • By End Use
      • By Density
    • Key Takeaways
  16. Oceania Market Analysis 2020 to 2024 and Forecast 2025 to 2035, By Country
    • Historical Market Size Value (USD Million) & Volume (Units) Trend Analysis By Market Taxonomy, 2020 to 2024
    • Market Size Value (USD Million) & Volume (Units) Forecast By Market Taxonomy, 2025 to 2035
      • By Country
        • Australia
        • New Zealand
      • By Material Type
      • By Packaging Type
      • By End Use
      • By Density
    • Market Attractiveness Analysis
      • By Country
      • By Material Type
      • By Packaging Type
      • By End Use
      • By Density
    • Key Takeaways
  17. MEA Market Analysis 2020 to 2024 and Forecast 2025 to 2035, By Country
    • Historical Market Size Value (USD Million) & Volume (Units) Trend Analysis By Market Taxonomy, 2020 to 2024
    • Market Size Value (USD Million) & Volume (Units) Forecast By Market Taxonomy, 2025 to 2035
      • By Country
        • GCC
        • Rest of MEA
      • By Material Type
      • By Packaging Type
      • By End Use
      • By Density
    • Market Attractiveness Analysis
      • By Country
      • By Material Type
      • By Packaging Type
      • By End Use
      • By Density
    • Key Takeaways
  18. Key Countries Market Analysis
    • USA
      • Pricing Analysis
      • Market Share Analysis, 2024
        • By Material Type
        • By Packaging Type
        • By End Use
        • By Density
    • Canada
      • Pricing Analysis
      • Market Share Analysis, 2024
        • By Material Type
        • By Packaging Type
        • By End Use
        • By Density
    • Brazil
      • Pricing Analysis
      • Market Share Analysis, 2024
        • By Material Type
        • By Packaging Type
        • By End Use
        • By Density
    • Mexico
      • Pricing Analysis
      • Market Share Analysis, 2024
        • By Material Type
        • By Packaging Type
        • By End Use
        • By Density
    • Argentina
      • Pricing Analysis
      • Market Share Analysis, 2024
        • By Material Type
        • By Packaging Type
        • By End Use
        • By Density
  19. Market Structure Analysis
    • Competition Dashboard
    • Competition Benchmarking
    • Market Share Analysis of Top Players
      • By Regional
      • By Material Type
      • By Packaging Type
      • By End Use
      • By Density
  20. Competition Analysis
    • Competition Deep Dive
      • EPE Foam
        • Overview
        • Product Portfolio
        • Profitability by Market Segments (Product/Age /Sales Channel/Region)
        • Sales Footprint
        • Strategy Overview
          • Marketing Strategy
          • Product Strategy
          • Channel Strategy
      • EZ Foam
        • Overview
        • Product Portfolio
        • Profitability by Market Segments (Product/Age /Sales Channel/Region)
        • Sales Footprint
        • Strategy Overview
          • Marketing Strategy
          • Product Strategy
          • Channel Strategy
      • Sealed Air Corporation
        • Overview
        • Product Portfolio
        • Profitability by Market Segments (Product/Age /Sales Channel/Region)
        • Sales Footprint
        • Strategy Overview
          • Marketing Strategy
          • Product Strategy
          • Channel Strategy
      • BASF SE
        • Overview
        • Product Portfolio
        • Profitability by Market Segments (Product/Age /Sales Channel/Region)
        • Sales Footprint
        • Strategy Overview
          • Marketing Strategy
          • Product Strategy
          • Channel Strategy
      • Bolloré Group
        • Overview
        • Product Portfolio
        • Profitability by Market Segments (Product/Age /Sales Channel/Region)
        • Sales Footprint
        • Strategy Overview
          • Marketing Strategy
          • Product Strategy
          • Channel Strategy
      • Polymer Technologies
        • Overview
        • Product Portfolio
        • Profitability by Market Segments (Product/Age /Sales Channel/Region)
        • Sales Footprint
        • Strategy Overview
          • Marketing Strategy
          • Product Strategy
          • Channel Strategy
      • Intertape Polymer Group
        • Overview
        • Product Portfolio
        • Profitability by Market Segments (Product/Age /Sales Channel/Region)
        • Sales Footprint
        • Strategy Overview
          • Marketing Strategy
          • Product Strategy
          • Channel Strategy
      • Aerofoam Industries
        • Overview
        • Product Portfolio
        • Profitability by Market Segments (Product/Age /Sales Channel/Region)
        • Sales Footprint
        • Strategy Overview
          • Marketing Strategy
          • Product Strategy
          • Channel Strategy
      • Foam King
        • Overview
        • Product Portfolio
        • Profitability by Market Segments (Product/Age /Sales Channel/Region)
        • Sales Footprint
        • Strategy Overview
          • Marketing Strategy
          • Product Strategy
          • Channel Strategy
      • Pregis LLC
        • Overview
        • Product Portfolio
        • Profitability by Market Segments (Product/Age /Sales Channel/Region)
        • Sales Footprint
        • Strategy Overview
          • Marketing Strategy
          • Product Strategy
          • Channel Strategy
  21. Assumptions & Acronyms Used
  22. Research Methodology

List of Tables

  • Table 1: Global Market Value (USD Million) Forecast by Region, 2020-2035
  • Table 2: Global Market Volume (Units) Forecast by Region, 2020-2035
  • Table 3: Global Market Value (USD Million) Forecast by Material Type , 2020-2035
  • Table 4: Global Market Volume (Units) Forecast by Material Type , 2020-2035
  • Table 5: Global Market Value (USD Million) Forecast by Packaging Type , 2020-2035
  • Table 6: Global Market Volume (Units) Forecast by Packaging Type , 2020-2035
  • Table 7: Global Market Value (USD Million) Forecast by End Use, 2020-2035
  • Table 8: Global Market Volume (Units) Forecast by End Use, 2020-2035
  • Table 9: Global Market Value (USD Million) Forecast by Density , 2020-2035
  • Table 10: Global Market Volume (Units) Forecast by Density , 2020-2035
  • Table 11: North America Market Value (USD Million) Forecast by Country, 2020-2035
  • Table 12: North America Market Volume (Units) Forecast by Country, 2020-2035
  • Table 13: North America Market Value (USD Million) Forecast by Material Type , 2020-2035
  • Table 14: North America Market Volume (Units) Forecast by Material Type , 2020-2035
  • Table 15: North America Market Value (USD Million) Forecast by Packaging Type , 2020-2035
  • Table 16: North America Market Volume (Units) Forecast by Packaging Type , 2020-2035
  • Table 17: North America Market Value (USD Million) Forecast by End Use, 2020-2035
  • Table 18: North America Market Volume (Units) Forecast by End Use, 2020-2035
  • Table 19: North America Market Value (USD Million) Forecast by Density , 2020-2035
  • Table 20: North America Market Volume (Units) Forecast by Density , 2020-2035
  • Table 21: Latin America Market Value (USD Million) Forecast by Country, 2020-2035
  • Table 22: Latin America Market Volume (Units) Forecast by Country, 2020-2035
  • Table 23: Latin America Market Value (USD Million) Forecast by Material Type , 2020-2035
  • Table 24: Latin America Market Volume (Units) Forecast by Material Type , 2020-2035
  • Table 25: Latin America Market Value (USD Million) Forecast by Packaging Type , 2020-2035
  • Table 26: Latin America Market Volume (Units) Forecast by Packaging Type , 2020-2035
  • Table 27: Latin America Market Value (USD Million) Forecast by End Use, 2020-2035
  • Table 28: Latin America Market Volume (Units) Forecast by End Use, 2020-2035
  • Table 29: Latin America Market Value (USD Million) Forecast by Density , 2020-2035
  • Table 30: Latin America Market Volume (Units) Forecast by Density , 2020-2035
  • Table 31: Europe Market Value (USD Million) Forecast by Country, 2020-2035
  • Table 32: Europe Market Volume (Units) Forecast by Country, 2020-2035
  • Table 33: Europe Market Value (USD Million) Forecast by Material Type , 2020-2035
  • Table 34: Europe Market Volume (Units) Forecast by Material Type , 2020-2035
  • Table 35: Europe Market Value (USD Million) Forecast by Packaging Type , 2020-2035
  • Table 36: Europe Market Volume (Units) Forecast by Packaging Type , 2020-2035
  • Table 37: Europe Market Value (USD Million) Forecast by End Use, 2020-2035
  • Table 38: Europe Market Volume (Units) Forecast by End Use, 2020-2035
  • Table 39: Europe Market Value (USD Million) Forecast by Density , 2020-2035
  • Table 40: Europe Market Volume (Units) Forecast by Density , 2020-2035
  • Table 41: East Asia Market Value (USD Million) Forecast by Country, 2020-2035
  • Table 42: East Asia Market Volume (Units) Forecast by Country, 2020-2035
  • Table 43: East Asia Market Value (USD Million) Forecast by Material Type , 2020-2035
  • Table 44: East Asia Market Volume (Units) Forecast by Material Type , 2020-2035
  • Table 45: East Asia Market Value (USD Million) Forecast by Packaging Type , 2020-2035
  • Table 46: East Asia Market Volume (Units) Forecast by Packaging Type , 2020-2035
  • Table 47: East Asia Market Value (USD Million) Forecast by End Use, 2020-2035
  • Table 48: East Asia Market Volume (Units) Forecast by End Use, 2020-2035
  • Table 49: East Asia Market Value (USD Million) Forecast by Density , 2020-2035
  • Table 50: East Asia Market Volume (Units) Forecast by Density , 2020-2035
  • Table 51: South Asia Market Value (USD Million) Forecast by Country, 2020-2035
  • Table 52: South Asia Market Volume (Units) Forecast by Country, 2020-2035
  • Table 53: South Asia Market Value (USD Million) Forecast by Material Type , 2020-2035
  • Table 54: South Asia Market Volume (Units) Forecast by Material Type , 2020-2035
  • Table 55: South Asia Market Value (USD Million) Forecast by Packaging Type , 2020-2035
  • Table 56: South Asia Market Volume (Units) Forecast by Packaging Type , 2020-2035
  • Table 57: South Asia Market Value (USD Million) Forecast by End Use, 2020-2035
  • Table 58: South Asia Market Volume (Units) Forecast by End Use, 2020-2035
  • Table 59: South Asia Market Value (USD Million) Forecast by Density , 2020-2035
  • Table 60: South Asia Market Volume (Units) Forecast by Density , 2020-2035
  • Table 61: Oceania Market Value (USD Million) Forecast by Country, 2020-2035
  • Table 62: Oceania Market Volume (Units) Forecast by Country, 2020-2035
  • Table 63: Oceania Market Value (USD Million) Forecast by Material Type , 2020-2035
  • Table 64: Oceania Market Volume (Units) Forecast by Material Type , 2020-2035
  • Table 65: Oceania Market Value (USD Million) Forecast by Packaging Type , 2020-2035
  • Table 66: Oceania Market Volume (Units) Forecast by Packaging Type , 2020-2035
  • Table 67: Oceania Market Value (USD Million) Forecast by End Use, 2020-2035
  • Table 68: Oceania Market Volume (Units) Forecast by End Use, 2020-2035
  • Table 69: Oceania Market Value (USD Million) Forecast by Density , 2020-2035
  • Table 70: Oceania Market Volume (Units) Forecast by Density , 2020-2035
  • Table 71: MEA Market Value (USD Million) Forecast by Country, 2020-2035
  • Table 72: MEA Market Volume (Units) Forecast by Country, 2020-2035
  • Table 73: MEA Market Value (USD Million) Forecast by Material Type , 2020-2035
  • Table 74: MEA Market Volume (Units) Forecast by Material Type , 2020-2035
  • Table 75: MEA Market Value (USD Million) Forecast by Packaging Type , 2020-2035
  • Table 76: MEA Market Volume (Units) Forecast by Packaging Type , 2020-2035
  • Table 77: MEA Market Value (USD Million) Forecast by End Use, 2020-2035
  • Table 78: MEA Market Volume (Units) Forecast by End Use, 2020-2035
  • Table 79: MEA Market Value (USD Million) Forecast by Density , 2020-2035
  • Table 80: MEA Market Volume (Units) Forecast by Density , 2020-2035

List of Figures

  • Figure 1: Global Market Volume (Units) Forecast 2020-2035
  • Figure 2: Global Market Pricing Analysis
  • Figure 3: Global Market Value (USD Million) Forecast 2020-2035
  • Figure 4: Global Market Value Share and BPS Analysis by Material Type , 2025 and 2035
  • Figure 5: Global Market Y-o-Y Growth Comparison by Material Type , 2025-2035
  • Figure 6: Global Market Attractiveness Analysis by Material Type
  • Figure 7: Global Market Value Share and BPS Analysis by Packaging Type , 2025 and 2035
  • Figure 8: Global Market Y-o-Y Growth Comparison by Packaging Type , 2025-2035
  • Figure 9: Global Market Attractiveness Analysis by Packaging Type
  • Figure 10: Global Market Value Share and BPS Analysis by End Use, 2025 and 2035
  • Figure 11: Global Market Y-o-Y Growth Comparison by End Use, 2025-2035
  • Figure 12: Global Market Attractiveness Analysis by End Use
  • Figure 13: Global Market Value Share and BPS Analysis by Density , 2025 and 2035
  • Figure 14: Global Market Y-o-Y Growth Comparison by Density , 2025-2035
  • Figure 15: Global Market Attractiveness Analysis by Density
  • Figure 16: Global Market Value (USD Million) Share and BPS Analysis by Region, 2025 and 2035
  • Figure 17: Global Market Y-o-Y Growth Comparison by Region, 2025-2035
  • Figure 18: Global Market Attractiveness Analysis by Region
  • Figure 19: North America Market Incremental $ Opportunity, 2025-2035
  • Figure 20: Latin America Market Incremental $ Opportunity, 2025-2035
  • Figure 21: Europe Market Incremental $ Opportunity, 2025-2035
  • Figure 22: East Asia Market Incremental $ Opportunity, 2025-2035
  • Figure 23: South Asia Market Incremental $ Opportunity, 2025-2035
  • Figure 24: Oceania Market Incremental $ Opportunity, 2025-2035
  • Figure 25: MEA Market Incremental $ Opportunity, 2025-2035
  • Figure 26: North America Market Value Share and BPS Analysis by Country, 2025 and 2035
  • Figure 27: North America Market Value Share and BPS Analysis by Material Type , 2025 and 2035
  • Figure 28: North America Market Y-o-Y Growth Comparison by Material Type , 2025-2035
  • Figure 29: North America Market Attractiveness Analysis by Material Type
  • Figure 30: North America Market Value Share and BPS Analysis by Packaging Type , 2025 and 2035
  • Figure 31: North America Market Y-o-Y Growth Comparison by Packaging Type , 2025-2035
  • Figure 32: North America Market Attractiveness Analysis by Packaging Type
  • Figure 33: North America Market Value Share and BPS Analysis by End Use, 2025 and 2035
  • Figure 34: North America Market Y-o-Y Growth Comparison by End Use, 2025-2035
  • Figure 35: North America Market Attractiveness Analysis by End Use
  • Figure 36: North America Market Value Share and BPS Analysis by Density , 2025 and 2035
  • Figure 37: North America Market Y-o-Y Growth Comparison by Density , 2025-2035
  • Figure 38: North America Market Attractiveness Analysis by Density
  • Figure 39: Latin America Market Value Share and BPS Analysis by Country, 2025 and 2035
  • Figure 40: Latin America Market Value Share and BPS Analysis by Material Type , 2025 and 2035
  • Figure 41: Latin America Market Y-o-Y Growth Comparison by Material Type , 2025-2035
  • Figure 42: Latin America Market Attractiveness Analysis by Material Type
  • Figure 43: Latin America Market Value Share and BPS Analysis by Packaging Type , 2025 and 2035
  • Figure 44: Latin America Market Y-o-Y Growth Comparison by Packaging Type , 2025-2035
  • Figure 45: Latin America Market Attractiveness Analysis by Packaging Type
  • Figure 46: Latin America Market Value Share and BPS Analysis by End Use, 2025 and 2035
  • Figure 47: Latin America Market Y-o-Y Growth Comparison by End Use, 2025-2035
  • Figure 48: Latin America Market Attractiveness Analysis by End Use
  • Figure 49: Latin America Market Value Share and BPS Analysis by Density , 2025 and 2035
  • Figure 50: Latin America Market Y-o-Y Growth Comparison by Density , 2025-2035
  • Figure 51: Latin America Market Attractiveness Analysis by Density
  • Figure 52: Europe Market Value Share and BPS Analysis by Country, 2025 and 2035
  • Figure 53: Europe Market Value Share and BPS Analysis by Material Type , 2025 and 2035
  • Figure 54: Europe Market Y-o-Y Growth Comparison by Material Type , 2025-2035
  • Figure 55: Europe Market Attractiveness Analysis by Material Type
  • Figure 56: Europe Market Value Share and BPS Analysis by Packaging Type , 2025 and 2035
  • Figure 57: Europe Market Y-o-Y Growth Comparison by Packaging Type , 2025-2035
  • Figure 58: Europe Market Attractiveness Analysis by Packaging Type
  • Figure 59: Europe Market Value Share and BPS Analysis by End Use, 2025 and 2035
  • Figure 60: Europe Market Y-o-Y Growth Comparison by End Use, 2025-2035
  • Figure 61: Europe Market Attractiveness Analysis by End Use
  • Figure 62: Europe Market Value Share and BPS Analysis by Density , 2025 and 2035
  • Figure 63: Europe Market Y-o-Y Growth Comparison by Density , 2025-2035
  • Figure 64: Europe Market Attractiveness Analysis by Density
  • Figure 65: East Asia Market Value Share and BPS Analysis by Country, 2025 and 2035
  • Figure 66: East Asia Market Value Share and BPS Analysis by Material Type , 2025 and 2035
  • Figure 67: East Asia Market Y-o-Y Growth Comparison by Material Type , 2025-2035
  • Figure 68: East Asia Market Attractiveness Analysis by Material Type
  • Figure 69: East Asia Market Value Share and BPS Analysis by Packaging Type , 2025 and 2035
  • Figure 70: East Asia Market Y-o-Y Growth Comparison by Packaging Type , 2025-2035
  • Figure 71: East Asia Market Attractiveness Analysis by Packaging Type
  • Figure 72: East Asia Market Value Share and BPS Analysis by End Use, 2025 and 2035
  • Figure 73: East Asia Market Y-o-Y Growth Comparison by End Use, 2025-2035
  • Figure 74: East Asia Market Attractiveness Analysis by End Use
  • Figure 75: East Asia Market Value Share and BPS Analysis by Density , 2025 and 2035
  • Figure 76: East Asia Market Y-o-Y Growth Comparison by Density , 2025-2035
  • Figure 77: East Asia Market Attractiveness Analysis by Density
  • Figure 78: South Asia Market Value Share and BPS Analysis by Country, 2025 and 2035
  • Figure 79: South Asia Market Value Share and BPS Analysis by Material Type , 2025 and 2035
  • Figure 80: South Asia Market Y-o-Y Growth Comparison by Material Type , 2025-2035
  • Figure 81: South Asia Market Attractiveness Analysis by Material Type
  • Figure 82: South Asia Market Value Share and BPS Analysis by Packaging Type , 2025 and 2035
  • Figure 83: South Asia Market Y-o-Y Growth Comparison by Packaging Type , 2025-2035
  • Figure 84: South Asia Market Attractiveness Analysis by Packaging Type
  • Figure 85: South Asia Market Value Share and BPS Analysis by End Use, 2025 and 2035
  • Figure 86: South Asia Market Y-o-Y Growth Comparison by End Use, 2025-2035
  • Figure 87: South Asia Market Attractiveness Analysis by End Use
  • Figure 88: South Asia Market Value Share and BPS Analysis by Density , 2025 and 2035
  • Figure 89: South Asia Market Y-o-Y Growth Comparison by Density , 2025-2035
  • Figure 90: South Asia Market Attractiveness Analysis by Density
  • Figure 91: Oceania Market Value Share and BPS Analysis by Country, 2025 and 2035
  • Figure 92: Oceania Market Value Share and BPS Analysis by Material Type , 2025 and 2035
  • Figure 93: Oceania Market Y-o-Y Growth Comparison by Material Type , 2025-2035
  • Figure 94: Oceania Market Attractiveness Analysis by Material Type
  • Figure 95: Oceania Market Value Share and BPS Analysis by Packaging Type , 2025 and 2035
  • Figure 96: Oceania Market Y-o-Y Growth Comparison by Packaging Type , 2025-2035
  • Figure 97: Oceania Market Attractiveness Analysis by Packaging Type
  • Figure 98: Oceania Market Value Share and BPS Analysis by End Use, 2025 and 2035
  • Figure 99: Oceania Market Y-o-Y Growth Comparison by End Use, 2025-2035
  • Figure 100: Oceania Market Attractiveness Analysis by End Use
  • Figure 101: Oceania Market Value Share and BPS Analysis by Density , 2025 and 2035
  • Figure 102: Oceania Market Y-o-Y Growth Comparison by Density , 2025-2035
  • Figure 103: Oceania Market Attractiveness Analysis by Density
  • Figure 104: MEA Market Value Share and BPS Analysis by Country, 2025 and 2035
  • Figure 105: MEA Market Value Share and BPS Analysis by Material Type , 2025 and 2035
  • Figure 106: MEA Market Y-o-Y Growth Comparison by Material Type , 2025-2035
  • Figure 107: MEA Market Attractiveness Analysis by Material Type
  • Figure 108: MEA Market Value Share and BPS Analysis by Packaging Type , 2025 and 2035
  • Figure 109: MEA Market Y-o-Y Growth Comparison by Packaging Type , 2025-2035
  • Figure 110: MEA Market Attractiveness Analysis by Packaging Type
  • Figure 111: MEA Market Value Share and BPS Analysis by End Use, 2025 and 2035
  • Figure 112: MEA Market Y-o-Y Growth Comparison by End Use, 2025-2035
  • Figure 113: MEA Market Attractiveness Analysis by End Use
  • Figure 114: MEA Market Value Share and BPS Analysis by Density , 2025 and 2035
  • Figure 115: MEA Market Y-o-Y Growth Comparison by Density , 2025-2035
  • Figure 116: MEA Market Attractiveness Analysis by Density
  • Figure 117: Global Market - Tier Structure Analysis
  • Figure 118: Global Market - Company Share Analysis

Frequently Asked Questions

What was the overall size of the Anti-static Foam Packaging Market in 2025?

The Anti-static Foam Packaging Market was valued at approximately USD 5.0 billion in 2025.

How big is the Anti-static Foam Packaging Market expected to be in 2035?

The market is projected to reach USD 7.5 billion by 2035, growing at a compound annual growth rate (CAGR) of 4.2% from 2025 to 2035.

What will drive the demand for Anti-static Foam Packaging during the forecast period?

The demand for Anti-static Foam Packaging Market is expected to be driven by the rising need for electrostatic discharge (ESD) protection in consumer electronics, expanding use in industrial applications for sensitive components, and growing demand for secure and damage-resistant packaging solutions in global supply chains.

List the top 5 countries contributing to the Anti-static Foam Packaging Market.

The top 5 countries contributing to the Anti-static Foam Packaging Market are the United States, China, Germany, Japan, and South Korea.

Which segment in type is expected to lead in the Anti-static Foam Packaging Market?

The Consumer Electronics and Industrial Applications segment is expected to lead the Anti-static Foam Packaging market, driven by the increasing demand for protective packaging in semiconductors, circuit boards, and precision electronic devices, along with heightened focus on safe transportation of industrial components.

Explore Similar Insights

Future Market Insights

Anti-static Foam Packaging Market