Anti-Static Backing Paper Market Size, Share, and Forecast Outlook 2025 to 2035

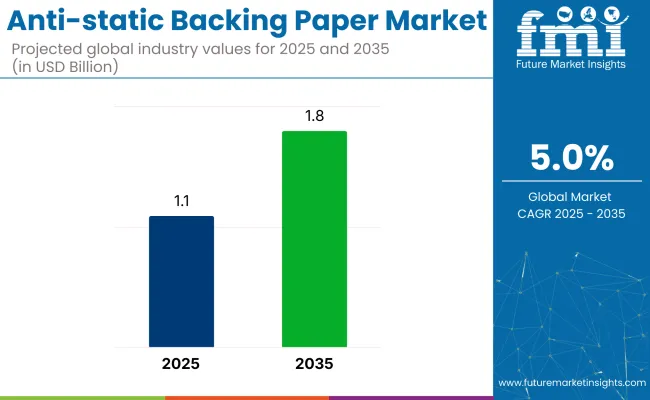
Global demand for anti-static backing paper is projected to rise from USD 1.1 billion in 2025 to USD 1.8 billion by 2035, reflecting a 5% CAGR. Electrostatic discharge risks have been mitigated through this paper, which forms a protective layer around circuit boards, semiconductors, and connectors during storage and shipment.
Quick Stats of Anti-static Backing Paper Market

  • Market Value (2025): USD 1.1 billion
  • Forecast Value (2035): USD 1.8 billion
  • Forecast CAGR: 5.0%
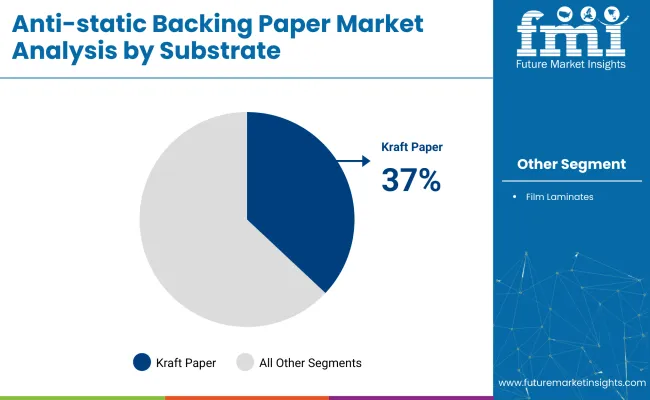
  • Product Leader in 2025: Kraft Paper Substrate (37% market share)
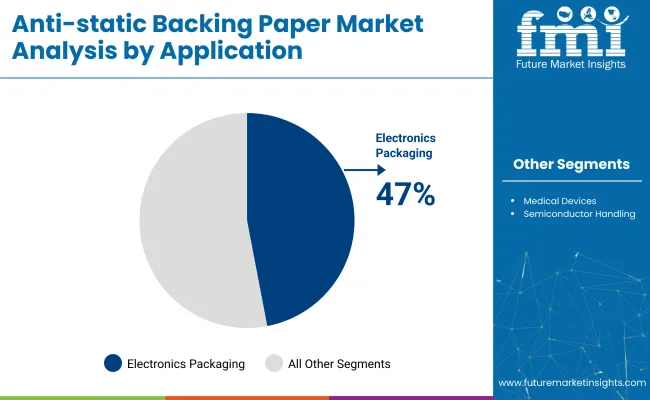
  • Top Application Segment: Electronics Packaging (47% share)
  • Key Growth Region: United States (highest CAGR at 5.6%)
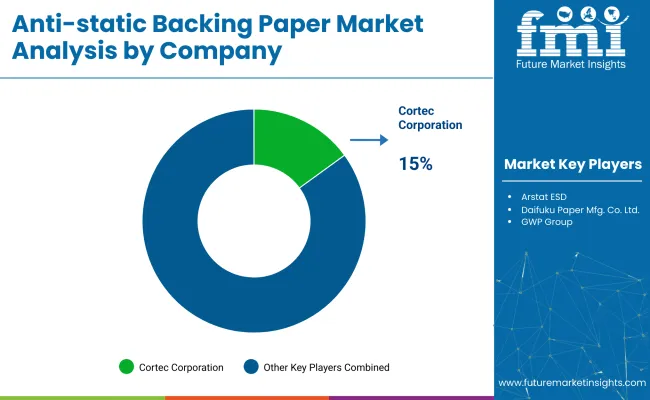
  • Leading Player: Cortec Corporation (15% market share)

Anti Static Backing Paper Market

Key Industry Attributes

Attribute Detail
Market Size (2025) USD 1.1 billion
Market Size (2035) USD 1.8 billion
CAGR (2025 to 2035) 5%

Output in consumer electronics has been accelerated, intensifying requirements for electrostatic shielding across smartphone, laptop, and wearable supply chains. Direct-to-consumer logistics have been reshaped by e-commerce, prompting adoption of packaging that secures components and meets strict ESD protocols. Growth is therefore anchored in continual semiconductor fabrication expansion and stricter performance benchmarks across global networks.

The anti-static backing paper segment comprises niche functionality within several broader categories, accounting for distinct shares based on its electrostatic control role in packaging. Within the anti-static and ESD packaging materials market, it represents nearly 6-8%, driven by its limited use compared to bags and foams.

In the overall ESD packaging market, it forms approximately 4-5%, as trays and molded plastics dominate volume. For the anti-static films and tapes segment, backing paper contributes 7-9%, mainly in lamination and adhesive liner applications. In the anti-static agent’s market, its share remains below 3%, since coatings span a broader set of substrates. Within barrier and functional paper products, it accounts for about 6%, used in semiconductor and electronics packaging where both insulation and static resistance are critical.

In 2024, Sherwin-Williams launched CM0485115, a conductive aerospace coating that converts composites and aluminum into anti-static surfaces without compromising integrity-critical for EV and aviation components. Cortec’sEcoSonic VpCI-125 ESD film combines corrosion inhibition with static dissipation, eliminating oils and reducing cleaning steps in aerospace and automotive packaging.

Meanwhile, nano-enhanced PET films using graphene and carbon nanotubes achieved 10⁶-10⁸ Ω/sq resistivity, exceeding MIL-PRF-81705D standards. These films protect sensitive devices like foldable OLEDs and semiconductor components. Together, these innovations reflect the shift toward multifunctional anti-static materials that meet both performance and regulatory demands across electronics, aerospace, and EV applications.

Analyzing Anti-Static Backing Paper Market by Top Investment Segments

Kraft substrates, polymer-coated surfaces, and semiconductor-specific applications define investment hotspots for 2025. Electronics packaging remains the anchor for volume, while Asia-Pacific’s manufacturing footprint consolidates its consumption lead. High-growth niches attract upgrades in cleanroom conversion and coating lines.

Kraft Paper Outpaces Alternatives in Static Control Applications

Kraft paper leads the substrate segment with a 37% share in 2025, owing to its mechanical resilience and compatibility with anti-static coatings. Manufacturers prefer its balance between tensile strength and charge dissipation. Soy-based coatings on kraft allow ESD protection while enabling recyclability-vital for bulk shipments of circuit boards and diagnostic tools. Sheet converters offer precision die-cutting, minimizing material waste. Paper mills in Asia have scaled kraft-based antistatic rolls to meet bulk supply agreements
  • Soy-coated kraft paper offers surface resistivity below 10^11 ohms.
  • Precision converters provide size-specific rolls, reducing trimming losses.
  • Lower raw material cost supports broader industrial adoption.

Anti Static Backing Paper Market Analysis By Substrate

Electronics Packaging Commands Nearly Half the Application Share

Electronics packaging controls 47% of anti-static backing paper usage, driven by circuit board and chip assembly processes. Static-sensitive components demand layered protection during shipping, and anti-static paper liners help prevent failures.

Packaging suppliers offer sheeted formats that comply with ESD and IPC standards, easing certification for export. Rollstock paper formats are used inside molded trays and corrugated boxes.
  • Sheeted liners support standard IPC and ESD packaging certifications.
  • Roll formats integrate with molded trays for compact component packaging.
  • Shipment volumes in consumer electronics raise repeat orders for liners.

Anti Static Backing Paper Market Analysis By Application

Polymer Coatings Take Majority Share on Performance Edge

Anti-static polymer coatings capture 53% of the market by offering reliable electrostatic dissipation across humidity variations. Unlike carbon-based alternatives, polymer coatings deliver transparent finishes and uniform conductivity.

Coating lines have shifted toward water-based polymers with embedded anti-static agents, reducing migration and surface wear. Paper treated with polymer coatings retains discharge performance over multiple handling cycles, making it suitable for long-haul logistics.

  • Water-based polymer coatings offer stable resistivity without visible residue.
  • Performance remains intact over repeated folding, creasing, and transit.
  • Gravure-coated kraft reels ensure uniform antistatic coverage at scale.

Asia-Pacific Leads Global Consumption at 49%

Asia-Pacific accounts for 49% of global anti-static backing paper consumption in 2025, anchored by China’s electronics production and South Korea’s semiconductor sector. Sheet converters and packagers in the region serve laptop, smartphone, and chip manufacturing clusters.

Domestic mills produce kraft paper with ESD coatings tailored for export electronics, reducing dependency on film-based imports. Wafer handling and circuit board exports continue to drive demand for coated paper liners.

  • High chip and board output sustain liner demand in East Asia.
  • Tariff schemes shorten sourcing lead times from regional producers.
  • Local paper mills offer antistatic customization for export electronics.

Semiconductor Handling Registers Fastest Growth at 12% CAGR

Semiconductor handling emerges as the fastest-growing segment at a 12% CAGR through 2035. As chip dimensions’ shrink and packaging becomes denser, wafer-level ESD protection grows more critical. Paper sheets designed for wafer cassettes reduce scratch risk and prevent latent electrostatic damage.

Manufacturers provide round-cut pads and slit rolls for fab use, with surface treatments that meet cleanroom standards. Rising investments in AI and automotive chips have increased per-fab consumption of anti-static packaging paper

  • Wafer-protective paper enables defect-free transport between fab stages.
  • Round-cut pads are tailored to 8” and 12” wafer diameters.
  • Cleanroom-compatible slitting reduces static buildup during packaging.

Top Anti-Static Backing Paper Market Dynamics

The anti-static backing paper market is being shaped by multi-functional product development, aerospace-grade material enhancements, and integration into semiconductor handling systems. With rising global electronics output and logistics demand, suppliers are aligning toward smarter coatings and composite layering to meet precise ESD compliance requirements.

New coating technologies and substrate blends reshape product strategy

  • Conductive polymer layering has improved thermal resistance and surface durability.
  • Increased deployment in semiconductor wafer and PCB transit packaging observed.
  • Graphene-loaded PET films now used in OLED screen protection formats.
  • Sherwin-Williams introduced CM0485115 for EV battery modules and composite surfaces.
  • Cortec’s VpCI-125 film integrates ESD protection with corrosion control in aerospace kits.
  • South Korean and Taiwanese suppliers expand automation in ESD paper converting lines.
  • Dual-layer films for anti-static and anti-corrosion use gain auto industry approval.

Raw material volatility limits pricing flexibility and supply stability
  • ESD polymer inputs face pricing pressure due to petrochemical volatility.
  • Kraft substrate sourcing disrupted by global pulp and paper shortages.
  • Complex coating-substrate pairing often delays commercial scale-up in new applications.

Top Countries Manufacturing, Synthesizing, Distributing, and Generating Demand for Anti-static Backing Paper

Country Wise Analysis Of Anti Static Backing Paper Market Cagr 2025 To 2035

Countries Projected CAGR (2025 to 2035)
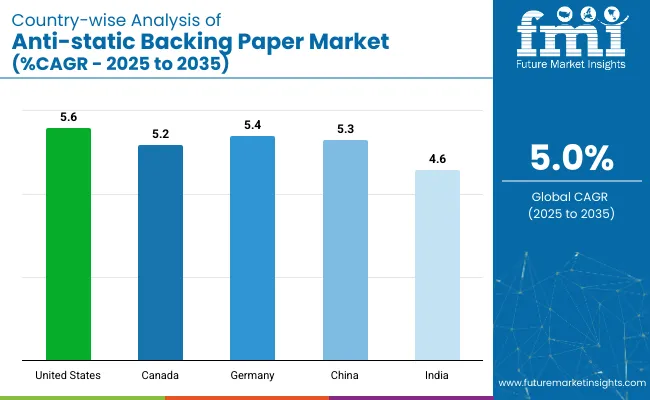
United States 5.6%
Canada 5.2%
Germany 5.4%
China 5.3%
India 4.6%

Global demand for anti-static backing paper is projected to grow at a 5.4% CAGR from 2025 to 2035. Among the five profiled markets out of 40 covered, the United States leads at 5.6%, followed by Germany at 5.4%, China at 5.3%, Canada at 5.2%, and India at 4.6%. These growth rates translate to a +4% premium for the United States, 0% for Germany, -2% for China, -4% for Canada, and -15% for India compared to the baseline.

Divergence in growth is driven by factors such as strong demand for anti-static backing paper in the United States, industrial growth in Germany, and moderate growth in China, Canada, and India, with India showing slower growth due to emerging market dynamics.

The report covers detailed analysis of 40+ countries, with the top five countries shared as a reference.

Growth Analysis of Anti-static Backing Paper Market in the United States

The USA market is forecast to grow at a CAGR of 5.6% from 2025 to 2035. Demand has remained centered on ESD-compliant packaging within electronics distribution and semiconductor fabrication. Anti-static liner formats are widely adopted by firms engaged in RFID label production, laser-cut films, and precision optics.

Material innovation in PE-coated kraft backers and humidity-resistant rolls has contributed to wider procurement by cleanroom suppliers. Investment in high-volume die-cutting equipment by Midwestern converters is boosting domestic capacity and response times for custom format orders.

  • RFID and sensor label producers adopting pink anti-static paper for high-speed lines
  • PE-coated formats replacing plastic liners in microchip logistics
  • Medical device suppliers using static-dissipative backers for sterile pouch sealing

Premium Outlook for Anti-static Backing Paper Market in Canada

Canada is anticipated to expand at 5.2% CAGR by 2035. Adoption has been rising among aerospace subcontractors and electronics recyclers requiring anti-static separation layers. The prevalence of anti-scuff and conductive packaging formats in Toronto’s 3PL warehouses supports consistent demand.

Provinces with strict EPR packaging rules have accelerated transition from polywrap to paper-based liners. Quebec’s flexo printing segment is using static-resistant backers for high-speed label runs. Government procurement norms for ESD-compliant packaging materials further support use in public-sector electronics supply.

  • Flexo printers sourcing static-dissipative kraft for label roll separation
  • Aerospace firms using ESD liners in avionics repackaging
  • Electronics recyclers relying on anti-static backing to prevent voltage discharge

In-Depth Analysis of the Anti-static Backing Paper Market in Germany

Demand in Germany is likely to grow at a CAGR of 5.4% through 2035, This reflects high penetration in automotive electronics, pharma logistics, and additive manufacturing. Static-free liners are mandated for sensitive component packaging by Tier-1 automotive suppliers.

Baden-Württemberg-based packaging houses are installing slitters customized for conductive coated kraft rolls. Pharma majors rely on anti-static liners to prevent packaging surface charge buildup in moisture-controlled environments. In 3D printing hubs, anti-static backers are included in filament spools to avoid particle clumping and static ignition risk.

  • Automotive microcontroller units shipped with static-resistant roll interleaving
  • Pharma fulfillment hubs using PE-coated ESD liners for friction-sensitive vials
  • Anti-static kraft sheets deployed in additive manufacturing filament storage

Demand Forecast for Anti-static Backing Paper Market in China

China is expected to grow at a CAGR of 5.3% between 2025 and 2035. Electronics manufacturing hubs in Suzhou, Shenzhen, and Chongqing are driving usage across printed circuit board (PCB) logistics and LED exports. Converter networks are scaling static-safe liner production for consumer electronics shipments.

National directives on ESD-sensitive component exports have widened adoption of conductive kraft papers. Major packaging providers are integrating slitting and coating lines in-house to lower reliance on import-grade materials.

  • PCB exporters adopting kraft-based anti-static sheets for interlayer separation
  • LED packaging firms shifting to paper liners in coastal zones
  • Central China facilities upgrading static-resistant coating for chip assembly logistics

Future Outlook for Anti-static Backing Paper Market in India

India’s market is projected to post a CAGR of 4.6% through 2035. Domestic ESD packaging infrastructure remains in development, but demand has risen from telecom, solar module, and capacitor supply chains. Bengaluru’s semiconductor startups and contract manufacturers have started using static-resistant liners in outbound shipments.

Tamil Nadu-based label producers and automotive component packagers are trialing PE-laminated kraft liners to meet export packaging standards. Growth is tempered by the limited availability of conductive coating facilities.
  • Solar module exporters wrapping panels with anti-static kraft backers
  • Bengaluru electronics hubs integrating coated kraft into box inserts
  • Auto part vendors using paper-based ESD liners for sensor kits

Leading Anti-Static Backing Paper Supplier

Anti Static Backing Paper Market Analysis By Company

Cortec Corporation has extended its anti-static backing paper portfolio by introducing variants designed for electronic and aerospace applications. The company focuses on proprietary coating technologies and offers customized solutions to meet export packaging demands. Arstat ESD has upgraded its manufacturing capabilities in North America and launched anti-static paper with consistent surface resistivity, targeting circuit board and IC packaging segments.

Daifuku Paper Mfg. Co., Ltd. has refined its kraft paper base to suit sensitive electronic components, positioning itself in precision packaging. GWP Group rolled out die-cut anti-static liners tailored for semiconductor exporters, supporting compliance with regional safety and handling requirements.

The anti-static backing paper market is moderately consolidated, with leading players holding long-term contracts in medical, electronics, and aerospace packaging. Entry is restricted by specialized coating equipment, resistivity compliance standards, and stringent client audits. Smaller firms serve niche orders, but face challenges scaling due to technical and quality validation requirements.

Recent Anti-Static Backing Paper Industry News

  • In February 2024, Arstat ESD acquired ElectroGuard Papers Inc., expanding its North American presence and adding defense and telecom sectors to its customer portfolio
  • In March 2024, GWP Group opened a new facility in Wiltshire to increase production of custom die-cut anti-static liners for semiconductor and electronics exporters.

Anti-static Backing Paper Market - Report Scope

Report Attributes Details
Market Size (2025) USD 1.1 billion
Projected Market Size (2035) USD 1.8 billion
CAGR (2025 to 2035) 5%
Base Year for Estimation 2024
Historical Period 2020 to 2024
Projections Period 2025 to 2035
Quantitative Units USD billion for value
Coating Types Analyzed Anti-static Polymer Coating, Conductive Layered Coating
Substrate Types Analyzed Kraft Paper, Film Laminates
Applications Analyzed Electronics Packaging (PCB Storage, IC Transport Trays), Medical Devices (Static-sensitive Diagnostic Tools), Semiconductor Handling (Wafer Protection, Cleanroom Sheets)
End-Use Industries Analyzed Electronics, Aerospace, Medical Devices, Semiconductor
Regions Covered North America, Europe, Asia-Pacific, Latin America, Middle East & Africa
Countries Covered United States, Canada, Germany, United Kingdom, France, China, India, Japan, South Korea, Brazil, Mexico, UAE, South Africa
Leading Players Cortec Corporation, Arstat ESD, Daifuku Paper Mfg. Co., Ltd., GWP Group
Additional Attributes Dollar sales growth by coating type, regional demand trends, competitive landscape, pricing strategies, packaging innovations, supply chain insights.

Leading Players

  • Cortec Corporation
  • Arstat ESD
  • Daifuku Paper Mfg. Co., Ltd.
  • GWP Group

Anti-static Backing Paper Market Analyzed by Key Investment Segments

By Coating Type:

The segment includes Anti-static Polymer Coating and Conductive Layered Coating

By Substrate:

This category comprises Kraft Paper and Film Laminates

By Application:

The market includes Electronics Packaging(PCB Storage, IC Transport Trays), Medical Devices (Static-sensitive Diagnostic Tools), Semiconductor Handling(Wafer Protection, Cleanroom Sheets)

By End-Use Industry:

Segmented into Electronics, Aerospace, Medical Devices, and Semiconductor sectors.By RegionIndustry performance assessed across North America, Europe, Asia-Pacific, Latin America, and the Middle East & Africa.

Table of Content

  1. Executive Summary
    • Global Market Outlook
    • Demand-side Trends
    • Supply-side Trends
    • Technology Roadmap Analysis
    • Analysis and Recommendations
  2. Market Overview
    • Market Coverage / Taxonomy
    • Market Definition / Scope / Limitations
  3. Market Background
    • Market Dynamics
      • Drivers
      • Restraints
      • Opportunity
      • Trends
    • Scenario Forecast
      • Demand in Optimistic Scenario
      • Demand in Likely Scenario
      • Demand in Conservative Scenario
    • Opportunity Map Analysis
    • Product Life Cycle Analysis
    • Supply Chain Analysis
      • Supply Side Participants and their Roles
        • Producers
        • Mid-Level Participants (Traders/ Agents/ Brokers)
        • Wholesalers and Distributors
      • Value Added and Value Created at Node in the Supply Chain
      • List of Raw Material Suppliers
      • List of Existing and Potential Buyer’s
    • Investment Feasibility Matrix
    • Value Chain Analysis
      • Profit Margin Analysis
      • Wholesalers and Distributors
      • Retailers
    • PESTLE and Porter’s Analysis
    • Regulatory Landscape
      • By Key Regions
      • By Key Countries
    • Regional Parent Market Outlook
    • Production and Consumption Statistics
    • Import and Export Statistics
  4. Global Market Analysis 2020 to 2024 and Forecast, 2025 to 2035
    • Historical Market Size Value (USD Billion) & Volume (MT) Analysis, 2020 to 2024
    • Current and Future Market Size Value (USD Billion) & Volume (MT) Projections, 2025 to 2035
      • Y-o-Y Growth Trend Analysis
      • Absolute $ Opportunity Analysis
  5. Global Market Pricing Analysis 2020 to 2024 and Forecast 2025 to 2035
  6. Global Market Analysis 2020 to 2024 and Forecast 2025 to 2035, By Coating Type
    • Introduction / Key Findings
    • Historical Market Size Value (USD Billion) & Volume (MT) Analysis By Coating Type, 2020 to 2024
    • Current and Future Market Size Value (USD Billion) & Volume (MT) Analysis and Forecast By Coating Type, 2025 to 2035
      • Anti-static Polymer Coating
      • Conductive Layered Coating
    • Y-o-Y Growth Trend Analysis By Coating Type, 2020 to 2024
    • Absolute $ Opportunity Analysis By Coating Type, 2025 to 2035
  7. Global Market Analysis 2020 to 2024 and Forecast 2025 to 2035, By Substrate
    • Introduction / Key Findings
    • Historical Market Size Value (USD Billion) & Volume (MT) Analysis By Substrate, 2020 to 2024
    • Current and Future Market Size Value (USD Billion) & Volume (MT) Analysis and Forecast By Substrate, 2025 to 2035
      • Kraft Paper
      • Film Laminates
    • Y-o-Y Growth Trend Analysis By Substrate, 2020 to 2024
    • Absolute $ Opportunity Analysis By Substrate, 2025 to 2035
  8. Global Market Analysis 2020 to 2024 and Forecast 2025 to 2035, By Application
    • Introduction / Key Findings
    • Historical Market Size Value (USD Billion) & Volume (MT) Analysis By Application, 2020 to 2024
    • Current and Future Market Size Value (USD Billion) & Volume (MT) Analysis and Forecast By Application, 2025 to 2035
      • Electronics Packaging
        • PCB Storage
        • IC Transport Trays
      • Medical Devices
        • Static-sensitive Diagnostic Tools
      • Semiconductor Handling
        • Wafer Protection
        • Cleanroom Sheets
      • Energy & Power
      • Others
    • Y-o-Y Growth Trend Analysis By Application, 2020 to 2024
    • Absolute $ Opportunity Analysis By Application, 2025 to 2035
  9. Global Market Analysis 2020 to 2024 and Forecast 2025 to 2035, By End-Use Industry
    • Introduction / Key Findings
    • Historical Market Size Value (USD Billion) & Volume (MT) Analysis By End-Use Industry, 2020 to 2024
    • Current and Future Market Size Value (USD Billion) & Volume (MT) Analysis and Forecast By End-Use Industry, 2025 to 2035
      • Electronics
      • Aerospace
      • Medical Devices
      • Semiconductor sectors
    • Y-o-Y Growth Trend Analysis By End-Use Industry, 2020 to 2024
    • Absolute $ Opportunity Analysis By End-Use Industry, 2025 to 2035
  10. Global Market Analysis 2020 to 2024 and Forecast 2025 to 2035, By Region
    • Introduction
    • Historical Market Size Value (USD Billion) & Volume (MT) Analysis By Region, 2020 to 2024
    • Current Market Size Value (USD Billion) & Volume (MT) Analysis and Forecast By Region, 2025 to 2035
      • North America
      • Latin America
      • Western Europe
      • Eastern Europe
      • East Asia
      • South Asia & Pacific
      • Middle East and Africa
    • Market Attractiveness Analysis By Region
  11. North America Market Analysis 2020 to 2024 and Forecast 2025 to 2035, By Country
    • Historical Market Size Value (USD Billion) & Volume (MT) Trend Analysis By Market Taxonomy, 2020 to 2024
    • Market Size Value (USD Billion) & Volume (MT) Forecast By Market Taxonomy, 2025 to 2035
      • By Country
        • USA
        • Canada
        • Mexico
      • By Coating Type
      • By Substrate
      • By Application
      • By End-Use Industry
    • Market Attractiveness Analysis
      • By Country
      • By Coating Type
      • By Substrate
      • By Application
      • By End-Use Industry
    • Key Takeaways
  12. Latin America Market Analysis 2020 to 2024 and Forecast 2025 to 2035, By Country
    • Historical Market Size Value (USD Billion) & Volume (MT) Trend Analysis By Market Taxonomy, 2020 to 2024
    • Market Size Value (USD Billion) & Volume (MT) Forecast By Market Taxonomy, 2025 to 2035
      • By Country
        • Brazil
        • Argentina
        • Rest of LATAM
      • By Coating Type
      • By Substrate
      • By Application
      • By End-Use Industry
    • Market Attractiveness Analysis
      • By Country
      • By Coating Type
      • By Substrate
      • By Application
      • By End-Use Industry
    • Key Takeaways
  13. Western Europe Market Analysis 2020 to 2024 and Forecast 2025 to 2035, By Country
    • Historical Market Size Value (USD Billion) & Volume (MT) Trend Analysis By Market Taxonomy, 2020 to 2024
    • Market Size Value (USD Billion) & Volume (MT) Forecast By Market Taxonomy, 2025 to 2035
      • By Country
        • Germany
        • Italy
        • France
        • UK
        • Spain
        • BENELUX
        • Nordic
        • Rest of W.Europe
      • By Coating Type
      • By Substrate
      • By Application
      • By End-Use Industry
    • Market Attractiveness Analysis
      • By Country
      • By Coating Type
      • By Substrate
      • By Application
      • By End-Use Industry
    • Key Takeaways
  14. Eastern Europe Market Analysis 2020 to 2024 and Forecast 2025 to 2035, By Country
    • Historical Market Size Value (USD Billion) & Volume (MT) Trend Analysis By Market Taxonomy, 2020 to 2024
    • Market Size Value (USD Billion) & Volume (MT) Forecast By Market Taxonomy, 2025 to 2035
      • By Country
        • Russia
        • Hungary
        • Poland
        • Balkan & Baltics
        • Rest of E. Europe
      • By Coating Type
      • By Substrate
      • By Application
      • By End-Use Industry
    • Market Attractiveness Analysis
      • By Country
      • By Coating Type
      • By Substrate
      • By Application
      • By End-Use Industry
    • Key Takeaways
  15. East Asia Market Analysis 2020 to 2024 and Forecast 2025 to 2035, By Country
    • Historical Market Size Value (USD Billion) & Volume (MT) Trend Analysis By Market Taxonomy, 2020 to 2024
    • Market Size Value (USD Billion) & Volume (MT) Forecast By Market Taxonomy, 2025 to 2035
      • By Country
        • China
        • Japan
        • South Korea
      • By Coating Type
      • By Substrate
      • By Application
      • By End-Use Industry
    • Market Attractiveness Analysis
      • By Country
      • By Coating Type
      • By Substrate
      • By Application
      • By End-Use Industry
    • Key Takeaways
  16. South Asia & Pacific Market Analysis 2020 to 2024 and Forecast 2025 to 2035, By Country
    • Historical Market Size Value (USD Billion) & Volume (MT) Trend Analysis By Market Taxonomy, 2020 to 2024
    • Market Size Value (USD Billion) & Volume (MT) Forecast By Market Taxonomy, 2025 to 2035
      • By Country
        • India
        • Australia & New Zealand
        • ASEAN
        • Rest of SAP
      • By Coating Type
      • By Substrate
      • By Application
      • By End-Use Industry
    • Market Attractiveness Analysis
      • By Country
      • By Coating Type
      • By Substrate
      • By Application
      • By End-Use Industry
    • Key Takeaways
  17. Middle East and Africa Market Analysis 2020 to 2024 and Forecast 2025 to 2035, By Country
    • Historical Market Size Value (USD Billion) & Volume (MT) Trend Analysis By Market Taxonomy, 2020 to 2024
    • Market Size Value (USD Billion) & Volume (MT) Forecast By Market Taxonomy, 2025 to 2035
      • By Country
        • GCC Countries
        • Northern Africa
        • South Africa
        • Turkiye
        • Rest of MEA
      • By Coating Type
      • By Substrate
      • By Application
      • By End-Use Industry
    • Market Attractiveness Analysis
      • By Country
      • By Coating Type
      • By Substrate
      • By Application
      • By End-Use Industry
    • Key Takeaways
  18. Key Countries Market Analysis
    • USA
      • Pricing Analysis
      • Market Share Analysis, 2024
        • By Coating Type
        • By Substrate
        • By Application
        • By End-Use Industry
    • Canada
      • Pricing Analysis
      • Market Share Analysis, 2024
        • By Coating Type
        • By Substrate
        • By Application
        • By End-Use Industry
    • Brazil
      • Pricing Analysis
      • Market Share Analysis, 2024
        • By Coating Type
        • By Substrate
        • By Application
        • By End-Use Industry
    • Mexico
      • Pricing Analysis
      • Market Share Analysis, 2024
        • By Coating Type
        • By Substrate
        • By Application
        • By End-Use Industry
    • Argentina
      • Pricing Analysis
      • Market Share Analysis, 2024
        • By Coating Type
        • By Substrate
        • By Application
        • By End-Use Industry
  19. Market Structure Analysis
    • Competition Dashboard
    • Competition Benchmarking
    • Market Share Analysis of Top Players
      • By Regional
      • By Coating Type
      • By Substrate
      • By Application
      • By End-Use Industry
  20. Competition Analysis
    • Competition Deep Dive
      • Cortec Corporation
        • Overview
        • Product Portfolio
        • Profitability by Market Segments (Product/Age /Sales Channel/Region)
        • Sales Footprint
        • Strategy Overview
          • Marketing Strategy
          • Product Strategy
          • Channel Strategy
      • Arstat ESD
        • Overview
        • Product Portfolio
        • Profitability by Market Segments (Product/Age /Sales Channel/Region)
        • Sales Footprint
        • Strategy Overview
          • Marketing Strategy
          • Product Strategy
          • Channel Strategy
      • Daifuku Paper Mfg. Co., Ltd.
        • Overview
        • Product Portfolio
        • Profitability by Market Segments (Product/Age /Sales Channel/Region)
        • Sales Footprint
        • Strategy Overview
          • Marketing Strategy
          • Product Strategy
          • Channel Strategy
      • GWP Group
        • Overview
        • Product Portfolio
        • Profitability by Market Segments (Product/Age /Sales Channel/Region)
        • Sales Footprint
        • Strategy Overview
          • Marketing Strategy
          • Product Strategy
          • Channel Strategy
  21. Assumptions & Acronyms Used
  22. Research Methodology

List of Tables

  • Table 1: Global Market Value (USD Billion) Forecast by Region, 2020 to 2035
  • Table 2: Global Market Volume (MT) Forecast by Region, 2020 to 2035
  • Table 3: Global Market Value (USD Billion) Forecast by Coating Type, 2020 to 2035
  • Table 4: Global Market Volume (MT) Forecast by Coating Type, 2020 to 2035
  • Table 5: Global Market Value (USD Billion) Forecast by Substrate, 2020 to 2035
  • Table 6: Global Market Volume (MT) Forecast by Substrate, 2020 to 2035
  • Table 7: Global Market Value (USD Billion) Forecast by Application, 2020 to 2035
  • Table 8: Global Market Volume (MT) Forecast by Application, 2020 to 2035
  • Table 9: Global Market Value (USD Billion) Forecast by End-Use Industry, 2020 to 2035
  • Table 10: Global Market Volume (MT) Forecast by End-Use Industry, 2020 to 2035
  • Table 11: North America Market Value (USD Billion) Forecast by Country, 2020 to 2035
  • Table 12: North America Market Volume (MT) Forecast by Country, 2020 to 2035
  • Table 13: North America Market Value (USD Billion) Forecast by Coating Type, 2020 to 2035
  • Table 14: North America Market Volume (MT) Forecast by Coating Type, 2020 to 2035
  • Table 15: North America Market Value (USD Billion) Forecast by Substrate, 2020 to 2035
  • Table 16: North America Market Volume (MT) Forecast by Substrate, 2020 to 2035
  • Table 17: North America Market Value (USD Billion) Forecast by Application, 2020 to 2035
  • Table 18: North America Market Volume (MT) Forecast by Application, 2020 to 2035
  • Table 19: North America Market Value (USD Billion) Forecast by End-Use Industry, 2020 to 2035
  • Table 20: North America Market Volume (MT) Forecast by End-Use Industry, 2020 to 2035
  • Table 21: Latin America Market Value (USD Billion) Forecast by Country, 2020 to 2035
  • Table 22: Latin America Market Volume (MT) Forecast by Country, 2020 to 2035
  • Table 23: Latin America Market Value (USD Billion) Forecast by Coating Type, 2020 to 2035
  • Table 24: Latin America Market Volume (MT) Forecast by Coating Type, 2020 to 2035
  • Table 25: Latin America Market Value (USD Billion) Forecast by Substrate, 2020 to 2035
  • Table 26: Latin America Market Volume (MT) Forecast by Substrate, 2020 to 2035
  • Table 27: Latin America Market Value (USD Billion) Forecast by Application, 2020 to 2035
  • Table 28: Latin America Market Volume (MT) Forecast by Application, 2020 to 2035
  • Table 29: Latin America Market Value (USD Billion) Forecast by End-Use Industry, 2020 to 2035
  • Table 30: Latin America Market Volume (MT) Forecast by End-Use Industry, 2020 to 2035
  • Table 31: Western Europe Market Value (USD Billion) Forecast by Country, 2020 to 2035
  • Table 32: Western Europe Market Volume (MT) Forecast by Country, 2020 to 2035
  • Table 33: Western Europe Market Value (USD Billion) Forecast by Coating Type, 2020 to 2035
  • Table 34: Western Europe Market Volume (MT) Forecast by Coating Type, 2020 to 2035
  • Table 35: Western Europe Market Value (USD Billion) Forecast by Substrate, 2020 to 2035
  • Table 36: Western Europe Market Volume (MT) Forecast by Substrate, 2020 to 2035
  • Table 37: Western Europe Market Value (USD Billion) Forecast by Application, 2020 to 2035
  • Table 38: Western Europe Market Volume (MT) Forecast by Application, 2020 to 2035
  • Table 39: Western Europe Market Value (USD Billion) Forecast by End-Use Industry, 2020 to 2035
  • Table 40: Western Europe Market Volume (MT) Forecast by End-Use Industry, 2020 to 2035
  • Table 41: Eastern Europe Market Value (USD Billion) Forecast by Country, 2020 to 2035
  • Table 42: Eastern Europe Market Volume (MT) Forecast by Country, 2020 to 2035
  • Table 43: Eastern Europe Market Value (USD Billion) Forecast by Coating Type, 2020 to 2035
  • Table 44: Eastern Europe Market Volume (MT) Forecast by Coating Type, 2020 to 2035
  • Table 45: Eastern Europe Market Value (USD Billion) Forecast by Substrate, 2020 to 2035
  • Table 46: Eastern Europe Market Volume (MT) Forecast by Substrate, 2020 to 2035
  • Table 47: Eastern Europe Market Value (USD Billion) Forecast by Application, 2020 to 2035
  • Table 48: Eastern Europe Market Volume (MT) Forecast by Application, 2020 to 2035
  • Table 49: Eastern Europe Market Value (USD Billion) Forecast by End-Use Industry, 2020 to 2035
  • Table 50: Eastern Europe Market Volume (MT) Forecast by End-Use Industry, 2020 to 2035
  • Table 51: East Asia Market Value (USD Billion) Forecast by Country, 2020 to 2035
  • Table 52: East Asia Market Volume (MT) Forecast by Country, 2020 to 2035
  • Table 53: East Asia Market Value (USD Billion) Forecast by Coating Type, 2020 to 2035
  • Table 54: East Asia Market Volume (MT) Forecast by Coating Type, 2020 to 2035
  • Table 55: East Asia Market Value (USD Billion) Forecast by Substrate, 2020 to 2035
  • Table 56: East Asia Market Volume (MT) Forecast by Substrate, 2020 to 2035
  • Table 57: East Asia Market Value (USD Billion) Forecast by Application, 2020 to 2035
  • Table 58: East Asia Market Volume (MT) Forecast by Application, 2020 to 2035
  • Table 59: East Asia Market Value (USD Billion) Forecast by End-Use Industry, 2020 to 2035
  • Table 60: East Asia Market Volume (MT) Forecast by End-Use Industry, 2020 to 2035
  • Table 61: South Asia & Pacific Market Value (USD Billion) Forecast by Country, 2020 to 2035
  • Table 62: South Asia & Pacific Market Volume (MT) Forecast by Country, 2020 to 2035
  • Table 63: South Asia & Pacific Market Value (USD Billion) Forecast by Coating Type, 2020 to 2035
  • Table 64: South Asia & Pacific Market Volume (MT) Forecast by Coating Type, 2020 to 2035
  • Table 65: South Asia & Pacific Market Value (USD Billion) Forecast by Substrate, 2020 to 2035
  • Table 66: South Asia & Pacific Market Volume (MT) Forecast by Substrate, 2020 to 2035
  • Table 67: South Asia & Pacific Market Value (USD Billion) Forecast by Application, 2020 to 2035
  • Table 68: South Asia & Pacific Market Volume (MT) Forecast by Application, 2020 to 2035
  • Table 69: South Asia & Pacific Market Value (USD Billion) Forecast by End-Use Industry, 2020 to 2035
  • Table 70: South Asia & Pacific Market Volume (MT) Forecast by End-Use Industry, 2020 to 2035
  • Table 71: Middle East and Africa Market Value (USD Billion) Forecast by Country, 2020 to 2035
  • Table 72: Middle East and Africa Market Volume (MT) Forecast by Country, 2020 to 2035
  • Table 73: Middle East and Africa Market Value (USD Billion) Forecast by Coating Type, 2020 to 2035
  • Table 74: Middle East and Africa Market Volume (MT) Forecast by Coating Type, 2020 to 2035
  • Table 75: Middle East and Africa Market Value (USD Billion) Forecast by Substrate, 2020 to 2035
  • Table 76: Middle East and Africa Market Volume (MT) Forecast by Substrate, 2020 to 2035
  • Table 77: Middle East and Africa Market Value (USD Billion) Forecast by Application, 2020 to 2035
  • Table 78: Middle East and Africa Market Volume (MT) Forecast by Application, 2020 to 2035
  • Table 79: Middle East and Africa Market Value (USD Billion) Forecast by End-Use Industry, 2020 to 2035
  • Table 80: Middle East and Africa Market Volume (MT) Forecast by End-Use Industry, 2020 to 2035

List of Figures

  • Figure 1: Global Market Volume (MT) Forecast 2020 to 2035
  • Figure 2: Global Market Pricing Analysis
  • Figure 3: Global Market Value (USD Billion) Forecast 2020 to 2035
  • Figure 4: Global Market Value Share and BPS Analysis by Coating Type, 2025 and 2035
  • Figure 5: Global Market Y-o-Y Growth Comparison by Coating Type, 2025 to 2035
  • Figure 6: Global Market Attractiveness Analysis by Coating Type
  • Figure 7: Global Market Value Share and BPS Analysis by Substrate, 2025 and 2035
  • Figure 8: Global Market Y-o-Y Growth Comparison by Substrate, 2025 to 2035
  • Figure 9: Global Market Attractiveness Analysis by Substrate
  • Figure 10: Global Market Value Share and BPS Analysis by Application, 2025 and 2035
  • Figure 11: Global Market Y-o-Y Growth Comparison by Application, 2025 to 2035
  • Figure 12: Global Market Attractiveness Analysis by Application
  • Figure 13: Global Market Value Share and BPS Analysis by End-Use Industry, 2025 and 2035
  • Figure 14: Global Market Y-o-Y Growth Comparison by End-Use Industry, 2025 to 2035
  • Figure 15: Global Market Attractiveness Analysis by End-Use Industry
  • Figure 16: Global Market Value (USD Billion) Share and BPS Analysis by Region, 2025 and 2035
  • Figure 17: Global Market Y-o-Y Growth Comparison by Region, 2025 to 2035
  • Figure 18: Global Market Attractiveness Analysis by Region
  • Figure 19: North America Market Incremental $ Opportunity, 2025 to 2035
  • Figure 20: Latin America Market Incremental $ Opportunity, 2025 to 2035
  • Figure 21: Western Europe Market Incremental $ Opportunity, 2025 to 2035
  • Figure 22: Eastern Europe Market Incremental $ Opportunity, 2025 to 2035
  • Figure 23: East Asia Market Incremental $ Opportunity, 2025 to 2035
  • Figure 24: South Asia & Pacific Market Incremental $ Opportunity, 2025 to 2035
  • Figure 25: Middle East and Africa Market Incremental $ Opportunity, 2025 to 2035
  • Figure 26: North America Market Value Share and BPS Analysis by Country, 2025 and 2035
  • Figure 27: North America Market Value Share and BPS Analysis by Coating Type, 2025 and 2035
  • Figure 28: North America Market Y-o-Y Growth Comparison by Coating Type, 2025 to 2035
  • Figure 29: North America Market Attractiveness Analysis by Coating Type
  • Figure 30: North America Market Value Share and BPS Analysis by Substrate, 2025 and 2035
  • Figure 31: North America Market Y-o-Y Growth Comparison by Substrate, 2025 to 2035
  • Figure 32: North America Market Attractiveness Analysis by Substrate
  • Figure 33: North America Market Value Share and BPS Analysis by Application, 2025 and 2035
  • Figure 34: North America Market Y-o-Y Growth Comparison by Application, 2025 to 2035
  • Figure 35: North America Market Attractiveness Analysis by Application
  • Figure 36: North America Market Value Share and BPS Analysis by End-Use Industry, 2025 and 2035
  • Figure 37: North America Market Y-o-Y Growth Comparison by End-Use Industry, 2025 to 2035
  • Figure 38: North America Market Attractiveness Analysis by End-Use Industry
  • Figure 39: Latin America Market Value Share and BPS Analysis by Country, 2025 and 2035
  • Figure 40: Latin America Market Value Share and BPS Analysis by Coating Type, 2025 and 2035
  • Figure 41: Latin America Market Y-o-Y Growth Comparison by Coating Type, 2025 to 2035
  • Figure 42: Latin America Market Attractiveness Analysis by Coating Type
  • Figure 43: Latin America Market Value Share and BPS Analysis by Substrate, 2025 and 2035
  • Figure 44: Latin America Market Y-o-Y Growth Comparison by Substrate, 2025 to 2035
  • Figure 45: Latin America Market Attractiveness Analysis by Substrate
  • Figure 46: Latin America Market Value Share and BPS Analysis by Application, 2025 and 2035
  • Figure 47: Latin America Market Y-o-Y Growth Comparison by Application, 2025 to 2035
  • Figure 48: Latin America Market Attractiveness Analysis by Application
  • Figure 49: Latin America Market Value Share and BPS Analysis by End-Use Industry, 2025 and 2035
  • Figure 50: Latin America Market Y-o-Y Growth Comparison by End-Use Industry, 2025 to 2035
  • Figure 51: Latin America Market Attractiveness Analysis by End-Use Industry
  • Figure 52: Western Europe Market Value Share and BPS Analysis by Country, 2025 and 2035
  • Figure 53: Western Europe Market Value Share and BPS Analysis by Coating Type, 2025 and 2035
  • Figure 54: Western Europe Market Y-o-Y Growth Comparison by Coating Type, 2025 to 2035
  • Figure 55: Western Europe Market Attractiveness Analysis by Coating Type
  • Figure 56: Western Europe Market Value Share and BPS Analysis by Substrate, 2025 and 2035
  • Figure 57: Western Europe Market Y-o-Y Growth Comparison by Substrate, 2025 to 2035
  • Figure 58: Western Europe Market Attractiveness Analysis by Substrate
  • Figure 59: Western Europe Market Value Share and BPS Analysis by Application, 2025 and 2035
  • Figure 60: Western Europe Market Y-o-Y Growth Comparison by Application, 2025 to 2035
  • Figure 61: Western Europe Market Attractiveness Analysis by Application
  • Figure 62: Western Europe Market Value Share and BPS Analysis by End-Use Industry, 2025 and 2035
  • Figure 63: Western Europe Market Y-o-Y Growth Comparison by End-Use Industry, 2025 to 2035
  • Figure 64: Western Europe Market Attractiveness Analysis by End-Use Industry
  • Figure 65: Eastern Europe Market Value Share and BPS Analysis by Country, 2025 and 2035
  • Figure 66: Eastern Europe Market Value Share and BPS Analysis by Coating Type, 2025 and 2035
  • Figure 67: Eastern Europe Market Y-o-Y Growth Comparison by Coating Type, 2025 to 2035
  • Figure 68: Eastern Europe Market Attractiveness Analysis by Coating Type
  • Figure 69: Eastern Europe Market Value Share and BPS Analysis by Substrate, 2025 and 2035
  • Figure 70: Eastern Europe Market Y-o-Y Growth Comparison by Substrate, 2025 to 2035
  • Figure 71: Eastern Europe Market Attractiveness Analysis by Substrate
  • Figure 72: Eastern Europe Market Value Share and BPS Analysis by Application, 2025 and 2035
  • Figure 73: Eastern Europe Market Y-o-Y Growth Comparison by Application, 2025 to 2035
  • Figure 74: Eastern Europe Market Attractiveness Analysis by Application
  • Figure 75: Eastern Europe Market Value Share and BPS Analysis by End-Use Industry, 2025 and 2035
  • Figure 76: Eastern Europe Market Y-o-Y Growth Comparison by End-Use Industry, 2025 to 2035
  • Figure 77: Eastern Europe Market Attractiveness Analysis by End-Use Industry
  • Figure 78: East Asia Market Value Share and BPS Analysis by Country, 2025 and 2035
  • Figure 79: East Asia Market Value Share and BPS Analysis by Coating Type, 2025 and 2035
  • Figure 80: East Asia Market Y-o-Y Growth Comparison by Coating Type, 2025 to 2035
  • Figure 81: East Asia Market Attractiveness Analysis by Coating Type
  • Figure 82: East Asia Market Value Share and BPS Analysis by Substrate, 2025 and 2035
  • Figure 83: East Asia Market Y-o-Y Growth Comparison by Substrate, 2025 to 2035
  • Figure 84: East Asia Market Attractiveness Analysis by Substrate
  • Figure 85: East Asia Market Value Share and BPS Analysis by Application, 2025 and 2035
  • Figure 86: East Asia Market Y-o-Y Growth Comparison by Application, 2025 to 2035
  • Figure 87: East Asia Market Attractiveness Analysis by Application
  • Figure 88: East Asia Market Value Share and BPS Analysis by End-Use Industry, 2025 and 2035
  • Figure 89: East Asia Market Y-o-Y Growth Comparison by End-Use Industry, 2025 to 2035
  • Figure 90: East Asia Market Attractiveness Analysis by End-Use Industry
  • Figure 91: South Asia & Pacific Market Value Share and BPS Analysis by Country, 2025 and 2035
  • Figure 92: South Asia & Pacific Market Value Share and BPS Analysis by Coating Type, 2025 and 2035
  • Figure 93: South Asia & Pacific Market Y-o-Y Growth Comparison by Coating Type, 2025 to 2035
  • Figure 94: South Asia & Pacific Market Attractiveness Analysis by Coating Type
  • Figure 95: South Asia & Pacific Market Value Share and BPS Analysis by Substrate, 2025 and 2035
  • Figure 96: South Asia & Pacific Market Y-o-Y Growth Comparison by Substrate, 2025 to 2035
  • Figure 97: South Asia & Pacific Market Attractiveness Analysis by Substrate
  • Figure 98: South Asia & Pacific Market Value Share and BPS Analysis by Application, 2025 and 2035
  • Figure 99: South Asia & Pacific Market Y-o-Y Growth Comparison by Application, 2025 to 2035
  • Figure 100: South Asia & Pacific Market Attractiveness Analysis by Application
  • Figure 101: South Asia & Pacific Market Value Share and BPS Analysis by End-Use Industry, 2025 and 2035
  • Figure 102: South Asia & Pacific Market Y-o-Y Growth Comparison by End-Use Industry, 2025 to 2035
  • Figure 103: South Asia & Pacific Market Attractiveness Analysis by End-Use Industry
  • Figure 104: Middle East and Africa Market Value Share and BPS Analysis by Country, 2025 and 2035
  • Figure 105: Middle East and Africa Market Value Share and BPS Analysis by Coating Type, 2025 and 2035
  • Figure 106: Middle East and Africa Market Y-o-Y Growth Comparison by Coating Type, 2025 to 2035
  • Figure 107: Middle East and Africa Market Attractiveness Analysis by Coating Type
  • Figure 108: Middle East and Africa Market Value Share and BPS Analysis by Substrate, 2025 and 2035
  • Figure 109: Middle East and Africa Market Y-o-Y Growth Comparison by Substrate, 2025 to 2035
  • Figure 110: Middle East and Africa Market Attractiveness Analysis by Substrate
  • Figure 111: Middle East and Africa Market Value Share and BPS Analysis by Application, 2025 and 2035
  • Figure 112: Middle East and Africa Market Y-o-Y Growth Comparison by Application, 2025 to 2035
  • Figure 113: Middle East and Africa Market Attractiveness Analysis by Application
  • Figure 114: Middle East and Africa Market Value Share and BPS Analysis by End-Use Industry, 2025 and 2035
  • Figure 115: Middle East and Africa Market Y-o-Y Growth Comparison by End-Use Industry, 2025 to 2035
  • Figure 116: Middle East and Africa Market Attractiveness Analysis by End-Use Industry
  • Figure 117: Global Market - Tier Structure Analysis
  • Figure 118: Global Market - Company Share Analysis

Frequently Asked Questions

What is the projected market size of the anti-static backing paper market in 2025 and 2035?

The market size is projected to be USD 1.1 billion in 2025 and USD 1.8 billion by 2035.

What is the expected CAGR for the anti-static backing paper market from 2025 to 2035?

The expected CAGR is 5% from 2025 to 2035.

Which substrate dominates the anti-static backing paper market in 2025?

Kraft paper dominates the substrate segment with a 37% share in 2025.

Who is the leading company in the anti-static backing paper market?

Cortec Corporation is the leading company in the market, holding a 15% market share.

What is the projected CAGR of the anti-static backing paper market in India?

India is projected to grow at a CAGR of 4.6% from 2025 to 2035.

Explore Similar Insights

Future Market Insights

Anti-static Backing Paper Market