The Stationery Product Market is estimated to be valued at USD 169.4 billion in 2025 and is projected to reach USD 276.9 billion by 2035, registering a compound annual growth rate (CAGR) of 5.0% over the forecast period.
The Stationery Product market is witnessing steady growth, driven by increasing demand from educational institutions, offices, and commercial establishments. Rising awareness of quality stationery, combined with growing focus on organized documentation and efficient office management, is supporting market expansion. The adoption of paper products, pens, and other office supplies is being reinforced by institutional procurement strategies and corporate procurement policies.
Advancements in eco-friendly and recycled materials are also enhancing product appeal, particularly among environmentally conscious consumers. Offline and online retail channels are facilitating wider accessibility and convenience, allowing both bulk and individual purchases to meet diverse consumer requirements. The market is further shaped by changing workplace dynamics, including hybrid work models, which have increased the need for home office stationery.
Growing investments in educational infrastructure, coupled with the expanding corporate sector, are expected to sustain demand Continuous innovation in design, functionality, and sustainability of stationery products is anticipated to drive long-term growth and strengthen the overall market landscape.
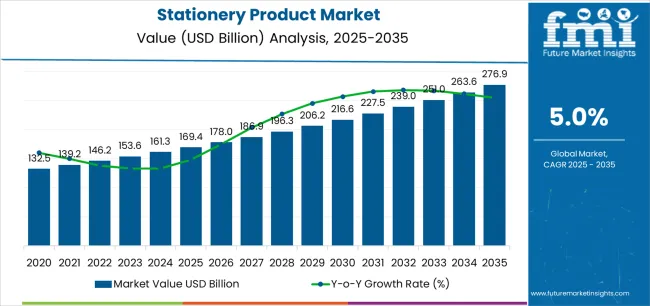
| Metric | Value |
|---|---|
| Stationery Product Market Estimated Value in (2025 E) | USD 169.4 billion |
| Stationery Product Market Forecast Value in (2035 F) | USD 276.9 billion |
| Forecast CAGR (2025 to 2035) | 5.0% |
The market is segmented by Type, Application, and Distribution Channel and region. By Type, the market is divided into Paper Products, Writing Instruments, and Art & Craft. In terms of Application, the market is classified into Commercial and Residential. Based on Distribution Channel, the market is segmented into Offline and Online. Regionally, the market is classified into North America, Latin America, Western Europe, Eastern Europe, Balkan & Baltic Countries, Russia & Belarus, Central Asia, East Asia, South Asia & Pacific, and the Middle East & Africa.
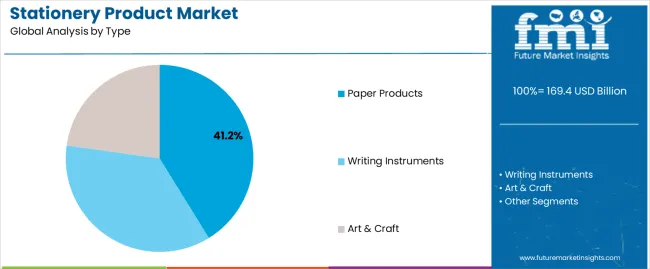
The paper products segment is projected to hold 41.2% of the market revenue in 2025, making it the leading type in the Stationery Product market. Growth in this segment is being driven by consistent demand across educational, commercial, and administrative sectors where paper-based materials remain essential for documentation, record-keeping, and academic purposes. High-quality, durable, and environmentally sustainable paper products have reinforced adoption among schools, offices, and enterprises.
Product customization, including size, texture, and multifunctionality, is enhancing usability and operational efficiency. The widespread availability of paper products through various retail networks, coupled with competitive pricing strategies, has further strengthened their market position. Educational institutions and corporate organizations are increasingly integrating paper-based stationery with digital systems for hybrid learning and office processes, thereby maintaining consistent demand.
As awareness of eco-friendly alternatives grows, manufacturers focusing on recycled and certified paper materials are expected to capitalize on market opportunities With these factors, paper products are likely to retain their leading share, supported by their essential role in documentation and office workflows.
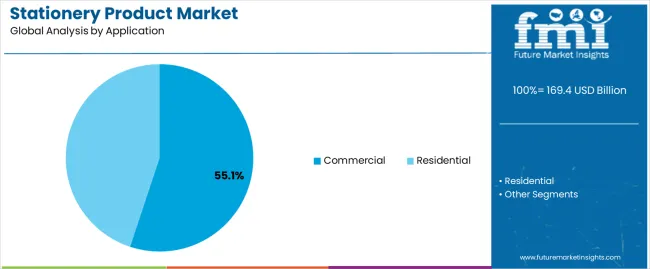
The commercial application segment is anticipated to account for 55.1% of the market revenue in 2025, establishing it as the largest application category. Growth is being driven by the demand for stationery products to support operational efficiency, administrative tasks, and employee productivity in offices, retail establishments, and corporate environments. Stationery items are increasingly being used for branding, record management, and workflow optimization, making them a critical component of commercial operations.
The segment is supported by large-scale procurement policies and bulk purchasing practices, which ensure consistent demand throughout the year. Customization, functionality, and sustainability of stationery products have enhanced their appeal in commercial settings. Technological integration in workflow systems, including hybrid office environments, has further reinforced the need for organized and efficient stationery solutions.
As commercial enterprises continue to focus on productivity, efficiency, and compliance, demand for stationery products is expected to remain strong The segment is likely to maintain leadership due to its critical role in enabling smooth and effective business operations.
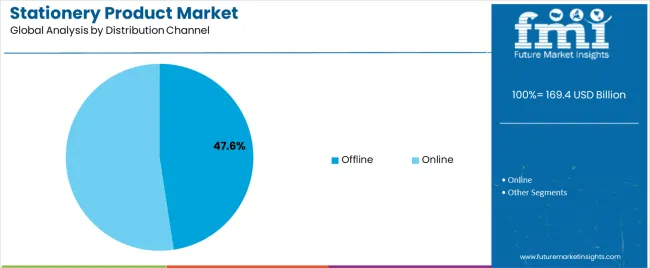
The offline distribution channel is projected to hold 47.6% of the market revenue in 2025, making it the leading channel for stationery product sales. Its dominance is being driven by widespread accessibility through retail stores, supermarkets, specialty stationery shops, and educational supply outlets. Offline channels offer direct interaction with products, allowing consumers to assess quality, variety, and usability before purchase.
Bulk procurement by educational institutions, commercial offices, and government organizations is often facilitated through offline distribution networks, reinforcing consistent sales. Strong relationships between manufacturers, distributors, and retailers ensure timely availability of new and traditional stationery products, supporting customer loyalty and repeat purchases. The ability to provide personalized services, such as customized stationery, further enhances offline channel adoption.
Despite the growing online retail sector, offline channels continue to play a key role in meeting immediate, large-scale, and institutional demands As businesses and educational institutions maintain procurement through traditional retail networks, offline distribution is expected to retain its leadership, supported by convenience, product variety, and established supplier networks.
Continuing Addition of Schools
Government initiatives targeting the education of children in remote areas and the burgeoning school-going age population are leading to a surge in the number of schools. Stationery products play an important part in education and thus their demand is being catapulted.
While schools and colleges are embracing the digital trend, the simplicity of pens and pencils is still admired and thus the consumer retention of these products is strong. Additionally, these products are also seeing greater admittance in schools as art classes for children become more common.
Office Use Sharpens the Demand
Though offices are associated with digital instruments, commercial spaces are still a rich source of income for stationery products. The practical nature of these products is appreciated, for noting things down in a jiffy or resorting to calculators for quick calculation. Stationery products also play a prominent part in office events, helping with decorations and gifts.
Luxury Stationery Products Writing Bright Future for the Market
These products are not just in demand for their functionality, as their aesthetic value is also a demand factor. Premium pens are being adopted as a luxury, finding prominent places in showcases. Ink pens are also seeing an uptick in demand for their fluid writing ability as well as design. Thus, premium products are a promising avenue for the market growth of the stationery product market.
Personalized Products Facilitate Market Growth
Demand for customizable stationery products is climbing. Students are enamored of products like notebooks and pens that help them stand out more in schools and colleges. Similarly, offices are also resorting to customized products to bring a sense of togetherness to the commercial space.
Best of Both Worlds
While digitalization is traditionally viewed as a threat to stationery products, it is also being used for innovation by manufacturers. For example, smart notebooks that connect to apps in mobile devices and digital writing pads are some devices that incorporate electronics and ensure the market keeps up with the times.
Threat of Obsolesce
The electronic-product-obsessed population is moving away from stationery products. Tasks such as, note-taking, marking of calendars, calculations, and more are being performed electronically, making these products obsolete. The threat of online classes and the overall digital inclination of the education sector, especially in developed countries, also hampers the growth of the market.
Paper products fly high in the industry. Offline continues to be the top distribution channel for stationery products.
Paper products accounted for 37.3% of the market share by type in 2025. Paper products are used for a variety of purposes and their application getting even wider is widening the scope of the market too. From simple bank paper to craft paper to smart notebooks, paper products are being encountered more frequently in both residential and commercial spaces.
The use of paper products for activities such as flying paper planes and decorations also keeps demand flying, while the use of them for origami is another avenue for growth. Through 2035, paper products are set to witness a CAGR of 5.1%.
| Attributes | Details |
|---|---|
| Top Type | Paper Products |
| CAGR (2025 to 2035) | 5.1% |
Offline construed a dominant 70.0% of the market share in 2025. Although online sales of stationery products are rising, resorting to online means to buy single pens or pencils is considered impractical.
Thus, consumers are still in favor of buying stationery products through offline means, especially through stationery stores. The offline sales channel is slated to register a CAGR of 4.9% for the forecast period.
| Attributes | Details |
|---|---|
| Top Distribution Channel | Offline |
| CAGR (2025 to 2035) | 4.9% |
The sheer number of schools in the Asia Pacific keeps the market chugging along in the region. Luxurious stationery products are becoming popular in Europe, while smart stationery products are proving to be lucrative in North America.
| Countries | CAGR (2025 to 2035) |
|---|---|
| China | 5.9% |
| Japan | 6.9% |
| United States | 5.6% |
| United Kingdom | 6.6% |
| South Korea | 7.1% |
The market is anticipated to register a CAGR of 7.1% in South Korea for the forecast period. Korean products are experimenting to catch the eyes of consumers. Scented pens, nature-themed notebooks, and stickers featuring cute animals are some of the products that see the market demand drive up in the country.
The United States is set to see the market expand at a CAGR of 5.6% over the forecast period. Customized products are winning over consumers in the United States, especially for gift-giving. Improving online sales is also impacting the market positively in the country.
The market is expected to register a CAGR of 5.9% in China over the forecast period. China is reputed to be the foremost country in the world for paper production, with the quantity in the 100 million-ton region annually.
Thus, paper products have an easy pathway and stationery products are proliferating in the country. Technologically advanced stationery items are also seeing greater adoption in China. The likes of electric erasers, pens with display capabilities, and other cutting-edge products evoke positivity for the market in the country.
The market is set to progress at a CAGR of 6.6% in the United Kingdom for the forecast period. Consumers in the United Kingdom are getting their fix of stationery items from local outlets of giant store chains.
For example, novelty stationery products producer Paperchase’s items started flocking in Tesco stores across the United Kingdom in 2025. The move came as a result of Tesco buying the brand and intellectual property of Paperchase.
The market is expected to register a CAGR of 6.9% in Japan over the period from 2025 to 2035. Japanese stationery has earned a valued reputation throughout the world. The reputation is a product of Japanese consumers’ affection not only for stationery items but also for stationery stores.
Carefully curated stationery stores dot the landscape of Japan, especially in prominent cities like Tokyo and Osaka. The encouragement for small stationery stores in the country also proves beneficial to market growth in the country.
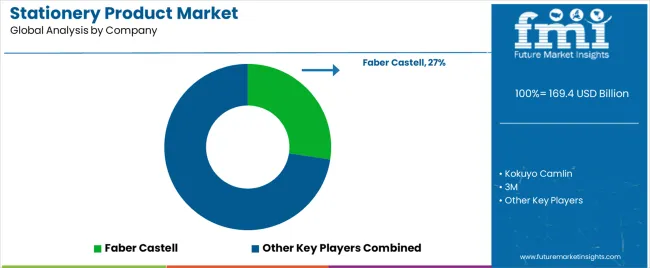
The market is highly fragmented. Although a few giants have established quite a presence in the market, it remains open for all.
Faber Castell is focusing on improving its reputation in schools to enhance market demand. For example, in February 2025, Faber-Castell partnered with Ryan International School in Mumbai, India to launch the Ryan Creative Studio, an initiative to give free rein to children when it comes to arts and crafts.
The fragmented nature of the market means startups have a plethora of opportunities. Stationarray is a startup that employs trucks to visit schools and housing societies for a limited period, making the buying more mobile. Other startups are focusing on making their products eco-friendly to boost demand.
Recent Developments in the Stationery Product Market
The global stationery product market is estimated to be valued at USD 169.4 billion in 2025.
The market size for the stationery product market is projected to reach USD 276.9 billion by 2035.
The stationery product market is expected to grow at a 5.0% CAGR between 2025 and 2035.
The key product types in stationery product market are paper products, writing instruments and art & craft.
In terms of application, commercial segment to command 55.1% share in the stationery product market in 2025.


Full Research Suite comprises of:
Market outlook & trends analysis
Interviews & case studies
Strategic recommendations
Vendor profiles & capabilities analysis
5-year forecasts
8 regions and 60+ country-level data splits
Market segment data splits
12 months of continuous data updates
DELIVERED AS:
PDF EXCEL ONLINE
Market Share Distribution Among Stationery Product Companies
Product Life-Cycle Management (PLM) IT Market Size and Share Forecast Outlook 2025 to 2035
Product Analytics Software Market Size and Share Forecast Outlook 2025 to 2035
Products from Food Waste Industry Analysis in Korea Size, Share and Forecast Outlook 2025 to 2035
Products from Food Waste in Japan - Size, Share, and Forecast Outlook 2025 to 2035
Production Logistics Market Size and Share Forecast Outlook 2025 to 2035
Products from Food Waste Market Analysis - Size, Growth, and Forecast 2025 to 2035
Product Design Verification And Validation Solution Market Size and Share Forecast Outlook 2025 to 2035
Production Printer Market - Growth, Demand & Forecast 2025 to 2035
Product Information Management Market Growth – Trends & Forecast 2024-2034
Product Dispensing Machinery Market
Product Cost Management Market
CBD Product Packaging Market Size and Share Forecast Outlook 2025 to 2035
USA Products from Food Waste Market Growth – Trends, Demand & Outlook 2025-2035
Competitive Overview of CBD Product Packaging Market Share
Soda Production Machine Market Size and Share Forecast Outlook 2025 to 2035
Competitive Overview of Date Product Market Share
Teff Products Market
Dairy Product Packaging Market Size and Share Forecast Outlook 2025 to 2035
Glass Product Market Size and Share Forecast Outlook 2025 to 2035

Thank you!
You will receive an email from our Business Development Manager. Please be sure to check your SPAM/JUNK folder too.
Chat With
MaRIA