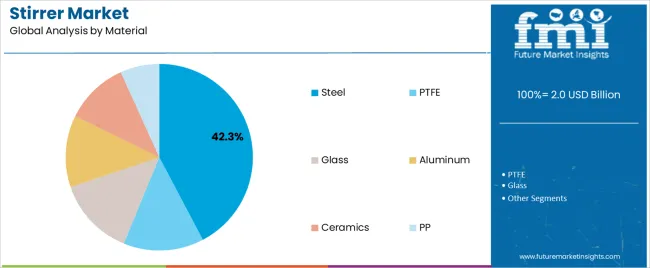
Stirrer Market Size and Share Forecast Outlook From 2024 to 2034

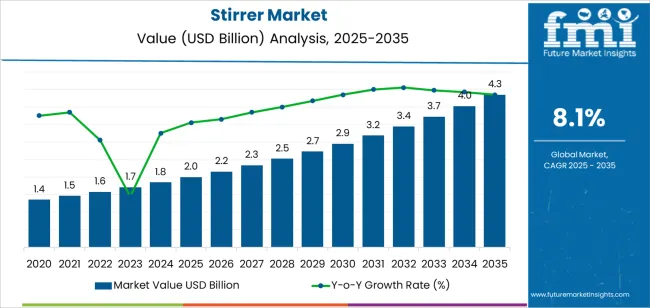
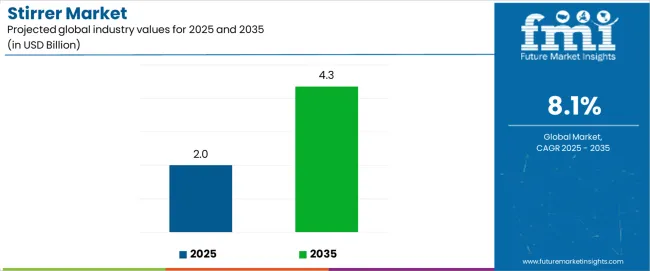
The stirrer market is projected to be worth USD 1,845.6 million in 2024. The market is likely to reach USD 4,026.9 million by 2034. The Industry is expected to surge at a CAGR of 8.10% from 2024 to 2034.

Attributes Key Insights
Stirrer Industry Estimated Size in 2024 USD 1,845.6 million
Projected Industry Value in 2034 USD 4,026.9 million
Value-based CAGR from 2024 to 2034 8.10%

The emphasis on user experience and ergonomic design emerges as a significant driver. Manufacturers prioritize intuitive controls, enhanced safety features, and user friendly interfaces to optimize usability and efficiency, catering to diverse user preferences and skill levels.

The integration of smart sensors and automation technologies offers unprecedented insights into stirring processes, enhancing accuracy and reproducibility. Stirrers equipped with real time monitoring capabilities enable precise control and adjustment of parameters, ensuring consistent results and minimizing operational errors.

The rising demand for compact and portable stirrers drives innovation in miniaturization and lightweight design. Industries requiring mobility and space saving solutions, such as field research and mobile laboratories, seek compact stirrers without compromising performance or reliability.

Advancements in material science and engineering contribute to the development of durable and corrosion resistant stirrer components, extending product lifespan and reducing maintenance costs. These emerging drivers underscore the dynamic nature of the stirrer market, presenting opportunities for manufacturers to differentiate and innovate in response to evolving customer needs and technological trends.

Top Stirrer Market Dynamics and Industry Trends

  • Stirrer market sees a trend in sophisticated controls, allowing precise adjustments for diverse applications, enhancing operational flexibility and performance.
  • Stirrers evolve to cater to a broader range of applications, meeting the needs of various industries, from pharmaceuticals to chemical research, and beyond.
  • Stirrers with remote monitoring capabilities gain traction, allowing real time observation and control, enhancing operational efficiency and enabling remote data access.
  • The market witnesses a growing emphasis on energy efficient stirrers, reflecting its commitment to sustainability and cost effectiveness in laboratory operations.
  • The integration of hybrid technologies, combining magnetic and mechanical stirring, emerges as a trend, offering a versatile solution for different mixing requirements, optimizing performance and versatility.

Comparison of Historical vs Future Outlook on Changing Consumer Trends for Stirrer Industry

Historical Value in 2019 USD 1,250.3 million
Historical Value in 2023 USD 1,701 million
Market Estimated Size in 2024 USD 1,845.6 million
Projected Market Value in 2034 USD 4,026.9 million

Between 2019 and 2023, the stirrer market experienced steady growth driven by increased research activities and industrial applications. Advancements in technology, particularly the integration of IoT and automation, reshaped stirring processes, enhancing efficiency and accuracy. A rising emphasis on sustainability led to the development of ecofriendly stirrers, reflecting shifting industry norms.

Looking ahead from 2024 to 2034, industry forecasts anticipate accelerated growth propelled by continued technological innovations and expanding applications. The integration of artificial intelligence and machine learning algorithms further optimizes stirring processes, enabling predictive maintenance and adaptive control systems. The market sees increased adoption of compact and portable stirrers, catering to on the go research and fieldwork needs.

Rising environmental concerns drive demand for energy efficient and sustainable stirrers, prompting manufacturers to explore renewable materials and ecofriendly production processes. The emergence of smart sensors and remote monitoring capabilities enhances data collection and analysis, enabling real time insights and process optimization.

Key Growth Drivers Fueling the Stirrer Industry

  • Incorporation of cutting edge technology enhances stirrer capabilities, improving efficiency, precision, and adaptability to diverse laboratory and industrial processes.
  • The focus on safety drives innovation in stirrer design, with enhanced features to minimize risks and ensure operator protection during operation.
  • Stirrer manufacturers prioritize designs that simplify maintenance tasks, reducing downtime and ensuring consistent performance over extended periods.
  • Stirrer compatibility with a wide range of vessels and sample types remains a key driver, allowing seamless integration into various laboratory workflows and applications.
  • Adherence to industry standards and regulations shapes stirrer development, ensuring product compliance and reliability in laboratory and industrial environments.

Factors Restraining the Demand for Stirrers

  • Ensuring stirrer compatibility with diverse sample materials poses a challenge, requiring manufacturers to develop versatile designs capable of accommodating various substances.
  • Achieving precise control over stirring parameters, such as speed and direction, presents challenges, necessitating advanced control systems and algorithms.
  • Complex maintenance procedures can increase downtime and operational costs, highlighting the need for user friendly designs and streamlined maintenance protocols.
  • Safety risks associated with high speed stirring operations require careful consideration, prompting the implementation of safety features and operator training programs.
  • Addressing the environmental footprint of stirrer manufacturing processes and materials remains a challenge, driving the need for sustainable practices and ecofriendly alternatives.

Analysis of Top Countries Manufacturing, Certifying, Supplying, and Using Stirrers

In the stirrer market, India leads with an impressive 8.7% growth rate, showcasing its growing prominence in manufacturing and research. China closely follows with 8.4%, reflecting its industrial innovation. Germany, the United States, and the United Kingdom exhibit steady growth rates, reflecting established market positions and technological advancements.

Countries Forecast CAGRs from 2024 to 2034
India 8.7%
China 8.4%
Germany 5.9%
United Kingdom 5.7%
United States 6.9%

India Driving the Stirrer Industry with a 8.7% Projected CAGR until 2034

India emerges as a driving force in the stirrer industry, projecting an impressive 8.7% CAGR until 2034. Fueled by advancements in research, manufacturing, and innovation, India harnesses its growing technological prowess to meet evolving industry demands, positioning itself as a key player in the global market.

With a focus on precision engineering and cost effective solutions, its contributions drive efficiency and competitiveness across diverse sectors. Its proactive approach to industrial development and commitment to excellence cement its status as a leading force shaping the trajectory of the Stirrer Industry in the coming years.

China Shaping the Stirrer Market with a 8.4% Projected CAGR until 2034

China exerts significant influence in shaping the Stirrer Market, boasting an impressive 8.4% projected CAGR until 2034. Renowned for its manufacturing prowess and technological innovation, China drives market expansion with its vast industrial infrastructure and research capabilities.

With a focus on quality, efficiency, and innovation, Chinese manufacturers lead advancements in stirrer technology, catering to diverse industrial needs. Leveraging strategic partnerships and continuous research and development efforts, China cements its position as a frontrunner in the global stirrer market, driving growth, and setting industry standards for performance, reliability, and technological advancement.
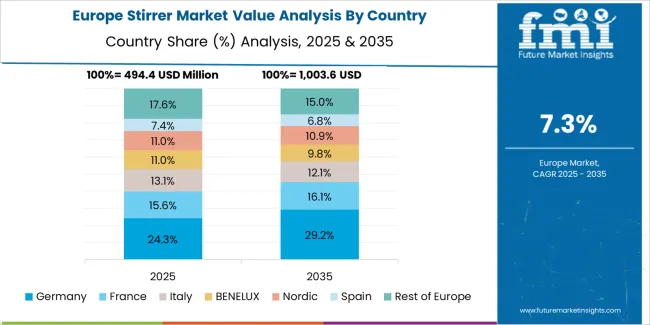
Germany Charting the Stirrer Market with a 5.9% Projected CAGR until 2034

Germany plays a pivotal role in charting the stirrer market, projecting a steady 5.9% CAGR until 2034. Renowned for precision engineering and technological excellence, Germany leads in innovative stirrer designs. With a commitment to quality and reliability, German manufacturers set industry benchmarks, driving market advancements.

Leveraging research and development investments, as well as strong collaborations, Germany continues to deliver cutting edge solutions that meet evolving industry demands. As a leader in industrial innovation, its proactive approach ensures sustained growth and relevance in the dynamic stirrer market, maintaining its position as a key player in the global arena.

United Kingdom Driving the Stirrer Market with a 5.7% Projected CAGR until 2034

The United Kingdom emerges as a driving force in the stirrer market, projecting a steady 5.7% CAGR until 2034. Renowned for its innovation and industrial expertise, the United Kingdom leads advancements in stirring technology, focusing on precision, reliability, and sustainability.

With a commitment to excellence and forward thinking approaches, the United Kingdom ropels market expansion and sets new benchmarks for performance and reliability. Leveraging research, development, and strategic partnerships, the United Kingdom shapes the industry landscape, offering high quality stirrer solutions globally. Through its proactive approach and dedication to innovation, the United Kingdom paves the way for sustained growth in the stirrer market.
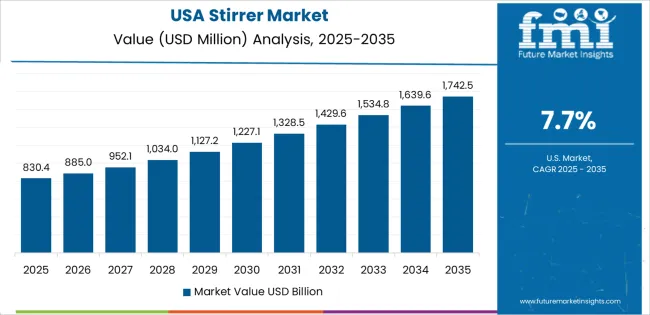
Innovative Forces Driving United States Stirrer Market Leadership with 6.9% Projected CAGR until 2034

Innovative forces propel the United States to leadership in the stirrer market, boasting a 6.9% projected CAGR until 2034. Renowned for its technological prowess and industrial innovation, the United States drives advancements in stirring technology. With a focus on efficiency, durability, and sustainability, United States manufacturers pioneer cutting edge solutions tailored to diverse applications.

Leveraging research, development, and strategic partnerships, the United States remains at the forefront of stirrer innovation globally. Through forward thinking approaches and commitment to excellence, the United States continues to shape the stirrer market, driving growth and setting industry benchmarks for performance, reliability, and sustainability.

Stirrer Industry Analysis by Top Investment Segments

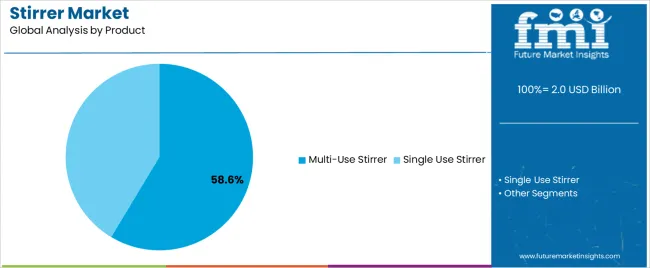
In 2024, the stirrer market was dominated by multi use stirrers, holding a significant market share of 66.00%. Plastic stirrers accounted for 30.00% of the market, reflecting their prevalence and versatility in various laboratory and industrial applications.

Category Market Share in 2024
Multi use stirrer 66.00%
Plastic 30.00%

Multi Use Stirrers Reign Supreme with a 66.00% Market Share in the Stirrer Industry

Until 2024, multi use stirrers maintained a commanding presence in the stirrer market, holding a substantial 66.00% market share. This dominance underscores the versatility and reliability of multi use stirrers, which remain integral tools across diverse laboratory, research, and industrial settings for mixing and blending applications.

Plastic Stirrers Set to Claim a 30.00% Market Share in the Stirrer Industry by 2024

By 2024, the plastic segment is poised to secure a significant 30.00% market share in the stirrer industry. This anticipated growth reflects the widespread adoption of plastic stirrers, renowned for their versatility, affordability, and compatibility with various laboratory and industrial applications.

Key Stirrer Market Players and Concentration

In the vibrant stirrer market, competition thrives as key players vie for market share and innovation leadership. Industry giants such as Labnet International, IKA Works, and Thermo Fisher Scientific dominate with advanced technologies and extensive product portfolios. Rising stars like Scilogex and Benchmark Scientific challenge incumbents with agile strategies and niche offerings.

The competitive landscape is characterized by continuous R&D investments, strategic collaborations, and product diversification. Customer centric approaches drive differentiation, with companies focusing on reliability, efficiency, and user friendly designs. Amidst evolving customer needs and technological advancements, competition remains fierce, fueling innovation and market dynamism.

Product Portfolio

  • Royer Corporation offers innovative promotional products, specializing in custom drink stirrers and swizzle sticks. With a focus on quality and creativity, their customizable offerings cater to diverse branding needs, enhancing brand visibility and customer engagement in the hospitality and beverage industry.
  • BioPak pioneers sustainable packaging solutions, providing compostable and recyclable packaging products for food service and retail industries. With a commitment to reducing environmental impact, their ecofriendly alternatives prioritize sustainability without compromising on performance or aesthetics.
  • Talivenda specializes in artisanal handcrafted accessories, featuring unique designs inspired by nature and culture. Each piece reflects meticulous craftsmanship and attention to detail, blending traditional techniques with contemporary flair. Their collections resonate with individuals seeking distinctive, ethically sourced accessories that tell a story of heritage and craftsmanship.

Key Shifting Preferences Covered in Stirrer Market Report

  • Ika Overhead Stirrer
  • Velp Scientifica Magnetic Stirrer
  • Stirring Hot Plate Fisher Scientific
  • Vevor Magnetic Stirrer Hot Plate
  • Thermo Scientific Hot Plate Stirrer
  • Cole Parmer Magnetic Stirrer
  • High Torque Overhead Stirrer

Scope and Coverage of the Stirrer Market Report

Attribute Details
Estimated Industry Size in 2024 USD 1,845.6 million
Projected Industry Valuation in 2034 USD 4,026.9 million
Value-based CAGR 2024 to 2034 8.10%
Forecast Period 2024 to 2034
Historical Data Available for 2019 to 2023
Industry Analysis Value in USD million
Key Regions Covered North America; Latin America; Western Europe; Eastern Europe; South Asia and Pacific; East Asia; The Middle East & Africa
Key Industry Segments Covered Capacity, Product, Material, Region
Key Countries Profiled The United States, Canada, Brazil, Mexico, Germany, The United Kingdom, France, Spain, Italy, Russia, Poland, Czech Republic, Romania, India, Bangladesh, Australia, New Zealand, China, Japan, South Korea, GCC countries, South Africa, Israel
Key Companies Profiled D&W Fine Pack; Huhtamaki Oyj; SmartPack USA, Inc.; CHX Products; Royer Corporation; BioPak; Talivenda; Cosmos Eco Friends; GreenFeel; SILVER BIRCH Factory

Top Segments Studied in the Stirrer Market Report

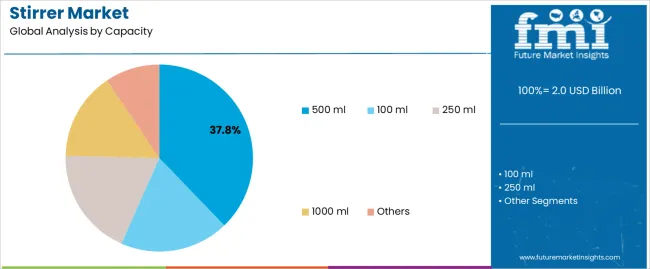
By Capacity:

  • 100 ml
  • 250 ml
  • 500 ml
  • 1000 ml
  • Others

By Product:

  • Multi-Use Stirrer
  • Single Use Stirrer

By Material:

  • Steel
  • PTFE
  • Glass
  • Aluminum
  • Ceramics
  • PP

By Region:

  • North America
  • Latin America
  • Western Europe
  • Eastern Europe
  • South Asia & Pacific
  • East Asia
  • The Middle East & Africa

Table of Content

  • 1. Executive Summary
  • 2. Market Overview
  • 3. Market Background
  • 4. Global Market Analysis 2019 to 2023 and Forecast, 2024 to 2034
  • 5. Global Market Analysis 2019 to 2023 and Forecast 2024 to 2034, By Capacity
    • 5.1. 100 ML
    • 5.2. 250 ML
    • 5.3. 500 ML
    • 5.4. 1000 ML
    • 5.5. Others
  • 6. Global Market Analysis 2019 to 2023 and Forecast 2024 to 2034, By Product
    • 6.1. Multi-Use Stirrer
    • 6.2. Single Use Stirrer
  • 7. Global Market Analysis 2019 to 2023 and Forecast 2024 to 2034, By Material
    • 7.1. Steel
    • 7.2. PTFE
    • 7.3. Glass
    • 7.4. Aluminum
    • 7.5. Ceramics
    • 7.6. PP
  • 8. Global Market Analysis 2019 to 2023 and Forecast 2024 to 2034, By Region
    • 8.1. North America
    • 8.2. Latin America
    • 8.3. Western Europe
    • 8.4. Eastern Europe
    • 8.5. South Asia and Pacific
    • 8.6. East Asia
    • 8.7. Middle East and Africa
  • 9. North America Market Analysis 2019 to 2023 and Forecast 2024 to 2034, By Country
  • 10. Latin America Market Analysis 2019 to 2023 and Forecast 2024 to 2034, By Country
  • 11. Western Europe Market Analysis 2019 to 2023 and Forecast 2024 to 2034, By Country
  • 12. Eastern Europe Market Analysis 2019 to 2023 and Forecast 2024 to 2034, By Country
  • 13. South Asia and Pacific Market Analysis 2019 to 2023 and Forecast 2024 to 2034, By Country
  • 14. East Asia Market Analysis 2019 to 2023 and Forecast 2024 to 2034, By Country
  • 15. Middle East and Africa Market Analysis 2019 to 2023 and Forecast 2024 to 2034, By Country
  • 16. Key Countries Market Analysis
  • 17. Market Structure Analysis
  • 18. Competition Analysis
    • 18.1. Corning Incorporated
    • 18.2. Grant Instruments (Cambridge) Ltd
    • 18.3. IKA Works GmbH & Co. KG
    • 18.4. Scientific Industries, Inc
    • 18.5. Labstac LLC
    • 18.6. Planetroll GmbH & Co. KG
    • 18.7. Thermo Fisher Scientific Inc
    • 18.8. Azzota Scientific
    • 18.9. Dynalab Corp
    • 18.10. Troemner, LLC
  • 19. Assumptions & Acronyms Used
  • 20. Research Methodology

List of Tables

Table 1: Global Market Value (US$ Million) Forecast by Region, 2019 to 2034

Table 2: Global Market Volume (Units) Forecast by Region, 2019 to 2034

Table 3: Global Market Value (US$ Million) Forecast by Capacity, 2019 to 2034

Table 4: Global Market Volume (Units) Forecast by Capacity, 2019 to 2034

Table 5: Global Market Value (US$ Million) Forecast by Product, 2019 to 2034

Table 6: Global Market Volume (Units) Forecast by Product, 2019 to 2034

Table 7: Global Market Value (US$ Million) Forecast by Material, 2019 to 2034

Table 8: Global Market Volume (Units) Forecast by Material, 2019 to 2034

Table 9: North America Market Value (US$ Million) Forecast by Country, 2019 to 2034

Table 10: North America Market Volume (Units) Forecast by Country, 2019 to 2034

Table 11: North America Market Value (US$ Million) Forecast by Capacity, 2019 to 2034

Table 12: North America Market Volume (Units) Forecast by Capacity, 2019 to 2034

Table 13: North America Market Value (US$ Million) Forecast by Product, 2019 to 2034

Table 14: North America Market Volume (Units) Forecast by Product, 2019 to 2034

Table 15: North America Market Value (US$ Million) Forecast by Material, 2019 to 2034

Table 16: North America Market Volume (Units) Forecast by Material, 2019 to 2034

Table 17: Latin America Market Value (US$ Million) Forecast by Country, 2019 to 2034

Table 18: Latin America Market Volume (Units) Forecast by Country, 2019 to 2034

Table 19: Latin America Market Value (US$ Million) Forecast by Capacity, 2019 to 2034

Table 20: Latin America Market Volume (Units) Forecast by Capacity, 2019 to 2034

Table 21: Latin America Market Value (US$ Million) Forecast by Product, 2019 to 2034

Table 22: Latin America Market Volume (Units) Forecast by Product, 2019 to 2034

Table 23: Latin America Market Value (US$ Million) Forecast by Material, 2019 to 2034

Table 24: Latin America Market Volume (Units) Forecast by Material, 2019 to 2034

Table 25: Western Europe Market Value (US$ Million) Forecast by Country, 2019 to 2034

Table 26: Western Europe Market Volume (Units) Forecast by Country, 2019 to 2034

Table 27: Western Europe Market Value (US$ Million) Forecast by Capacity, 2019 to 2034

Table 28: Western Europe Market Volume (Units) Forecast by Capacity, 2019 to 2034

Table 29: Western Europe Market Value (US$ Million) Forecast by Product, 2019 to 2034

Table 30: Western Europe Market Volume (Units) Forecast by Product, 2019 to 2034

Table 31: Western Europe Market Value (US$ Million) Forecast by Material, 2019 to 2034

Table 32: Western Europe Market Volume (Units) Forecast by Material, 2019 to 2034

Table 33: Eastern Europe Market Value (US$ Million) Forecast by Country, 2019 to 2034

Table 34: Eastern Europe Market Volume (Units) Forecast by Country, 2019 to 2034

Table 35: Eastern Europe Market Value (US$ Million) Forecast by Capacity, 2019 to 2034

Table 36: Eastern Europe Market Volume (Units) Forecast by Capacity, 2019 to 2034

Table 37: Eastern Europe Market Value (US$ Million) Forecast by Product, 2019 to 2034

Table 38: Eastern Europe Market Volume (Units) Forecast by Product, 2019 to 2034

Table 39: Eastern Europe Market Value (US$ Million) Forecast by Material, 2019 to 2034

Table 40: Eastern Europe Market Volume (Units) Forecast by Material, 2019 to 2034

Table 41: South Asia and Pacific Market Value (US$ Million) Forecast by Country, 2019 to 2034

Table 42: South Asia and Pacific Market Volume (Units) Forecast by Country, 2019 to 2034

Table 43: South Asia and Pacific Market Value (US$ Million) Forecast by Capacity, 2019 to 2034

Table 44: South Asia and Pacific Market Volume (Units) Forecast by Capacity, 2019 to 2034

Table 45: South Asia and Pacific Market Value (US$ Million) Forecast by Product, 2019 to 2034

Table 46: South Asia and Pacific Market Volume (Units) Forecast by Product, 2019 to 2034

Table 47: South Asia and Pacific Market Value (US$ Million) Forecast by Material, 2019 to 2034

Table 48: South Asia and Pacific Market Volume (Units) Forecast by Material, 2019 to 2034

Table 49: East Asia Market Value (US$ Million) Forecast by Country, 2019 to 2034

Table 50: East Asia Market Volume (Units) Forecast by Country, 2019 to 2034

Table 51: East Asia Market Value (US$ Million) Forecast by Capacity, 2019 to 2034

Table 52: East Asia Market Volume (Units) Forecast by Capacity, 2019 to 2034

Table 53: East Asia Market Value (US$ Million) Forecast by Product, 2019 to 2034

Table 54: East Asia Market Volume (Units) Forecast by Product, 2019 to 2034

Table 55: East Asia Market Value (US$ Million) Forecast by Material, 2019 to 2034

Table 56: East Asia Market Volume (Units) Forecast by Material, 2019 to 2034

Table 57: Middle East and Africa Market Value (US$ Million) Forecast by Country, 2019 to 2034

Table 58: Middle East and Africa Market Volume (Units) Forecast by Country, 2019 to 2034

Table 59: Middle East and Africa Market Value (US$ Million) Forecast by Capacity, 2019 to 2034

Table 60: Middle East and Africa Market Volume (Units) Forecast by Capacity, 2019 to 2034

Table 61: Middle East and Africa Market Value (US$ Million) Forecast by Product, 2019 to 2034

Table 62: Middle East and Africa Market Volume (Units) Forecast by Product, 2019 to 2034

Table 63: Middle East and Africa Market Value (US$ Million) Forecast by Material, 2019 to 2034

Table 64: Middle East and Africa Market Volume (Units) Forecast by Material, 2019 to 2034

List of Figures

Figure 1: Global Market Value (US$ Million) by Capacity, 2024 to 2034

Figure 2: Global Market Value (US$ Million) by Product, 2024 to 2034

Figure 3: Global Market Value (US$ Million) by Material, 2024 to 2034

Figure 4: Global Market Value (US$ Million) by Region, 2024 to 2034

Figure 5: Global Market Value (US$ Million) Analysis by Region, 2019 to 2034

Figure 6: Global Market Volume (Units) Analysis by Region, 2019 to 2034

Figure 7: Global Market Value Share (%) and BPS Analysis by Region, 2024 to 2034

Figure 8: Global Market Y-o-Y Growth (%) Projections by Region, 2024 to 2034

Figure 9: Global Market Value (US$ Million) Analysis by Capacity, 2019 to 2034

Figure 10: Global Market Volume (Units) Analysis by Capacity, 2019 to 2034

Figure 11: Global Market Value Share (%) and BPS Analysis by Capacity, 2024 to 2034

Figure 12: Global Market Y-o-Y Growth (%) Projections by Capacity, 2024 to 2034

Figure 13: Global Market Value (US$ Million) Analysis by Product, 2019 to 2034

Figure 14: Global Market Volume (Units) Analysis by Product, 2019 to 2034

Figure 15: Global Market Value Share (%) and BPS Analysis by Product, 2024 to 2034

Figure 16: Global Market Y-o-Y Growth (%) Projections by Product, 2024 to 2034

Figure 17: Global Market Value (US$ Million) Analysis by Material, 2019 to 2034

Figure 18: Global Market Volume (Units) Analysis by Material, 2019 to 2034

Figure 19: Global Market Value Share (%) and BPS Analysis by Material, 2024 to 2034

Figure 20: Global Market Y-o-Y Growth (%) Projections by Material, 2024 to 2034

Figure 21: Global Market Attractiveness by Capacity, 2024 to 2034

Figure 22: Global Market Attractiveness by Product, 2024 to 2034

Figure 23: Global Market Attractiveness by Material, 2024 to 2034

Figure 24: Global Market Attractiveness by Region, 2024 to 2034

Figure 25: North America Market Value (US$ Million) by Capacity, 2024 to 2034

Figure 26: North America Market Value (US$ Million) by Product, 2024 to 2034

Figure 27: North America Market Value (US$ Million) by Material, 2024 to 2034

Figure 28: North America Market Value (US$ Million) by Country, 2024 to 2034

Figure 29: North America Market Value (US$ Million) Analysis by Country, 2019 to 2034

Figure 30: North America Market Volume (Units) Analysis by Country, 2019 to 2034

Figure 31: North America Market Value Share (%) and BPS Analysis by Country, 2024 to 2034

Figure 32: North America Market Y-o-Y Growth (%) Projections by Country, 2024 to 2034

Figure 33: North America Market Value (US$ Million) Analysis by Capacity, 2019 to 2034

Figure 34: North America Market Volume (Units) Analysis by Capacity, 2019 to 2034

Figure 35: North America Market Value Share (%) and BPS Analysis by Capacity, 2024 to 2034

Figure 36: North America Market Y-o-Y Growth (%) Projections by Capacity, 2024 to 2034

Figure 37: North America Market Value (US$ Million) Analysis by Product, 2019 to 2034

Figure 38: North America Market Volume (Units) Analysis by Product, 2019 to 2034

Figure 39: North America Market Value Share (%) and BPS Analysis by Product, 2024 to 2034

Figure 40: North America Market Y-o-Y Growth (%) Projections by Product, 2024 to 2034

Figure 41: North America Market Value (US$ Million) Analysis by Material, 2019 to 2034

Figure 42: North America Market Volume (Units) Analysis by Material, 2019 to 2034

Figure 43: North America Market Value Share (%) and BPS Analysis by Material, 2024 to 2034

Figure 44: North America Market Y-o-Y Growth (%) Projections by Material, 2024 to 2034

Figure 45: North America Market Attractiveness by Capacity, 2024 to 2034

Figure 46: North America Market Attractiveness by Product, 2024 to 2034

Figure 47: North America Market Attractiveness by Material, 2024 to 2034

Figure 48: North America Market Attractiveness by Country, 2024 to 2034

Figure 49: Latin America Market Value (US$ Million) by Capacity, 2024 to 2034

Figure 50: Latin America Market Value (US$ Million) by Product, 2024 to 2034

Figure 51: Latin America Market Value (US$ Million) by Material, 2024 to 2034

Figure 52: Latin America Market Value (US$ Million) by Country, 2024 to 2034

Figure 53: Latin America Market Value (US$ Million) Analysis by Country, 2019 to 2034

Figure 54: Latin America Market Volume (Units) Analysis by Country, 2019 to 2034

Figure 55: Latin America Market Value Share (%) and BPS Analysis by Country, 2024 to 2034

Figure 56: Latin America Market Y-o-Y Growth (%) Projections by Country, 2024 to 2034

Figure 57: Latin America Market Value (US$ Million) Analysis by Capacity, 2019 to 2034

Figure 58: Latin America Market Volume (Units) Analysis by Capacity, 2019 to 2034

Figure 59: Latin America Market Value Share (%) and BPS Analysis by Capacity, 2024 to 2034

Figure 60: Latin America Market Y-o-Y Growth (%) Projections by Capacity, 2024 to 2034

Figure 61: Latin America Market Value (US$ Million) Analysis by Product, 2019 to 2034

Figure 62: Latin America Market Volume (Units) Analysis by Product, 2019 to 2034

Figure 63: Latin America Market Value Share (%) and BPS Analysis by Product, 2024 to 2034

Figure 64: Latin America Market Y-o-Y Growth (%) Projections by Product, 2024 to 2034

Figure 65: Latin America Market Value (US$ Million) Analysis by Material, 2019 to 2034

Figure 66: Latin America Market Volume (Units) Analysis by Material, 2019 to 2034

Figure 67: Latin America Market Value Share (%) and BPS Analysis by Material, 2024 to 2034

Figure 68: Latin America Market Y-o-Y Growth (%) Projections by Material, 2024 to 2034

Figure 69: Latin America Market Attractiveness by Capacity, 2024 to 2034

Figure 70: Latin America Market Attractiveness by Product, 2024 to 2034

Figure 71: Latin America Market Attractiveness by Material, 2024 to 2034

Figure 72: Latin America Market Attractiveness by Country, 2024 to 2034

Figure 73: Western Europe Market Value (US$ Million) by Capacity, 2024 to 2034

Figure 74: Western Europe Market Value (US$ Million) by Product, 2024 to 2034

Figure 75: Western Europe Market Value (US$ Million) by Material, 2024 to 2034

Figure 76: Western Europe Market Value (US$ Million) by Country, 2024 to 2034

Figure 77: Western Europe Market Value (US$ Million) Analysis by Country, 2019 to 2034

Figure 78: Western Europe Market Volume (Units) Analysis by Country, 2019 to 2034

Figure 79: Western Europe Market Value Share (%) and BPS Analysis by Country, 2024 to 2034

Figure 80: Western Europe Market Y-o-Y Growth (%) Projections by Country, 2024 to 2034

Figure 81: Western Europe Market Value (US$ Million) Analysis by Capacity, 2019 to 2034

Figure 82: Western Europe Market Volume (Units) Analysis by Capacity, 2019 to 2034

Figure 83: Western Europe Market Value Share (%) and BPS Analysis by Capacity, 2024 to 2034

Figure 84: Western Europe Market Y-o-Y Growth (%) Projections by Capacity, 2024 to 2034

Figure 85: Western Europe Market Value (US$ Million) Analysis by Product, 2019 to 2034

Figure 86: Western Europe Market Volume (Units) Analysis by Product, 2019 to 2034

Figure 87: Western Europe Market Value Share (%) and BPS Analysis by Product, 2024 to 2034

Figure 88: Western Europe Market Y-o-Y Growth (%) Projections by Product, 2024 to 2034

Figure 89: Western Europe Market Value (US$ Million) Analysis by Material, 2019 to 2034

Figure 90: Western Europe Market Volume (Units) Analysis by Material, 2019 to 2034

Figure 91: Western Europe Market Value Share (%) and BPS Analysis by Material, 2024 to 2034

Figure 92: Western Europe Market Y-o-Y Growth (%) Projections by Material, 2024 to 2034

Figure 93: Western Europe Market Attractiveness by Capacity, 2024 to 2034

Figure 94: Western Europe Market Attractiveness by Product, 2024 to 2034

Figure 95: Western Europe Market Attractiveness by Material, 2024 to 2034

Figure 96: Western Europe Market Attractiveness by Country, 2024 to 2034

Figure 97: Eastern Europe Market Value (US$ Million) by Capacity, 2024 to 2034

Figure 98: Eastern Europe Market Value (US$ Million) by Product, 2024 to 2034

Figure 99: Eastern Europe Market Value (US$ Million) by Material, 2024 to 2034

Figure 100: Eastern Europe Market Value (US$ Million) by Country, 2024 to 2034

Figure 101: Eastern Europe Market Value (US$ Million) Analysis by Country, 2019 to 2034

Figure 102: Eastern Europe Market Volume (Units) Analysis by Country, 2019 to 2034

Figure 103: Eastern Europe Market Value Share (%) and BPS Analysis by Country, 2024 to 2034

Figure 104: Eastern Europe Market Y-o-Y Growth (%) Projections by Country, 2024 to 2034

Figure 105: Eastern Europe Market Value (US$ Million) Analysis by Capacity, 2019 to 2034

Figure 106: Eastern Europe Market Volume (Units) Analysis by Capacity, 2019 to 2034

Figure 107: Eastern Europe Market Value Share (%) and BPS Analysis by Capacity, 2024 to 2034

Figure 108: Eastern Europe Market Y-o-Y Growth (%) Projections by Capacity, 2024 to 2034

Figure 109: Eastern Europe Market Value (US$ Million) Analysis by Product, 2019 to 2034

Figure 110: Eastern Europe Market Volume (Units) Analysis by Product, 2019 to 2034

Figure 111: Eastern Europe Market Value Share (%) and BPS Analysis by Product, 2024 to 2034

Figure 112: Eastern Europe Market Y-o-Y Growth (%) Projections by Product, 2024 to 2034

Figure 113: Eastern Europe Market Value (US$ Million) Analysis by Material, 2019 to 2034

Figure 114: Eastern Europe Market Volume (Units) Analysis by Material, 2019 to 2034

Figure 115: Eastern Europe Market Value Share (%) and BPS Analysis by Material, 2024 to 2034

Figure 116: Eastern Europe Market Y-o-Y Growth (%) Projections by Material, 2024 to 2034

Figure 117: Eastern Europe Market Attractiveness by Capacity, 2024 to 2034

Figure 118: Eastern Europe Market Attractiveness by Product, 2024 to 2034

Figure 119: Eastern Europe Market Attractiveness by Material, 2024 to 2034

Figure 120: Eastern Europe Market Attractiveness by Country, 2024 to 2034

Figure 121: South Asia and Pacific Market Value (US$ Million) by Capacity, 2024 to 2034

Figure 122: South Asia and Pacific Market Value (US$ Million) by Product, 2024 to 2034

Figure 123: South Asia and Pacific Market Value (US$ Million) by Material, 2024 to 2034

Figure 124: South Asia and Pacific Market Value (US$ Million) by Country, 2024 to 2034

Figure 125: South Asia and Pacific Market Value (US$ Million) Analysis by Country, 2019 to 2034

Figure 126: South Asia and Pacific Market Volume (Units) Analysis by Country, 2019 to 2034

Figure 127: South Asia and Pacific Market Value Share (%) and BPS Analysis by Country, 2024 to 2034

Figure 128: South Asia and Pacific Market Y-o-Y Growth (%) Projections by Country, 2024 to 2034

Figure 129: South Asia and Pacific Market Value (US$ Million) Analysis by Capacity, 2019 to 2034

Figure 130: South Asia and Pacific Market Volume (Units) Analysis by Capacity, 2019 to 2034

Figure 131: South Asia and Pacific Market Value Share (%) and BPS Analysis by Capacity, 2024 to 2034

Figure 132: South Asia and Pacific Market Y-o-Y Growth (%) Projections by Capacity, 2024 to 2034

Figure 133: South Asia and Pacific Market Value (US$ Million) Analysis by Product, 2019 to 2034

Figure 134: South Asia and Pacific Market Volume (Units) Analysis by Product, 2019 to 2034

Figure 135: South Asia and Pacific Market Value Share (%) and BPS Analysis by Product, 2024 to 2034

Figure 136: South Asia and Pacific Market Y-o-Y Growth (%) Projections by Product, 2024 to 2034

Figure 137: South Asia and Pacific Market Value (US$ Million) Analysis by Material, 2019 to 2034

Figure 138: South Asia and Pacific Market Volume (Units) Analysis by Material, 2019 to 2034

Figure 139: South Asia and Pacific Market Value Share (%) and BPS Analysis by Material, 2024 to 2034

Figure 140: South Asia and Pacific Market Y-o-Y Growth (%) Projections by Material, 2024 to 2034

Figure 141: South Asia and Pacific Market Attractiveness by Capacity, 2024 to 2034

Figure 142: South Asia and Pacific Market Attractiveness by Product, 2024 to 2034

Figure 143: South Asia and Pacific Market Attractiveness by Material, 2024 to 2034

Figure 144: South Asia and Pacific Market Attractiveness by Country, 2024 to 2034

Figure 145: East Asia Market Value (US$ Million) by Capacity, 2024 to 2034

Figure 146: East Asia Market Value (US$ Million) by Product, 2024 to 2034

Figure 147: East Asia Market Value (US$ Million) by Material, 2024 to 2034

Figure 148: East Asia Market Value (US$ Million) by Country, 2024 to 2034

Figure 149: East Asia Market Value (US$ Million) Analysis by Country, 2019 to 2034

Figure 150: East Asia Market Volume (Units) Analysis by Country, 2019 to 2034

Figure 151: East Asia Market Value Share (%) and BPS Analysis by Country, 2024 to 2034

Figure 152: East Asia Market Y-o-Y Growth (%) Projections by Country, 2024 to 2034

Figure 153: East Asia Market Value (US$ Million) Analysis by Capacity, 2019 to 2034

Figure 154: East Asia Market Volume (Units) Analysis by Capacity, 2019 to 2034

Figure 155: East Asia Market Value Share (%) and BPS Analysis by Capacity, 2024 to 2034

Figure 156: East Asia Market Y-o-Y Growth (%) Projections by Capacity, 2024 to 2034

Figure 157: East Asia Market Value (US$ Million) Analysis by Product, 2019 to 2034

Figure 158: East Asia Market Volume (Units) Analysis by Product, 2019 to 2034

Figure 159: East Asia Market Value Share (%) and BPS Analysis by Product, 2024 to 2034

Figure 160: East Asia Market Y-o-Y Growth (%) Projections by Product, 2024 to 2034

Figure 161: East Asia Market Value (US$ Million) Analysis by Material, 2019 to 2034

Figure 162: East Asia Market Volume (Units) Analysis by Material, 2019 to 2034

Figure 163: East Asia Market Value Share (%) and BPS Analysis by Material, 2024 to 2034

Figure 164: East Asia Market Y-o-Y Growth (%) Projections by Material, 2024 to 2034

Figure 165: East Asia Market Attractiveness by Capacity, 2024 to 2034

Figure 166: East Asia Market Attractiveness by Product, 2024 to 2034

Figure 167: East Asia Market Attractiveness by Material, 2024 to 2034

Figure 168: East Asia Market Attractiveness by Country, 2024 to 2034

Figure 169: Middle East and Africa Market Value (US$ Million) by Capacity, 2024 to 2034

Figure 170: Middle East and Africa Market Value (US$ Million) by Product, 2024 to 2034

Figure 171: Middle East and Africa Market Value (US$ Million) by Material, 2024 to 2034

Figure 172: Middle East and Africa Market Value (US$ Million) by Country, 2024 to 2034

Figure 173: Middle East and Africa Market Value (US$ Million) Analysis by Country, 2019 to 2034

Figure 174: Middle East and Africa Market Volume (Units) Analysis by Country, 2019 to 2034

Figure 175: Middle East and Africa Market Value Share (%) and BPS Analysis by Country, 2024 to 2034

Figure 176: Middle East and Africa Market Y-o-Y Growth (%) Projections by Country, 2024 to 2034

Figure 177: Middle East and Africa Market Value (US$ Million) Analysis by Capacity, 2019 to 2034

Figure 178: Middle East and Africa Market Volume (Units) Analysis by Capacity, 2019 to 2034

Figure 179: Middle East and Africa Market Value Share (%) and BPS Analysis by Capacity, 2024 to 2034

Figure 180: Middle East and Africa Market Y-o-Y Growth (%) Projections by Capacity, 2024 to 2034

Figure 181: Middle East and Africa Market Value (US$ Million) Analysis by Product, 2019 to 2034

Figure 182: Middle East and Africa Market Volume (Units) Analysis by Product, 2019 to 2034

Figure 183: Middle East and Africa Market Value Share (%) and BPS Analysis by Product, 2024 to 2034

Figure 184: Middle East and Africa Market Y-o-Y Growth (%) Projections by Product, 2024 to 2034

Figure 185: Middle East and Africa Market Value (US$ Million) Analysis by Material, 2019 to 2034

Figure 186: Middle East and Africa Market Volume (Units) Analysis by Material, 2019 to 2034

Figure 187: Middle East and Africa Market Value Share (%) and BPS Analysis by Material, 2024 to 2034

Figure 188: Middle East and Africa Market Y-o-Y Growth (%) Projections by Material, 2024 to 2034

Figure 189: Middle East and Africa Market Attractiveness by Capacity, 2024 to 2034

Figure 190: Middle East and Africa Market Attractiveness by Product, 2024 to 2034

Figure 191: Middle East and Africa Market Attractiveness by Material, 2024 to 2034

Figure 192: Middle East and Africa Market Attractiveness by Country, 2024 to 2034

Frequently Asked Questions

What is the anticipated value of the Stirrer Market in 2024?

The stirrer market is projected to hit at USD 1,845.6 million by 2024.

What is the expected growth rate of the Stirrer Market from 2024 to 2034?

The stirrer market is slated for an 8.10% CAGR expansion by 2034.

What is the growth potential projected for the Stirrer Market by 2034?

The stirrer market is estimated to USD 4,026.9 million by 2034.

Which country is expected to lead the Stirrer Market?

India is poised to lead the market, experiencing an 8.7% CAGR through 2034.

What Product segment dominates the Stirrer domain?

The multi use stirrer maintained market dominance with a 66.00% share through 2024.

Explore Function-driven Packaging Insights

Future Market Insights

Stirrer Market