Strip Pack Market
Detailed Analysis of Strip Pack Market By Plastic, Polyethylene Terephthalate, Polyethylene, Polypropylene, Aluminum, Paper, and Other Types
Bio-based Plastics are the New Strip Packs. Know the Pulse of the Industry with FMI's Intelligence
Strip Pack Market Outlook (2023 to 2033)
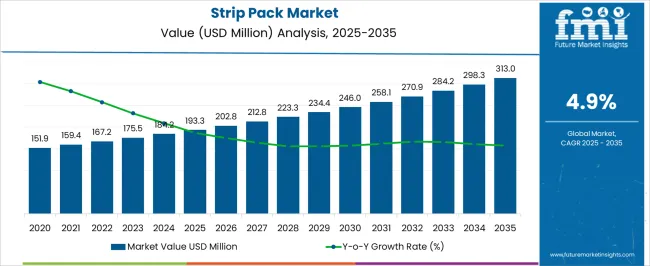
The global strip pack market is projected to secure a bearish CAGR of 5.2% during the forecast period, and attain a value of US$ 289.92 million by 2033. The current valuation of the market stands at US$ 174.63 million in 2023.
The strip pack machines ate gaining considerable adoption as they perform the operation of packaging pre-formed plastic packs, usually used for pharmaceutical tablets with unit dosage requirements. Although, lack of centralized purchasing can be identified as a key factor acting as a restraint in the global strip packs market.
Conversely, manufacturing strip packs in the form of bio-based plastics have been introduced into the market. This is opening new opportunities for companies in the market, and promoting a remarkable growth.
Attributes | Details |
---|---|
Historical Value (2022) | US$ 166 million |
Current Year Value (2023) | US$ 174.63 million |
Expected Forecast Value (2033) | US$ 289.92 million |
Projected CAGR (2023 to 2033) | 5.2% |
It is anticipated that strip packs are also being used for consumer goods, and it is witnessed that over the past few years there is a rise in demand for blisters and med compliance strip packs in the pharmaceutical industry, the strip packs are highly being utilized across different industries verticals for merits like protection against UV rays, durability and other.
Moreover, strip packs are incorporated with advanced technology that is eliminating the need for human intervention in the operation, control, and functioning of the production process. They are lightweight, which is further raising sales for pharmacy automation packaging strip packs.
Don't pay for what you don't need
Customize your report by selecting specific countries or regions and save 30%!
Driving Factors to Watch for in the Strip Pack Market
A number of factors are fueling the growth of the strip pack market. Some of the considerable driving factors are:
- These packs are exceptionally being received by the businesses and are attributed to the benefits like being tough, protection against environmental factors, tamper-proof, and inexpensive.
- Strip packs are opaque in nature that protect the objects from UV radiations of the sun.
- Strip packs are entitled to increase the shelf life of the products by creating a barrier for the oxygen and moisture due to multiple layers
- This product tends to reduce the spillage of the product, and provides the feature of anti-counterfeiting easy to open, simultaneously improving the recognition of the brand.
- Strip packs are available in customized packaging solutions for different sets of consumers.
- They are cost-effective and affordable in nature.
- The rising demand can also be attributed to strip packs gaining traction in the pharmaceutical industry for packaging products, and positively influencing the market.
All these factors are driving the strip packs market on a large scale and are further bolstering growth opportunities in the global forum.
Deterrents in the Strip Pack Market
Although it has been anticipated that there are many drivers in the strip packs market that are likely to contribute to a bullish market expansion in the upcoming years, it is also identified that some of the factors may restrain the growth of the strip pack market.
The lack of reimbursement policies for strip packs and lack of awareness regarding preventive measures for non-bio-degradable properties of the product in developing countries can obstruct the growth of the strip pack market.
There is the unsuitability of strip packs identified for usage in heavy products, which is expected to curb the growth of the strip packs market during the forecast period.
Remarkable Scopes for the Strip Pack Market
Key market players are striving to create opportunities for the strip pack market which is likely to diminish the major restraints, and maintain their presence in the market. These factors are expected to determine the future of the market and increase consumer demand.
- Governments of China and India are undertaking several projects and initiatives to encourage pharmaceutical and biopharmaceutical companies to develop and manufacture drugs for various infectious and chronic diseases. This emphasizes the development of life science infrastructure, and is likely to contribute significantly for the growth of the market.
- A remarkable increase in pharmaceutical manufacturing in both domestic and outsourced markets, is anticipated to expand the market size. Furthermore, governments are providing soft loans for pharmaceutical intestinal research and development (R&D) projects and a grant-in-aid for clinical trials to develop drugs for neglected diseases, which provides incredible scope for the market share.
Regional Outlook
Overview of North America Strip Packs Market
The North American regions are projected to be the supreme market players over the forecast period. Currently, they are accountable for 17% of the total market share of strip packs.
The market size of strip packs is expected to get further bolstered due to certain influential factors:
Attributes | Details |
---|---|
Growth of the Food & Beverage Sector | It is witnessed that the North American region is having an expansion of the food & beverage sectors, that |
Consumer Demand | The North American market can also be represented by consumers who are willing to pay for convenient packaging, owing to rising disposable income is likely to fuel the market size of strip packs n this region. |
Get the data you need at a Fraction of the cost
Personalize your report by choosing insights you need
and save 40%!
Country-wise Analysis
Country | Growth Factors |
---|---|
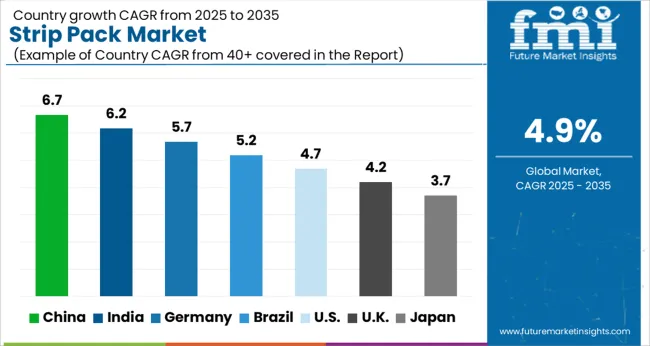
United States | The United States strip pack market is witnessing significant growth. Consumers in the United States are increasingly seeking convenience in product packaging. Strip packs provide easy-to-open, portable, and portion-controlled packaging, making them popular among busy consumers. This trend is particularly prominent in sectors including nutraceuticals, dietary supplements, and over-the-counter medications. The food and beverage industry plays a vital role in the market. The demand for single-serve packaging for snacks, candies, and other convenience foods is driving the adoption of strip packs. The consumer goods industry has also witnessed the adoption of strip packs for various products, such as breath fresheners, mint strips, and oral care products. The compact and portable nature of strip packs makes them suitable for on-the-go consumption. This also aligns with the changing consumer lifestyles and preferences. |
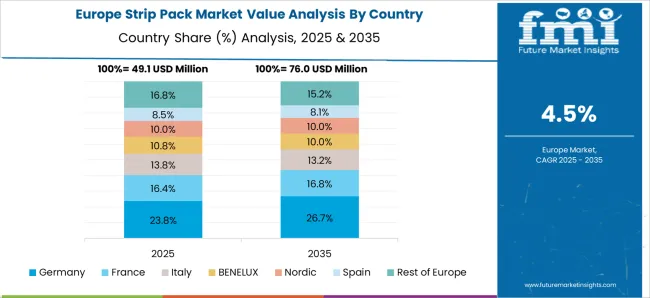
Growth Outlook in the Europe Strip Packs Market
Europe is projected to follow North America and is anticipated to have a steady advancement in the strip packs market in the upcoming years. At present Europe is holding 14% of the total market share of strip packs.
Factors attributing to the moderate market growth in the European regions can be projected as:
Attributes | Details |
---|---|
Well Establishment of Pharmaceutical Sectors | The pharmaceutical sector is having a rapid expansion in the European regions and therefore strip packs are largely being used as a convenient packaging solution for pharma products. |
Favorable Government Policies | Assistance is being received from the government bodies, with grants for further research and development activities on how strip packs can be implemented in different verticals. |
Country-wise Analysis
Country | Growth Factors |
---|---|
United Kingdom | The United Kingdom strip pack market has witnessed significant growth in recent years. There is a growing emphasis on sustainability and environmental consciousness in the United Kingdom, which is influencing the strip pack industry. Manufacturers are increasingly adopting eco-friendly packaging materials and designs to reduce the environmental impact. The demand for recyclable and biodegradable strip packs has been on the rise, driven by consumer preferences and regulatory requirements. The growing interest in health and wellness among consumers has led to a rise in the nutraceutical and food supplement industry. Strip packs offer an ideal packaging format for these products. |
Germany | Germany is one of the leading pharmaceutical markets in Europe, which directly influences the demand for strip packs. The country's aging population, increased focus on healthcare, and rising disposable income have contributed to the growth of the pharmaceutical industry and, subsequently, the Germany strip pack market. There is a growing preference for child-resistant packaging in Germany, especially for medications. This trend is driven by the need to enhance child safety and prevent accidental ingestion of medication. The confectionery sector in Germany has witnessed a shift towards portion-controlled and on-the-go packaging formats. |
Prospects for Expansion in the Asia Pacific Strip Packs Market
The market in the Asia Pacific region has experienced robust growth over the past few years and is expected to continue its upward trajectory. The increasing demand for cost-effective and convenient packaging solutions, coupled with the rising prevalence of chronic diseases and the expanding pharmaceutical industry in the region, are driving the market growth.
The projected causes of the moderate market growth in the Asia Pacific regions can be identified as follows:
Attributes | Details |
---|---|
Growing Pharmaceutical Industry | The expanding healthcare sector in the Asia Pacific region, driven by an aging population and rising healthcare expenditure, is fueling the demand for strip packs. |
Shift toward Sustainable Packaging | With increasing environmental concerns, there is a growing trend toward sustainable packaging solutions, including the use of eco-friendly materials and recyclable strip packs. |
Country-wise Analysis
Country | Growth Factors |
---|---|
China | The demand for unit-dose packaging solutions, including strip packs, is rising in China due to their convenience, portability, and accurate dosage delivery. Rapid urbanization has contributed to the growth of the China strip pack market. As more people migrate to urban areas, there is an increasing demand for compact and portable packaging solutions that are convenient for on-the-go consumption. The booming e-commerce industry in China has also positively impacted the strip pack industry. The rise of online shopping platforms has increased the demand for smaller-sized, lightweight packaging formats that are suitable for shipping and handling. |
India | India's pharmaceutical industry has been witnessing steady growth, driven by factors such as a large population, increasing healthcare awareness, and rising disposable incomes. This growth has positively impacted the demand for strip packs. While the strip pack sector in urban areas is well-established, rural India has significant untapped potential. With the government's focus on improving healthcare infrastructure and expanding access to medicines in rural areas, the demand for strip packs is expected to rise. The overall growth of the packaging industry directly impacts the India strip pack market. While the market in urban areas is well-established, there is significant untapped potential in rural India. |
Japan | In Japan, there is a strong emphasis on cleanliness, convenience, and efficiency. Strip packs align well with these cultural preferences as they offer individual dosages, ease of use, and tamper-evident features. The compact nature of strip packs also appeals to the limited storage spaces often found in Japanese households. Japan has one of the fastest aging populations globally, leading to a surge in healthcare expenditure. As a result, the pharmaceutical industry is witnessing substantial growth, driving the demand for strip-pack packaging solutions that ensure easy handling and dosage accuracy for elderly patients. |
Category-wise Insights
Is Customization the Secret to Plastic's Dominance in Strip Pack Packaging?
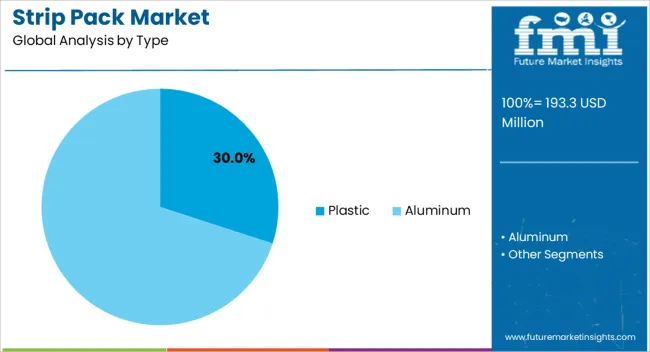
The dominance of the plastic segment in the strip pack market can be attributed its flexibility and versatility. It allows for easy molding into various shapes and sizes to accommodate different product requirements. Additionally, plastic is a cost-effective option compared to alternatives like aluminum or paper. This makes it an attractive choice for manufacturers seeking affordable packaging solutions. Plastic strip packs also provide excellent barrier properties, preserving the quality and shelf life of sensitive products by offering moisture resistance, light protection, and oxygen barrier. The convenience factor plays a significant role as well, as plastic strip packs often feature individual compartments or pockets for easy access to each dose or unit, making them portable and suitable for travel. Finally, plastic strip packs allow for customization and branding, with the ability to print labels and logos, enhancing product identification and brand recognition.
Why are Strip Packs Gaining Prominence as the Preferred Medication Packaging?
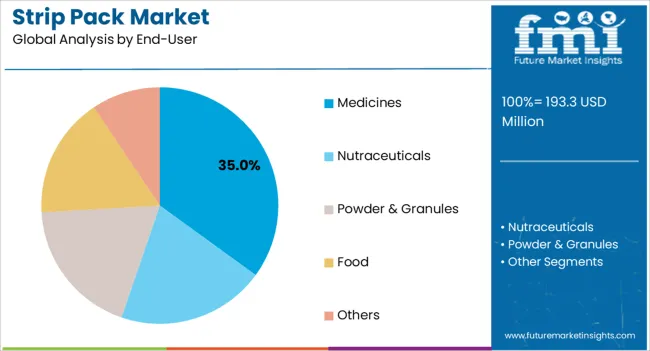
The medicines segment holds a dominant position in the strip pack market by end users due to several key factors. Firstly, the high demand for medicines, driven by their wide usage for various health conditions, contributes to the significant market size of this segment. Additionally, the prevalence of chronic diseases and the aging population further bolster the demand for medications, as individuals require regular and organized doses. Strip packs offer convenience and aid in medication compliance, making them attractive for patients who need to manage multiple medications. Moreover, pharmacies and healthcare institutions prefer strip packs for efficient dispensing, enhancing workflow and patient safety. Regulatory guidelines and increased awareness of strip packs have also propelled the adoption of this packaging solution by pharmaceutical companies.
Start-up Ecosystem
Key Start-Up Indulgences Bolstering the Strip Pack Market
The start-ups in the strip pack market are largely involved in making new market initiatives with frequent innovations. The market potential is being analyzed by the new entrants and they are investing in research and development activities to facilitate the production of high-quality, durable strip packs to meet the end-user requirements.
Three emerging start-ups to watch for:
Company Name | Compack, Israeli Start-Up |
---|---|
Year of Foundation | 2020 |
Total Funding | Undisclosed |
Developments | They are providing facilities for on-demand custom packaging. The start-up’s online packaging vendor hub allows users to create custom strip packs with structural design flexibility and graphic personalization options. |
Company Name | Cirqle, Danish Start-Up |
---|---|
Year of Foundation | 2020 |
Total Funding | $1800000 |
Developments | This start-up combines intelligent packaging and an online platform to track and tag companies’ packaging pools. Consumers are also able to return the package at the time of delivery or through pick-up services. |
Company Name | Mushroom Material, New Zealand Start-Up |
---|---|
Year of Foundation | 2020 |
Total Funding | $ 100000 |
Developments | This start-up combines the vegetative part of mushrooms, mycelium, and fibrous agriculture waste to develop its material. Moreover, the resulting material is biodegradable and easily fits into existing processes while providing the same protective properties as polystyrene. |
Competitive Landscape
Take of Key Market Players in the Strip Pack Market
Recent Development
Manufacturers in the global strip pack market are deploying unique strategies to increase the prominence and maximum adoption of strip packs in the coming years.
Strategy 1: Plastic Free Alternatives
In 2019, IUV developed consumer habits and corporate responsibility by encouraging the strip pack and packaging sector to remove plastic from the supply chain and reduce environmental pollution. His strategy has further aided the efficient replacement of conventional material without quality loss and is complying with the bio-based materials regulations imposed by the government.
Strategy 2: End-To-End Automation
In 2019, Plexiform Packaging Services indulged in mergers and acquisitions to develop automotive packaging. For specific products, automotive packaging services are tailored, which in turn would improve the part protection, and reduce in-transit damages.
Key companies proliferating in the strip pack market are:
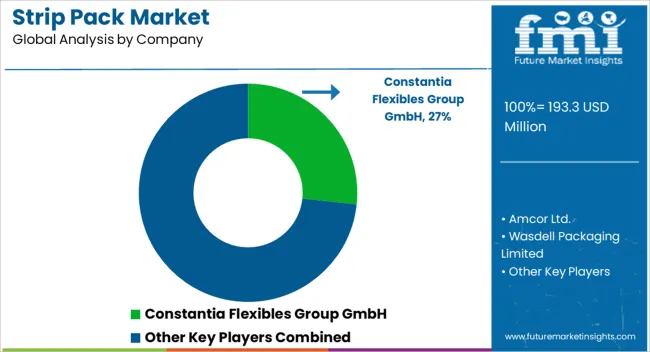
- Constantia Flexibles Group GmbH - They are a manufacturer of flexible packaging headquartered in Vienna, Austria. The group supplies its products to numerous multinational corporations and local market leaders in the food, pet food, pharmaceuticals and beverage industries.
- Amcor Ltd. - They are an American-Australian global packaging company. They develop and produce flexible packaging, rigid containers, specialty cartons, closures and services for food, beverage, pharmaceutical, medical-device, home and personal-care, and other products.
- Wasdell Packaging Limited - They support customers from clinical to commercial supply, with a particular focus on flexible, small batch packaging and oral liquid manufacturing. Their approach is customer-centric, and they offer the pharmaceutical, nutraceutical and veterinary industries tailored solutions that meet their needs.
- Bemis Company Inc. - They were a global manufacturer of flexible packaging products (ranging from self-venting cook-in-bag packaging and retort packaging for shelf-stable products, to vacuum packaging for meat products and puncture-resistant, sterile medical packaging) and pressure-sensitive materials. In June 11, 2019, Amcor announced it would acquire the company for $5.25 billion in shares. The deal completed on June 11, 2019, and all operations have been merged with Amcor.
Other market participants proliferating in the strip pack market are:
- Mikart Inc.
- ACG Pharmapack Private Limited
- Svam Packaging Industries Pvt. Ltd.
Key Companies Profiled
- Constantia Flexibles Group GmbH
- Amcor Ltd.
- Wasdell Packaging Limited
- Bemis Company, Inc.
- Mikart, Inc.
- ACG Pharmapack Private Limited
- Svam Packaging Industries Pvt. Ltd.
Key Segments in The Strip Pack Market
By Type:
- Plastic
- Polyethylene Terephthalate (PET)
- Polyethylene (PE)
- Polypropylene (PP)
- Others
- Aluminum
- Paper
- Others
By End-User:
- Medicines
- Nutraceuticals
- Powder & granules
- Food
- Others
By Region:
- North America
- Latin America
- Asia Pacific
- MEA
- Europe
Frequently Asked Questions
What will the Strip Pack Market's size be in 2023?
In 2023, the market is expected to attain US$ 174.63 million.
In 2033, how big will the Strip Pack Market be?
The sales to spur to US$ 289.92 million in 2033.
What is the CAGR of Strip Pack Market growth?
Through 2033, the market is set to evolve at a CAGR of 5.2%.
What is North America's share of the Strip Pack Market's?
North America contributes 17% of the global market share.
How is the European Strip Pack Market's faring?
Europe accounts for 14% of the overall market share for strip packs.
Table of Content
1. Executive Summary 1.1. Global Market Outlook 1.2. Demand-side Trends 1.3. Supply-side Trends 1.4. Technology Roadmap Analysis 1.5. Analysis and Recommendations 2. Market Overview 2.1. Market Coverage / Taxonomy 2.2. Market Definition / Scope / Limitations 3. Market Background 3.1. Market Dynamics 3.1.1. Drivers 3.1.2. Restraints 3.1.3. Opportunity 3.1.4. Trends 3.2. Scenario Forecast 3.2.1. Demand in Optimistic Scenario 3.2.2. Demand in Likely Scenario 3.2.3. Demand in Conservative Scenario 3.3. Opportunity Map Analysis 3.4. Product Life Cycle Analysis 3.5. Supply Chain Analysis 3.5.1. Supply Side Participants and their Roles 3.5.1.1. Producers 3.5.1.2. Mid-Level Participants (Traders/ Agents/ Brokers) 3.5.1.3. Wholesalers and Distributors 3.5.2. Value Added and Value Created at Node in the Supply Chain 3.5.3. List of Raw Material Suppliers 3.5.4. List of Existing and Potential Buyer’s 3.6. Investment Feasibility Matrix 3.7. Value Chain Analysis 3.7.1. Profit Margin Analysis 3.7.2. Wholesalers and Distributors 3.7.3. Retailers 3.8. PESTLE and Porter’s Analysis 3.9. Regulatory Landscape 3.9.1. By Key Regions 3.9.2. By Key Countries 3.10. Regional Parent Market Outlook 3.11. Production and Consumption Statistics 3.12. Import and Export Statistics 4. Global Market Analysis 2018 to 2022 and Forecast, 2023 to 2033 4.1. Historical Market Size Value (US$ Million) & Volume (Units) Analysis, 2018 to 2022 4.2. Current and Future Market Size Value (US$ Million) & Volume (Units) Projections, 2023 to 2033 4.2.1. Y-o-Y Growth Trend Analysis 4.2.2. Absolute $ Opportunity Analysis 5. Global Market Analysis 2018 to 2022 and Forecast 2023 to 2033, By Type 5.1. Introduction / Key Findings 5.2. Historical Market Size Value (US$ Million) & Volume (Units) Analysis By Type, 2018 to 2022 5.3. Current and Future Market Size Value (US$ Million) & Volume (Units) Analysis and Forecast By Type, 2023 to 2033 5.3.1. Plastic 5.3.2. Polyethylene Terephthalate (PET) 5.3.3. Polyethylene (PE) 5.3.4. Polypropylene (PP) 5.3.5. Aluminum 5.3.6. Paper 5.3.7. Others 5.4. Y-o-Y Growth Trend Analysis By Type, 2018 to 2022 5.5. Absolute $ Opportunity Analysis By Type, 2023 to 2033 6. Global Market Analysis 2018 to 2022 and Forecast 2023 to 2033, By End-User 6.1. Introduction / Key Findings 6.2. Historical Market Size Value (US$ Million) & Volume (Units) Analysis By End-User, 2018 to 2022 6.3. Current and Future Market Size Value (US$ Million) & Volume (Units) Analysis and Forecast By End-User, 2023 to 2033 6.3.1. Medicines 6.3.2. Nutraceuticals 6.3.3. Powder & granules 6.3.4. Food 6.3.5. Others 6.4. Y-o-Y Growth Trend Analysis By End-User, 2018 to 2022 6.5. Absolute $ Opportunity Analysis By End-User, 2023 to 2033 7. Global Market Analysis 2018 to 2022 and Forecast 2023 to 2033, By Region 7.1. Introduction 7.2. Historical Market Size Value (US$ Million) & Volume (Units) Analysis By Region, 2018 to 2022 7.3. Current Market Size Value (US$ Million) & Volume (Units) Analysis and Forecast By Region, 2023 to 2033 7.3.1. North America 7.3.2. Latin America 7.3.3. Western Europe 7.3.4. Eastern Europe 7.3.5. South Asia and Pacific 7.3.6. East Asia 7.3.7. Middle East and Africa 7.4. Market Attractiveness Analysis By Region 8. North America Market Analysis 2018 to 2022 and Forecast 2023 to 2033, By Country 8.1. Historical Market Size Value (US$ Million) & Volume (Units) Trend Analysis By Market Taxonomy, 2018 to 2022 8.2. Market Size Value (US$ Million) & Volume (Units) Forecast By Market Taxonomy, 2023 to 2033 8.2.1. By Country 8.2.1.1. U.S. 8.2.1.2. Canada 8.2.2. By Type 8.2.3. By End-User 8.3. Market Attractiveness Analysis 8.3.1. By Country 8.3.2. By Type 8.3.3. By End-User 8.4. Key Takeaways 9. Latin America Market Analysis 2018 to 2022 and Forecast 2023 to 2033, By Country 9.1. Historical Market Size Value (US$ Million) & Volume (Units) Trend Analysis By Market Taxonomy, 2018 to 2022 9.2. Market Size Value (US$ Million) & Volume (Units) Forecast By Market Taxonomy, 2023 to 2033 9.2.1. By Country 9.2.1.1. Brazil 9.2.1.2. Mexico 9.2.1.3. Rest of Latin America 9.2.2. By Type 9.2.3. By End-User 9.3. Market Attractiveness Analysis 9.3.1. By Country 9.3.2. By Type 9.3.3. By End-User 9.4. Key Takeaways 10. Western Europe Market Analysis 2018 to 2022 and Forecast 2023 to 2033, By Country 10.1. Historical Market Size Value (US$ Million) & Volume (Units) Trend Analysis By Market Taxonomy, 2018 to 2022 10.2. Market Size Value (US$ Million) & Volume (Units) Forecast By Market Taxonomy, 2023 to 2033 10.2.1. By Country 10.2.1.1. Germany 10.2.1.2. U.K. 10.2.1.3. France 10.2.1.4. Spain 10.2.1.5. Italy 10.2.1.6. Rest of Western Europe 10.2.2. By Type 10.2.3. By End-User 10.3. Market Attractiveness Analysis 10.3.1. By Country 10.3.2. By Type 10.3.3. By End-User 10.4. Key Takeaways 11. Eastern Europe Market Analysis 2018 to 2022 and Forecast 2023 to 2033, By Country 11.1. Historical Market Size Value (US$ Million) & Volume (Units) Trend Analysis By Market Taxonomy, 2018 to 2022 11.2. Market Size Value (US$ Million) & Volume (Units) Forecast By Market Taxonomy, 2023 to 2033 11.2.1. By Country 11.2.1.1. Poland 11.2.1.2. Russia 11.2.1.3. Czech Republic 11.2.1.4. Romania 11.2.1.5. Rest of Eastern Europe 11.2.2. By Type 11.2.3. By End-User 11.3. Market Attractiveness Analysis 11.3.1. By Country 11.3.2. By Type 11.3.3. By End-User 11.4. Key Takeaways 12. South Asia and Pacific Market Analysis 2018 to 2022 and Forecast 2023 to 2033, By Country 12.1. Historical Market Size Value (US$ Million) & Volume (Units) Trend Analysis By Market Taxonomy, 2018 to 2022 12.2. Market Size Value (US$ Million) & Volume (Units) Forecast By Market Taxonomy, 2023 to 2033 12.2.1. By Country 12.2.1.1. India 12.2.1.2. Bangladesh 12.2.1.3. Australia 12.2.1.4. New Zealand 12.2.1.5. Rest of South Asia and Pacific 12.2.2. By Type 12.2.3. By End-User 12.3. Market Attractiveness Analysis 12.3.1. By Country 12.3.2. By Type 12.3.3. By End-User 12.4. Key Takeaways 13. East Asia Market Analysis 2018 to 2022 and Forecast 2023 to 2033, By Country 13.1. Historical Market Size Value (US$ Million) & Volume (Units) Trend Analysis By Market Taxonomy, 2018 to 2022 13.2. Market Size Value (US$ Million) & Volume (Units) Forecast By Market Taxonomy, 2023 to 2033 13.2.1. By Country 13.2.1.1. China 13.2.1.2. Japan 13.2.1.3. South Korea 13.2.2. By Type 13.2.3. By End-User 13.3. Market Attractiveness Analysis 13.3.1. By Country 13.3.2. By Type 13.3.3. By End-User 13.4. Key Takeaways 14. Middle East and Africa Market Analysis 2018 to 2022 and Forecast 2023 to 2033, By Country 14.1. Historical Market Size Value (US$ Million) & Volume (Units) Trend Analysis By Market Taxonomy, 2018 to 2022 14.2. Market Size Value (US$ Million) & Volume (Units) Forecast By Market Taxonomy, 2023 to 2033 14.2.1. By Country 14.2.1.1. GCC Countries 14.2.1.2. South Africa 14.2.1.3. Israel 14.2.1.4. Rest of MEA 14.2.2. By Type 14.2.3. By End-User 14.3. Market Attractiveness Analysis 14.3.1. By Country 14.3.2. By Type 14.3.3. By End-User 14.4. Key Takeaways 15. Key Countries Market Analysis 15.1. U.S. 15.1.1. Pricing Analysis 15.1.2. Market Share Analysis, 2022 15.1.2.1. By Type 15.1.2.2. By End-User 15.2. Canada 15.2.1. Pricing Analysis 15.2.2. Market Share Analysis, 2022 15.2.2.1. By Type 15.2.2.2. By End-User 15.3. Brazil 15.3.1. Pricing Analysis 15.3.2. Market Share Analysis, 2022 15.3.2.1. By Type 15.3.2.2. By End-User 15.4. Mexico 15.4.1. Pricing Analysis 15.4.2. Market Share Analysis, 2022 15.4.2.1. By Type 15.4.2.2. By End-User 15.5. Germany 15.5.1. Pricing Analysis 15.5.2. Market Share Analysis, 2022 15.5.2.1. By Type 15.5.2.2. By End-User 15.6. U.K. 15.6.1. Pricing Analysis 15.6.2. Market Share Analysis, 2022 15.6.2.1. By Type 15.6.2.2. By End-User 15.7. France 15.7.1. Pricing Analysis 15.7.2. Market Share Analysis, 2022 15.7.2.1. By Type 15.7.2.2. By End-User 15.8. Spain 15.8.1. Pricing Analysis 15.8.2. Market Share Analysis, 2022 15.8.2.1. By Type 15.8.2.2. By End-User 15.9. Italy 15.9.1. Pricing Analysis 15.9.2. Market Share Analysis, 2022 15.9.2.1. By Type 15.9.2.2. By End-User 15.10. Poland 15.10.1. Pricing Analysis 15.10.2. Market Share Analysis, 2022 15.10.2.1. By Type 15.10.2.2. By End-User 15.11. Russia 15.11.1. Pricing Analysis 15.11.2. Market Share Analysis, 2022 15.11.2.1. By Type 15.11.2.2. By End-User 15.12. Czech Republic 15.12.1. Pricing Analysis 15.12.2. Market Share Analysis, 2022 15.12.2.1. By Type 15.12.2.2. By End-User 15.13. Romania 15.13.1. Pricing Analysis 15.13.2. Market Share Analysis, 2022 15.13.2.1. By Type 15.13.2.2. By End-User 15.14. India 15.14.1. Pricing Analysis 15.14.2. Market Share Analysis, 2022 15.14.2.1. By Type 15.14.2.2. By End-User 15.15. Bangladesh 15.15.1. Pricing Analysis 15.15.2. Market Share Analysis, 2022 15.15.2.1. By Type 15.15.2.2. By End-User 15.16. Australia 15.16.1. Pricing Analysis 15.16.2. Market Share Analysis, 2022 15.16.2.1. By Type 15.16.2.2. By End-User 15.17. New Zealand 15.17.1. Pricing Analysis 15.17.2. Market Share Analysis, 2022 15.17.2.1. By Type 15.17.2.2. By End-User 15.18. China 15.18.1. Pricing Analysis 15.18.2. Market Share Analysis, 2022 15.18.2.1. By Type 15.18.2.2. By End-User 15.19. Japan 15.19.1. Pricing Analysis 15.19.2. Market Share Analysis, 2022 15.19.2.1. By Type 15.19.2.2. By End-User 15.20. South Korea 15.20.1. Pricing Analysis 15.20.2. Market Share Analysis, 2022 15.20.2.1. By Type 15.20.2.2. By End-User 15.21. GCC Countries 15.21.1. Pricing Analysis 15.21.2. Market Share Analysis, 2022 15.21.2.1. By Type 15.21.2.2. By End-User 15.22. South Africa 15.22.1. Pricing Analysis 15.22.2. Market Share Analysis, 2022 15.22.2.1. By Type 15.22.2.2. By End-User 15.23. Israel 15.23.1. Pricing Analysis 15.23.2. Market Share Analysis, 2022 15.23.2.1. By Type 15.23.2.2. By End-User 16. Market Structure Analysis 16.1. Competition Dashboard 16.2. Competition Benchmarking 16.3. Market Share Analysis of Top Players 16.3.1. By Regional 16.3.2. By Type 16.3.3. By End-User 17. Competition Analysis 17.1. Competition Deep Dive 17.1.1. Constantia Flexibles Group GmbH 17.1.1.1. Overview 17.1.1.2. Product Portfolio 17.1.1.3. Profitability by Market Segments 17.1.1.4. Sales Footprint 17.1.1.5. Strategy Overview 17.1.1.5.1. Marketing Strategy 17.1.1.5.2. Product Strategy 17.1.1.5.3. Channel Strategy 17.1.2. Amcor Ltd. 17.1.2.1. Overview 17.1.2.2. Product Portfolio 17.1.2.3. Profitability by Market Segments 17.1.2.4. Sales Footprint 17.1.2.5. Strategy Overview 17.1.2.5.1. Marketing Strategy 17.1.2.5.2. Product Strategy 17.1.2.5.3. Channel Strategy 17.1.3. Wasdell Packaging Limited 17.1.3.1. Overview 17.1.3.2. Product Portfolio 17.1.3.3. Profitability by Market Segments 17.1.3.4. Sales Footprint 17.1.3.5. Strategy Overview 17.1.3.5.1. Marketing Strategy 17.1.3.5.2. Product Strategy 17.1.3.5.3. Channel Strategy 17.1.4. Bemis Company, Inc. 17.1.4.1. Overview 17.1.4.2. Product Portfolio 17.1.4.3. Profitability by Market Segments 17.1.4.4. Sales Footprint 17.1.4.5. Strategy Overview 17.1.4.5.1. Marketing Strategy 17.1.4.5.2. Product Strategy 17.1.4.5.3. Channel Strategy 17.1.5. Mikart, Inc. 17.1.5.1. Overview 17.1.5.2. Product Portfolio 17.1.5.3. Profitability by Market Segments 17.1.5.4. Sales Footprint 17.1.5.5. Strategy Overview 17.1.5.5.1. Marketing Strategy 17.1.5.5.2. Product Strategy 17.1.5.5.3. Channel Strategy 17.1.6. ACG Pharmapack Private Limited 17.1.6.1. Overview 17.1.6.2. Product Portfolio 17.1.6.3. Profitability by Market Segments 17.1.6.4. Sales Footprint 17.1.6.5. Strategy Overview 17.1.6.5.1. Marketing Strategy 17.1.6.5.2. Product Strategy 17.1.6.5.3. Channel Strategy 17.1.7. Svam Packaging Industries Pvt. Ltd. 17.1.7.1. Overview 17.1.7.2. Product Portfolio 17.1.7.3. Profitability by Market Segments 17.1.7.4. Sales Footprint 17.1.7.5. Strategy Overview 17.1.7.5.1. Marketing Strategy 17.1.7.5.2. Product Strategy 17.1.7.5.3. Channel Strategy 17.1.8. NGP Plastic SA 17.1.8.1. Overview 17.1.8.2. Product Portfolio 17.1.8.3. Profitability by Market Segments 17.1.8.4. Sales Footprint 17.1.8.5. Strategy Overview 17.1.8.5.1. Marketing Strategy 17.1.8.5.2. Product Strategy 17.1.8.5.3. Channel Strategy 17.1.9. Pactive LLC 17.1.9.1. Overview 17.1.9.2. Product Portfolio 17.1.9.3. Profitability by Market Segments 17.1.9.4. Sales Footprint 17.1.9.5. Strategy Overview 17.1.9.5.1. Marketing Strategy 17.1.9.5.2. Product Strategy 17.1.9.5.3. Channel Strategy 17.1.10. Element Pack Pty Ltd. 17.1.10.1. Overview 17.1.10.2. Product Portfolio 17.1.10.3. Profitability by Market Segments 17.1.10.4. Sales Footprint 17.1.10.5. Strategy Overview 17.1.10.5.1. Marketing Strategy 17.1.10.5.2. Product Strategy 17.1.10.5.3. Channel Strategy 18. Assumptions & Acronyms Used 19. Research Methodology
Don't pay for what you don't need
Customize your report by selecting specific countries or regions and save 30%!
List of Tables
Table 1: Global Market Value (US$ Million) Forecast by Region, 2018 to 2033 Table 2: Global Market Volume (Units) Forecast by Region, 2018 to 2033 Table 3: Global Market Value (US$ Million) Forecast by Type, 2018 to 2033 Table 4: Global Market Volume (Units) Forecast by Type, 2018 to 2033 Table 5: Global Market Value (US$ Million) Forecast by End-User, 2018 to 2033 Table 6: Global Market Volume (Units) Forecast by End-User, 2018 to 2033 Table 7: North America Market Value (US$ Million) Forecast by Country, 2018 to 2033 Table 8: North America Market Volume (Units) Forecast by Country, 2018 to 2033 Table 9: North America Market Value (US$ Million) Forecast by Type, 2018 to 2033 Table 10: North America Market Volume (Units) Forecast by Type, 2018 to 2033 Table 11: North America Market Value (US$ Million) Forecast by End-User, 2018 to 2033 Table 12: North America Market Volume (Units) Forecast by End-User, 2018 to 2033 Table 13: Latin America Market Value (US$ Million) Forecast by Country, 2018 to 2033 Table 14: Latin America Market Volume (Units) Forecast by Country, 2018 to 2033 Table 15: Latin America Market Value (US$ Million) Forecast by Type, 2018 to 2033 Table 16: Latin America Market Volume (Units) Forecast by Type, 2018 to 2033 Table 17: Latin America Market Value (US$ Million) Forecast by End-User, 2018 to 2033 Table 18: Latin America Market Volume (Units) Forecast by End-User, 2018 to 2033 Table 19: Western Europe Market Value (US$ Million) Forecast by Country, 2018 to 2033 Table 20: Western Europe Market Volume (Units) Forecast by Country, 2018 to 2033 Table 21: Western Europe Market Value (US$ Million) Forecast by Type, 2018 to 2033 Table 22: Western Europe Market Volume (Units) Forecast by Type, 2018 to 2033 Table 23: Western Europe Market Value (US$ Million) Forecast by End-User, 2018 to 2033 Table 24: Western Europe Market Volume (Units) Forecast by End-User, 2018 to 2033 Table 25: Eastern Europe Market Value (US$ Million) Forecast by Country, 2018 to 2033 Table 26: Eastern Europe Market Volume (Units) Forecast by Country, 2018 to 2033 Table 27: Eastern Europe Market Value (US$ Million) Forecast by Type, 2018 to 2033 Table 28: Eastern Europe Market Volume (Units) Forecast by Type, 2018 to 2033 Table 29: Eastern Europe Market Value (US$ Million) Forecast by End-User, 2018 to 2033 Table 30: Eastern Europe Market Volume (Units) Forecast by End-User, 2018 to 2033 Table 31: South Asia and Pacific Market Value (US$ Million) Forecast by Country, 2018 to 2033 Table 32: South Asia and Pacific Market Volume (Units) Forecast by Country, 2018 to 2033 Table 33: South Asia and Pacific Market Value (US$ Million) Forecast by Type, 2018 to 2033 Table 34: South Asia and Pacific Market Volume (Units) Forecast by Type, 2018 to 2033 Table 35: South Asia and Pacific Market Value (US$ Million) Forecast by End-User, 2018 to 2033 Table 36: South Asia and Pacific Market Volume (Units) Forecast by End-User, 2018 to 2033 Table 37: East Asia Market Value (US$ Million) Forecast by Country, 2018 to 2033 Table 38: East Asia Market Volume (Units) Forecast by Country, 2018 to 2033 Table 39: East Asia Market Value (US$ Million) Forecast by Type, 2018 to 2033 Table 40: East Asia Market Volume (Units) Forecast by Type, 2018 to 2033 Table 41: East Asia Market Value (US$ Million) Forecast by End-User, 2018 to 2033 Table 42: East Asia Market Volume (Units) Forecast by End-User, 2018 to 2033 Table 43: Middle East and Africa Market Value (US$ Million) Forecast by Country, 2018 to 2033 Table 44: Middle East and Africa Market Volume (Units) Forecast by Country, 2018 to 2033 Table 45: Middle East and Africa Market Value (US$ Million) Forecast by Type, 2018 to 2033 Table 46: Middle East and Africa Market Volume (Units) Forecast by Type, 2018 to 2033 Table 47: Middle East and Africa Market Value (US$ Million) Forecast by End-User, 2018 to 2033 Table 48: Middle East and Africa Market Volume (Units) Forecast by End-User, 2018 to 2033
List of Charts
Figure 1: Global Market Value (US$ Million) by Type, 2023 to 2033 Figure 2: Global Market Value (US$ Million) by End-User, 2023 to 2033 Figure 3: Global Market Value (US$ Million) by Region, 2023 to 2033 Figure 4: Global Market Value (US$ Million) Analysis by Region, 2018 to 2033 Figure 5: Global Market Volume (Units) Analysis by Region, 2018 to 2033 Figure 6: Global Market Value Share (%) and BPS Analysis by Region, 2023 to 2033 Figure 7: Global Market Y-o-Y Growth (%) Projections by Region, 2023 to 2033 Figure 8: Global Market Value (US$ Million) Analysis by Type, 2018 to 2033 Figure 9: Global Market Volume (Units) Analysis by Type, 2018 to 2033 Figure 10: Global Market Value Share (%) and BPS Analysis by Type, 2023 to 2033 Figure 11: Global Market Y-o-Y Growth (%) Projections by Type, 2023 to 2033 Figure 12: Global Market Value (US$ Million) Analysis by End-User, 2018 to 2033 Figure 13: Global Market Volume (Units) Analysis by End-User, 2018 to 2033 Figure 14: Global Market Value Share (%) and BPS Analysis by End-User, 2023 to 2033 Figure 15: Global Market Y-o-Y Growth (%) Projections by End-User, 2023 to 2033 Figure 16: Global Market Attractiveness by Type, 2023 to 2033 Figure 17: Global Market Attractiveness by End-User, 2023 to 2033 Figure 18: Global Market Attractiveness by Region, 2023 to 2033 Figure 19: North America Market Value (US$ Million) by Type, 2023 to 2033 Figure 20: North America Market Value (US$ Million) by End-User, 2023 to 2033 Figure 21: North America Market Value (US$ Million) by Country, 2023 to 2033 Figure 22: North America Market Value (US$ Million) Analysis by Country, 2018 to 2033 Figure 23: North America Market Volume (Units) Analysis by Country, 2018 to 2033 Figure 24: North America Market Value Share (%) and BPS Analysis by Country, 2023 to 2033 Figure 25: North America Market Y-o-Y Growth (%) Projections by Country, 2023 to 2033 Figure 26: North America Market Value (US$ Million) Analysis by Type, 2018 to 2033 Figure 27: North America Market Volume (Units) Analysis by Type, 2018 to 2033 Figure 28: North America Market Value Share (%) and BPS Analysis by Type, 2023 to 2033 Figure 29: North America Market Y-o-Y Growth (%) Projections by Type, 2023 to 2033 Figure 30: North America Market Value (US$ Million) Analysis by End-User, 2018 to 2033 Figure 31: North America Market Volume (Units) Analysis by End-User, 2018 to 2033 Figure 32: North America Market Value Share (%) and BPS Analysis by End-User, 2023 to 2033 Figure 33: North America Market Y-o-Y Growth (%) Projections by End-User, 2023 to 2033 Figure 34: North America Market Attractiveness by Type, 2023 to 2033 Figure 35: North America Market Attractiveness by End-User, 2023 to 2033 Figure 36: North America Market Attractiveness by Country, 2023 to 2033 Figure 37: Latin America Market Value (US$ Million) by Type, 2023 to 2033 Figure 38: Latin America Market Value (US$ Million) by End-User, 2023 to 2033 Figure 39: Latin America Market Value (US$ Million) by Country, 2023 to 2033 Figure 40: Latin America Market Value (US$ Million) Analysis by Country, 2018 to 2033 Figure 41: Latin America Market Volume (Units) Analysis by Country, 2018 to 2033 Figure 42: Latin America Market Value Share (%) and BPS Analysis by Country, 2023 to 2033 Figure 43: Latin America Market Y-o-Y Growth (%) Projections by Country, 2023 to 2033 Figure 44: Latin America Market Value (US$ Million) Analysis by Type, 2018 to 2033 Figure 45: Latin America Market Volume (Units) Analysis by Type, 2018 to 2033 Figure 46: Latin America Market Value Share (%) and BPS Analysis by Type, 2023 to 2033 Figure 47: Latin America Market Y-o-Y Growth (%) Projections by Type, 2023 to 2033 Figure 48: Latin America Market Value (US$ Million) Analysis by End-User, 2018 to 2033 Figure 49: Latin America Market Volume (Units) Analysis by End-User, 2018 to 2033 Figure 50: Latin America Market Value Share (%) and BPS Analysis by End-User, 2023 to 2033 Figure 51: Latin America Market Y-o-Y Growth (%) Projections by End-User, 2023 to 2033 Figure 52: Latin America Market Attractiveness by Type, 2023 to 2033 Figure 53: Latin America Market Attractiveness by End-User, 2023 to 2033 Figure 54: Latin America Market Attractiveness by Country, 2023 to 2033 Figure 55: Western Europe Market Value (US$ Million) by Type, 2023 to 2033 Figure 56: Western Europe Market Value (US$ Million) by End-User, 2023 to 2033 Figure 57: Western Europe Market Value (US$ Million) by Country, 2023 to 2033 Figure 58: Western Europe Market Value (US$ Million) Analysis by Country, 2018 to 2033 Figure 59: Western Europe Market Volume (Units) Analysis by Country, 2018 to 2033 Figure 60: Western Europe Market Value Share (%) and BPS Analysis by Country, 2023 to 2033 Figure 61: Western Europe Market Y-o-Y Growth (%) Projections by Country, 2023 to 2033 Figure 62: Western Europe Market Value (US$ Million) Analysis by Type, 2018 to 2033 Figure 63: Western Europe Market Volume (Units) Analysis by Type, 2018 to 2033 Figure 64: Western Europe Market Value Share (%) and BPS Analysis by Type, 2023 to 2033 Figure 65: Western Europe Market Y-o-Y Growth (%) Projections by Type, 2023 to 2033 Figure 66: Western Europe Market Value (US$ Million) Analysis by End-User, 2018 to 2033 Figure 67: Western Europe Market Volume (Units) Analysis by End-User, 2018 to 2033 Figure 68: Western Europe Market Value Share (%) and BPS Analysis by End-User, 2023 to 2033 Figure 69: Western Europe Market Y-o-Y Growth (%) Projections by End-User, 2023 to 2033 Figure 70: Western Europe Market Attractiveness by Type, 2023 to 2033 Figure 71: Western Europe Market Attractiveness by End-User, 2023 to 2033 Figure 72: Western Europe Market Attractiveness by Country, 2023 to 2033 Figure 73: Eastern Europe Market Value (US$ Million) by Type, 2023 to 2033 Figure 74: Eastern Europe Market Value (US$ Million) by End-User, 2023 to 2033 Figure 75: Eastern Europe Market Value (US$ Million) by Country, 2023 to 2033 Figure 76: Eastern Europe Market Value (US$ Million) Analysis by Country, 2018 to 2033 Figure 77: Eastern Europe Market Volume (Units) Analysis by Country, 2018 to 2033 Figure 78: Eastern Europe Market Value Share (%) and BPS Analysis by Country, 2023 to 2033 Figure 79: Eastern Europe Market Y-o-Y Growth (%) Projections by Country, 2023 to 2033 Figure 80: Eastern Europe Market Value (US$ Million) Analysis by Type, 2018 to 2033 Figure 81: Eastern Europe Market Volume (Units) Analysis by Type, 2018 to 2033 Figure 82: Eastern Europe Market Value Share (%) and BPS Analysis by Type, 2023 to 2033 Figure 83: Eastern Europe Market Y-o-Y Growth (%) Projections by Type, 2023 to 2033 Figure 84: Eastern Europe Market Value (US$ Million) Analysis by End-User, 2018 to 2033 Figure 85: Eastern Europe Market Volume (Units) Analysis by End-User, 2018 to 2033 Figure 86: Eastern Europe Market Value Share (%) and BPS Analysis by End-User, 2023 to 2033 Figure 87: Eastern Europe Market Y-o-Y Growth (%) Projections by End-User, 2023 to 2033 Figure 88: Eastern Europe Market Attractiveness by Type, 2023 to 2033 Figure 89: Eastern Europe Market Attractiveness by End-User, 2023 to 2033 Figure 90: Eastern Europe Market Attractiveness by Country, 2023 to 2033 Figure 91: South Asia and Pacific Market Value (US$ Million) by Type, 2023 to 2033 Figure 92: South Asia and Pacific Market Value (US$ Million) by End-User, 2023 to 2033 Figure 93: South Asia and Pacific Market Value (US$ Million) by Country, 2023 to 2033 Figure 94: South Asia and Pacific Market Value (US$ Million) Analysis by Country, 2018 to 2033 Figure 95: South Asia and Pacific Market Volume (Units) Analysis by Country, 2018 to 2033 Figure 96: South Asia and Pacific Market Value Share (%) and BPS Analysis by Country, 2023 to 2033 Figure 97: South Asia and Pacific Market Y-o-Y Growth (%) Projections by Country, 2023 to 2033 Figure 98: South Asia and Pacific Market Value (US$ Million) Analysis by Type, 2018 to 2033 Figure 99: South Asia and Pacific Market Volume (Units) Analysis by Type, 2018 to 2033 Figure 100: South Asia and Pacific Market Value Share (%) and BPS Analysis by Type, 2023 to 2033 Figure 101: South Asia and Pacific Market Y-o-Y Growth (%) Projections by Type, 2023 to 2033 Figure 102: South Asia and Pacific Market Value (US$ Million) Analysis by End-User, 2018 to 2033 Figure 103: South Asia and Pacific Market Volume (Units) Analysis by End-User, 2018 to 2033 Figure 104: South Asia and Pacific Market Value Share (%) and BPS Analysis by End-User, 2023 to 2033 Figure 105: South Asia and Pacific Market Y-o-Y Growth (%) Projections by End-User, 2023 to 2033 Figure 106: South Asia and Pacific Market Attractiveness by Type, 2023 to 2033 Figure 107: South Asia and Pacific Market Attractiveness by End-User, 2023 to 2033 Figure 108: South Asia and Pacific Market Attractiveness by Country, 2023 to 2033 Figure 109: East Asia Market Value (US$ Million) by Type, 2023 to 2033 Figure 110: East Asia Market Value (US$ Million) by End-User, 2023 to 2033 Figure 111: East Asia Market Value (US$ Million) by Country, 2023 to 2033 Figure 112: East Asia Market Value (US$ Million) Analysis by Country, 2018 to 2033 Figure 113: East Asia Market Volume (Units) Analysis by Country, 2018 to 2033 Figure 114: East Asia Market Value Share (%) and BPS Analysis by Country, 2023 to 2033 Figure 115: East Asia Market Y-o-Y Growth (%) Projections by Country, 2023 to 2033 Figure 116: East Asia Market Value (US$ Million) Analysis by Type, 2018 to 2033 Figure 117: East Asia Market Volume (Units) Analysis by Type, 2018 to 2033 Figure 118: East Asia Market Value Share (%) and BPS Analysis by Type, 2023 to 2033 Figure 119: East Asia Market Y-o-Y Growth (%) Projections by Type, 2023 to 2033 Figure 120: East Asia Market Value (US$ Million) Analysis by End-User, 2018 to 2033 Figure 121: East Asia Market Volume (Units) Analysis by End-User, 2018 to 2033 Figure 122: East Asia Market Value Share (%) and BPS Analysis by End-User, 2023 to 2033 Figure 123: East Asia Market Y-o-Y Growth (%) Projections by End-User, 2023 to 2033 Figure 124: East Asia Market Attractiveness by Type, 2023 to 2033 Figure 125: East Asia Market Attractiveness by End-User, 2023 to 2033 Figure 126: East Asia Market Attractiveness by Country, 2023 to 2033 Figure 127: Middle East and Africa Market Value (US$ Million) by Type, 2023 to 2033 Figure 128: Middle East and Africa Market Value (US$ Million) by End-User, 2023 to 2033 Figure 129: Middle East and Africa Market Value (US$ Million) by Country, 2023 to 2033 Figure 130: Middle East and Africa Market Value (US$ Million) Analysis by Country, 2018 to 2033 Figure 131: Middle East and Africa Market Volume (Units) Analysis by Country, 2018 to 2033 Figure 132: Middle East and Africa Market Value Share (%) and BPS Analysis by Country, 2023 to 2033 Figure 133: Middle East and Africa Market Y-o-Y Growth (%) Projections by Country, 2023 to 2033 Figure 134: Middle East and Africa Market Value (US$ Million) Analysis by Type, 2018 to 2033 Figure 135: Middle East and Africa Market Volume (Units) Analysis by Type, 2018 to 2033 Figure 136: Middle East and Africa Market Value Share (%) and BPS Analysis by Type, 2023 to 2033 Figure 137: Middle East and Africa Market Y-o-Y Growth (%) Projections by Type, 2023 to 2033 Figure 138: Middle East and Africa Market Value (US$ Million) Analysis by End-User, 2018 to 2033 Figure 139: Middle East and Africa Market Volume (Units) Analysis by End-User, 2018 to 2033 Figure 140: Middle East and Africa Market Value Share (%) and BPS Analysis by End-User, 2023 to 2033 Figure 141: Middle East and Africa Market Y-o-Y Growth (%) Projections by End-User, 2023 to 2033 Figure 142: Middle East and Africa Market Attractiveness by Type, 2023 to 2033 Figure 143: Middle East and Africa Market Attractiveness by End-User, 2023 to 2033 Figure 144: Middle East and Africa Market Attractiveness by Country, 2023 to 2033
Recommendations
Explore Packaging Insights
View Reports