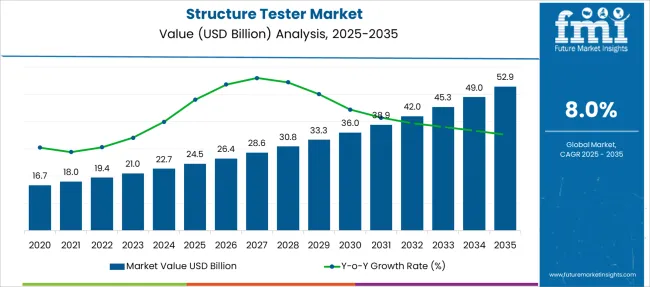
The Structure Tester Market is estimated to be valued at USD 24.5 billion in 2025 and is projected to reach USD 52.9 billion by 2035, registering a compound annual growth rate (CAGR) of 8.0% over the forecast period.
| Metric | Value |
|---|---|
| Structure Tester Market Estimated Value in (2025 E) | USD 24.5 billion |
| Structure Tester Market Forecast Value in (2035 F) | USD 52.9 billion |
| Forecast CAGR (2025 to 2035) | 8.0% |
The Structure Tester market is experiencing robust growth driven by increasing regulatory scrutiny, technological advancements in testing systems, and the widespread need for structural durability validation across multiple industries. This market has seen a notable shift from conventional mechanical testing to intelligent systems capable of delivering high-precision measurements and real-time analysis.
Growth is further being supported by investments in infrastructure modernization, especially in energy, construction, and transportation sectors, where structural safety is paramount. Advancements in sensor technologies, digital twins, and non-destructive testing tools are creating opportunities for more scalable and software-integrated tester platforms.
Additionally, the integration of AI and machine learning for predictive diagnostics and lifecycle assessment is redefining how structural data is captured and utilized With rising concerns about material fatigue, lifecycle costs, and equipment failures, the Structure Tester market is expected to gain strong traction in the years ahead, especially as industries prioritize performance validation and operational reliability across complex engineering environments.
The market is segmented by Industry, Component, and Test and region. By Industry, the market is divided into Energy, Aerospace, Automotive, Civil Engineering and Construction, and Others. In terms of Component, the market is classified into System and Accessories. Based on Test, the market is segmented into Static & Fatigue, Flight Test Support, Hydraulic, Coupon & Component, Helicopter Parts, and Others. Regionally, the market is classified into North America, Latin America, Western Europe, Eastern Europe, Balkan & Baltic Countries, Russia & Belarus, Central Asia, East Asia, South Asia & Pacific, and the Middle East & Africa.
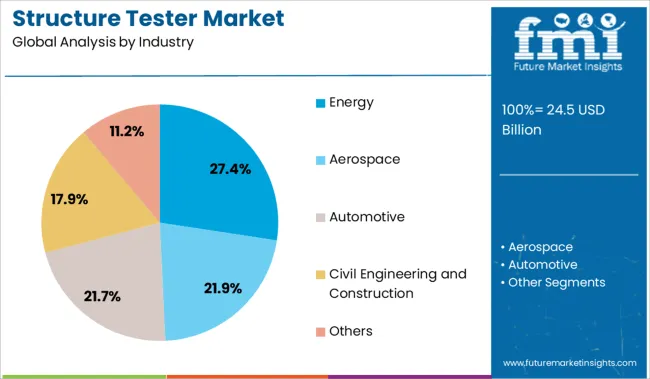
The energy industry segment is expected to hold 27.4% of the total revenue share in the Structure Tester market in 2025, positioning it as one of the most influential end-use sectors. Growth in this segment is being driven by stringent regulatory mandates for structural reliability in power generation and distribution infrastructure.
The aging of existing energy assets and the global transition toward renewable energy sources have created a heightened need for structural validation of wind turbine blades, solar racking systems, offshore platforms, and pipeline systems. Increased frequency of fatigue-related failures in high-stress environments has led to growing adoption of structure testing solutions to ensure long-term safety and performance.
The integration of load simulation, vibration analysis, and real-time stress monitoring systems has enabled proactive maintenance planning in energy operations As structural testing becomes an essential requirement in new project approvals and lifecycle assessments, the energy sector is expected to continue driving demand for sophisticated testing technologies across both conventional and renewable infrastructure assets.
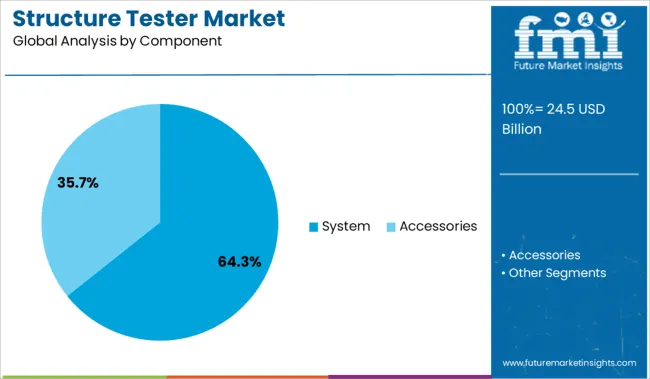
The system segment is projected to represent 64.3% of the Structure Tester market’s total revenue in 2025, reflecting its dominance as the primary component used in structural evaluation environments. This segment's leading position is being attributed to the increasing demand for fully integrated testing systems that encompass mechanical actuators, control software, high-speed sensors, and data analytics platforms.
Structural testers in system form have been preferred due to their ability to conduct multi-axis loading, fatigue simulation, and failure mode analysis with high accuracy and repeatability. The modular architecture of system-based testers allows seamless customization for industry-specific testing protocols and compliance standards.
Rising adoption of these systems in research labs, aerospace design facilities, and civil engineering projects has been supported by the growing emphasis on early-stage structural validation As the complexity of structures increases across various industries, integrated testing systems are becoming indispensable for delivering real-time insights and accelerating design optimization processes.
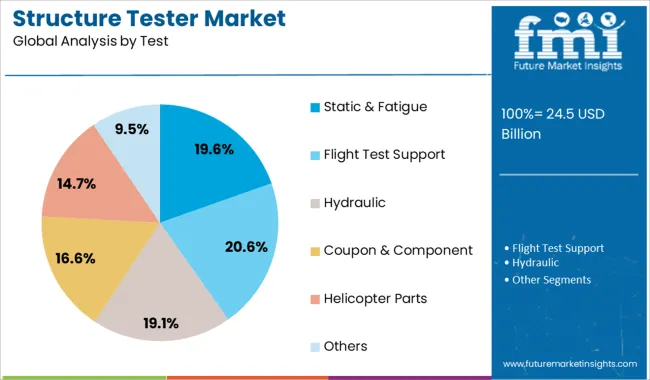
The static and fatigue test segment is expected to account for 19.6% of the total revenue share in the Structure Tester market in 2025, driven by the increasing need to evaluate material performance under long-term loading and repeated stress cycles. These tests have been critical in assessing the structural endurance and durability of components used in critical sectors such as aerospace, automotive, civil engineering, and energy.
Growing emphasis on life prediction, damage tolerance, and failure prevention has led to widespread implementation of fatigue and static loading tests during both R&D and quality control stages. Advances in servo-hydraulic and electromechanical actuators, paired with high-resolution data acquisition systems, have enabled more precise simulation of real-world load conditions.
Structural testers configured for static and fatigue applications are increasingly being integrated with digital analysis tools for early defect detection and compliance reporting As safety-critical applications demand higher levels of assurance, this segment is expected to remain integral to performance testing across a broad spectrum of engineering fields.
With the rapid growth of the economy and the continuous progress of industrial technology, civil structures are becoming larger and more complicated. Large-scale joint tests, large-scale structural tests, and full-sized structural tests are essential for sophisticated structures. Therefore, an increasing number of super structural testing machines have been built around the world. Structure tester has application in various industries such as aerospace, energy, automotive, construction, and others. In the construction sector, the Structure tester is used for testing mechanical validation of enclosures, building system, waste channels, Structure bearings, grates, waste channels, and others.
It is also mandated to get EOTA approvals for Structure testing of reactive bridge components. These bodies and approvals are creating a huge demand for Structure testers in the construction sector. The booming automotive sector is also creating a significant demand for Structure testers during the forecast period.
The increasing demand from the aerospace and construction sector is fuelling the demand for Structure testers and significantly driving the global Structure tester market. The Structure tester is used to measure fatigue strength or static strength of a structure by applying measured load.
The stringent regulations and standards such as NASM, ASTM, CEN, ISO, and DIN are key factors driving the global Structure tester market during the forecast period. Other factors such as rapid urbanization, increasing infrastructure projects, the growing number of aircraft and automobiles, and others are expected to drive the Structure tester market during the forecast period.
Software failure and frequent updates in software are hampering the growth of the global Structure tester market during the forecast period. However, vendors are continuously focused on the development of advanced Structure testers with upgraded technologies to overcome the above challenge.
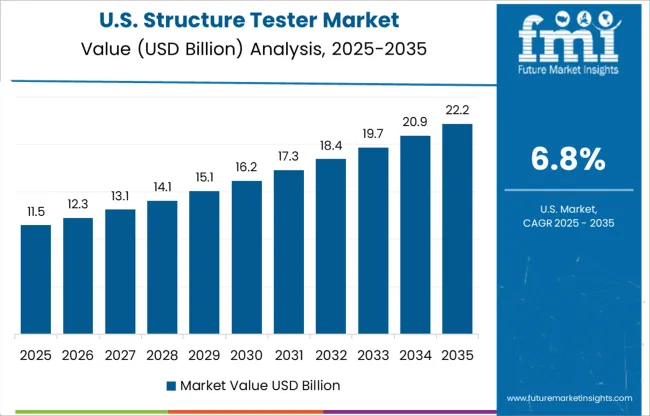
North America is expected to capture the largest share and the trend is expected to continue during the forecast period. The presence of a large number of manufacturers for aircraft and automotive is creating a huge demand for Structure testers in the USA Besides, the key players are making advanced developments to increase the testing capacity of the systems which is likely to expand their market size.
As per the recently published report by Future Market Insights, the aforementioned market for Structure Tester is anticipated to follow a CAGR of 8.2% throughout the forecast period (2025 to 2035).
In February 2024, materials testing equipment and software developer Instron announced the launch of the Torsion Add-On 3.0 for universal testing systems. The company has recently redesigned the system to enhance the functionality features offered by the new Instron 6800 series, this system offers a simpler, safer, and more intuitive user experience, while the capacity has been expanded to 100 KN.
The Structure tester market in the Asia Pacific excluding Japan is growing at a significant year-on-year growth rate due to the increasing construction activities in developing countries such as China and India. The Asia-Pacific testing market for building & construction is expected to gain market growth in the forecast period of 2025 to 2035, summarizes Future Market Insights report. The structure tester market is expected to grow at a CAGR of 7.3% across the Asia Pacific.
The market growth is attributed to the growing demand for structural safety in the building & construction industry. Prominent builders and contractors in the region adopt the structure testers as it helps to ensure strength bearing capacity of construction projects. Constant variation in the prices of testing methods can be restrained to the market and lack of testing facilities and skilled resources can be the challenge in the market.
In Aug 2020, ZwickRoell, a prominent leader in the testing systems market established a new facility in Singapore that combines a state-of-the-art Testing Laboratory, in the presence of specialists from key industries such as Academia, Metal, Plastics, Test Services, and Aerospace.
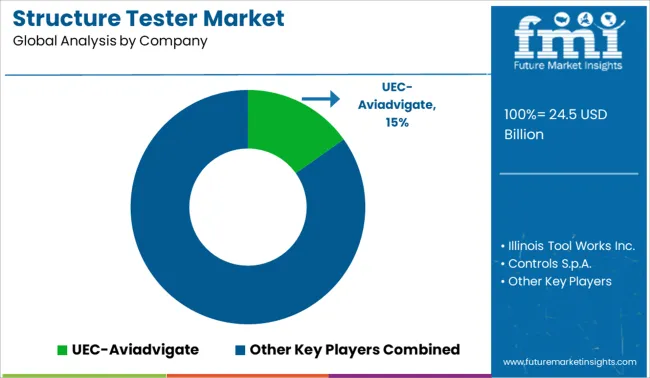
Some of the key players in the Structure tester market are UEC-Aviadvigate, Illinois Tool Works Inc., Controls S.p.A., OLSON INSTRUMENTS Inc., and Humboldt Mfg. Co., Aimil Ltd., Applus, and others. Recent key developments among players include:
| Report Attribute | Details |
|---|---|
| Growth Rate | CAGR of 8% from 2025 to 2035 |
| Market Value in 2025 | USD 24.5 billion |
| Market Value in 2035 | USD 52.9 billion |
| Base Year for Estimation | 2024 |
| Historical Data | 2020 to 2024 |
| Forecast Period | 2025 to 2035 |
| Quantitative Units | Revenue in USD Billion, Volume in Kilotons, and CAGR from 2025 to 2035 |
| Report Coverage | Revenue Forecast, Volume Forecast, Company Ranking, Competitive Landscape, Growth Factors, Trends, and Pricing Analysis |
| Segments Covered | Industry, Component, Test, Region |
| Regions Covered | North America; Latin America; Europe; Asia Pacific; Middle East and Africa |
| Key Countries Profiled | USA, Canada, Brazil, Mexico, Germany, United Kingdom, France, Spain, Italy, China, Japan, South Korea, Malaysia, Singapore, Australia, New Zealand, GCC Countries, South Africa, Israel |
| Key Companies Profiled | UEC-Aviadvigate; Illinois Tool Works Inc.; Controls S.p.A; Olson Instruments Inc.; Humboldt Mfg. Co.; Aimil Ltd.; Applus |
| Customization | Available Upon Request |
The global structure tester market is estimated to be valued at USD 24.5 billion in 2025.
The market size for the structure tester market is projected to reach USD 52.9 billion by 2035.
The structure tester market is expected to grow at a 8.0% CAGR between 2025 and 2035.
The key product types in structure tester market are energy, aerospace, automotive, civil engineering and construction and others.
In terms of component, system segment to command 64.3% share in the structure tester market in 2025.


Our Research Products

The "Full Research Suite" delivers actionable market intel, deep dives on markets or technologies, so clients act faster, cut risk, and unlock growth.

The Leaderboard benchmarks and ranks top vendors, classifying them as Established Leaders, Leading Challengers, or Disruptors & Challengers.

Locates where complements amplify value and substitutes erode it, forecasting net impact by horizon

We deliver granular, decision-grade intel: market sizing, 5-year forecasts, pricing, adoption, usage, revenue, and operational KPIs—plus competitor tracking, regulation, and value chains—across 60 countries broadly.

Spot the shifts before they hit your P&L. We track inflection points, adoption curves, pricing moves, and ecosystem plays to show where demand is heading, why it is changing, and what to do next across high-growth markets and disruptive tech

Real-time reads of user behavior. We track shifting priorities, perceptions of today’s and next-gen services, and provider experience, then pace how fast tech moves from trial to adoption, blending buyer, consumer, and channel inputs with social signals (#WhySwitch, #UX).

Partner with our analyst team to build a custom report designed around your business priorities. From analysing market trends to assessing competitors or crafting bespoke datasets, we tailor insights to your needs.
Supplier Intelligence
Discovery & Profiling
Capacity & Footprint
Performance & Risk
Compliance & Governance
Commercial Readiness
Who Supplies Whom
Scorecards & Shortlists
Playbooks & Docs
Category Intelligence
Definition & Scope
Demand & Use Cases
Cost Drivers
Market Structure
Supply Chain Map
Trade & Policy
Operating Norms
Deliverables
Buyer Intelligence
Account Basics
Spend & Scope
Procurement Model
Vendor Requirements
Terms & Policies
Entry Strategy
Pain Points & Triggers
Outputs
Pricing Analysis
Benchmarks
Trends
Should-Cost
Indexation
Landed Cost
Commercial Terms
Deliverables
Brand Analysis
Positioning & Value Prop
Share & Presence
Customer Evidence
Go-to-Market
Digital & Reputation
Compliance & Trust
KPIs & Gaps
Outputs
Full Research Suite comprises of:
Market outlook & trends analysis
Interviews & case studies
Strategic recommendations
Vendor profiles & capabilities analysis
5-year forecasts
8 regions and 60+ country-level data splits
Market segment data splits
12 months of continuous data updates
DELIVERED AS:
PDF EXCEL ONLINE
Structured Cabling Market Size and Share Forecast Outlook 2025 to 2035
Structured Data Management Software Market Size and Share Forecast Outlook 2025 to 2035
Structure Directing Agents Market Growth – Trends & Forecast 2025 to 2035
Evaluating Structured Product Label Management Market Share
Structured Product Label Management Market Outlook 2025-2035
UK Structured Product Label Management Market Insights – Trends, Growth & Forecast 2025-2035
Aerostructure Market Size and Share Forecast Outlook 2025 to 2035
USA Structured Product Label Management Market Analysis – Size, Trends & Industry Outlook 2025-2035
Infrastructure Projects Legal Services Market Size and Share Forecast Outlook 2025 to 2035
Aero Structure Equipment Market
Japan Structured Product Label Management Market Outlook – Size, Share & Innovations 2025-2035
5G Infrastructure Market Size and Share Forecast Outlook 2025 to 2035
Germany Structured Product Label Management Market Report – Trends, Demand & Forecast 2025-2035
IT Infrastructure Management Tools Market
Cloud Infrastructure Entitlement Management Market Report – Trends & Forecast 2024-2034
Cloud Infrastructure-As-A-Service Market
Virtual Infrastructure Manager Market Size and Share Forecast Outlook 2025 to 2035
Hosting Infrastructure Services Market Analysis - Size Share and Forecast Outlook 2025 to 2035
Managed Infrastructure Services Market Analysis by Solution, Application, and Region Through 2035
Carrier Infrastructure in Telecom Applications Market - Forecast 2025 to 2035

Thank you!
You will receive an email from our Business Development Manager. Please be sure to check your SPAM/JUNK folder too.
Chat With
MaRIA