Suction Irrigation Devices Market Size and Share Forecast Outlook 2025 to 2035

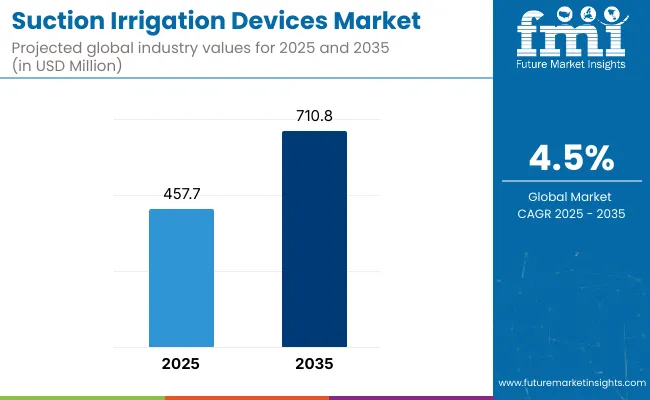
The suction irrigation devices market is expected to record a valuation of USD 457.7 million in 2025 and USD 710.8 million in 2035, with reflecting a growth of USD 253.1 million across the ten-year span. The overall expansion represents a CAGR of 4.5% and a 1.55X increase in market value.
Quick Stats for Suction Irrigation Devices Market

  • Suction Irrigation Devices Market Value (2025): USD 457.7 million
  • Suction Irrigation Devices Market Forecast Value (2035): USD 710.8 million
  • Suction Irrigation Devices Market Forecast CAGR (2025 to 2035): 4.5%
  • Leading Segment in 2025 (Frame Design): Open-Cell (43.5%)
  • Key Growth Regions: North America, East Asia, and Europe
  • Top Key Players: Stryker, BD (Becton, Dickinson), CONMED Corporation, Medtronic, Olympus Corporation, Karl Storz, Richard Wolf GmbH, Smith & Nephew, B. Braun Melsungen AG, Zimmer Biomet, Seemann Technologies, Cook Medical, Locamed GmbH and Others

Suction Irrigation Devices Market

Metric Value
Suction Irrigation Devices Market in (2025E) USD 457.7 million
Suction Irrigation Devices Market in (2035F) USD 710.8 million
Forecast CAGR (2025 to 2035) 4.5%

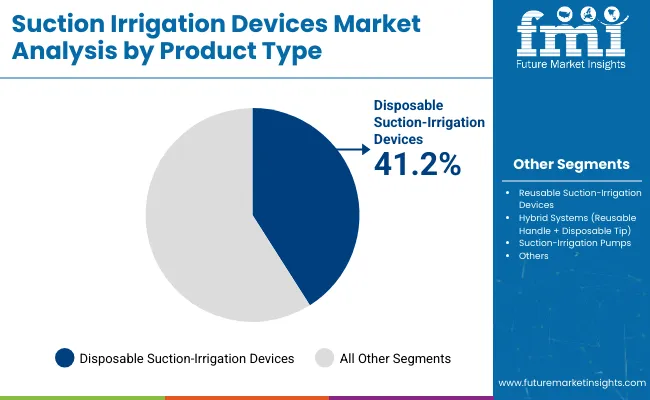
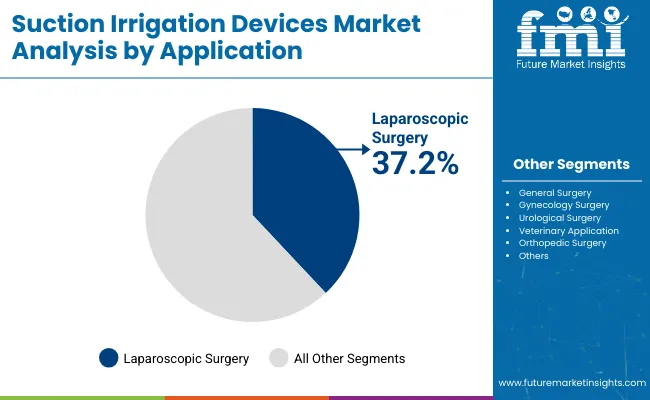
During the first five-year period from 2025 to 2030, the suction irrigation devices market grows from USD 457.7 million to USD 570.4 million, adding USD 112.7 million which accounts for 44.5% of the total decade growth. This period reflects steady adoption in laparoscopic surgery holds around 37.2% share in overall application segment, also general surgery, and gynecology surgery, driven by the rising global preference for minimally invasive procedures and enhanced intraoperative fluid management. Disposable suction-irrigation devices lead the market by product segment during this phase with a 41.2% share, supported by hospital procurement policies prioritizing sterility and reduced turnaround times.

From 2030 to 2035, the market accelerates, contributing USD 140.4 million which is 55.5% of total growth as it climbs from USD 570.4 million to 710.8 million. Expansion is driven by the broader adoption in urological, orthopedic, and veterinary surgeries, as irrigation-flow precision, reduced tissue trauma, and workflow efficiency become key procurement criteria. Specialty clinics and ambulatory surgical centers increase their combined share which around 69.6% beyond one-third of the market, while technology-enabled devices create recurring revenue streams through consumables and system integration with advanced surgical platforms.

Between 2020 and 2024, the suction irrigation devices market grew from USD 378.9 million to USD 443.5 million, adding USD 64.6 million. Growth was steady, supported by consistent procedural volumes in laparoscopic and general surgeries. Hospitals favored manual control disposable systems for their simplicity and predictable sterilization processes, while adoption of smart sensor-controlled devices was slowed by 2020 to 2021 supply chain disruptions and postponed elective surgeries.

The market is moderately concentrated, with Stryker, Olympus Corporation, and CONMED Corporation holding about 52.2% of global revenue, leveraging broad product portfolios, strong distribution in mature and emerging markets, and multi-tier offerings spanning disposables, hybrids, and pumps. In 2025, the market is projected at USD 457.7 million, up 3.2% from 2024. A shift from 1.5% share from manual devices to hybrid systems and sensor-enabled pumps is anticipated, fueled by hospital investments in infection control and efficiency, alongside gradual growth in specialty clinic and ASC adoption for outpatient MIS procedures.

Why is Suction Irrigation Devices Market Growing?

The suction irrigation devices market is growing due to the rising global volume of minimally invasive surgeries (MIS), where effective fluid management is critical for visibility and safety. High adoption in laparoscopic procedures including bariatric, gastrointestinal, and gynecologic surgeriesis driving consistent demand, especially in hospitals and high-acuity surgical centers. The shift toward infection control compliance has accelerated the use of disposable and hybrid systems, reducing cross-contamination risks and improving operating room turnover times.

Surgeons are increasingly preferring ergonomically designed devices with precise flow regulation to minimize tissue trauma and enhance procedural efficiency. Integration of smart sensor technologies and compatibility with robotic-assisted surgery platforms is also influencing purchasing decisions in advanced markets. Additionally, expanding healthcare infrastructure in emerging economies and the introduction of cost-optimized devices by both global and regional manufacturers are broadening access, creating a dual growth push from technological innovation and geographic market penetration.

Segmental Analysis

The market is segmented by product, application, technology, and end user. Product categories include disposable suction-irrigation devices, reusable suction-irrigation devices, hybrid systems (reusable handle + disposable tip), and suction-irrigation pumps, reflecting varied preferences for sterility, reusability, and operational efficiency.

Applications span laparoscopic surgery, general surgery, gynecology surgery, urological surgery, veterinary application, orthopedic surgery, and other specialized procedures, addressing diverse clinical needs. Technology segmentation covers manual control devices, foot/hand-switch activated devices, and smart sensor-controlled devices, catering to different levels of precision, automation, and surgeon control. End user segments comprise hospitals, specialty clinics, ambulatory surgical centers, and other healthcare facilities, each with distinct procurement priorities, procedural volumes, and infrastructure capabilities influencing device adoption.
Insights on Segments Product Segment with Dominance of Disposable Suction-Irrigation Devices

Suction Irrigation Devices Market By Product Type

By Product Market Value Share, 2025
Disposable Suction-Irrigation Devices 41.2%
Reusable Suction-Irrigation Devices 18.5%
Hybrid Systems (Reusable Handle + Disposable Tip) 26.4%
Suction-Irrigation Pumps 13.8%

In 2025, disposable suction-irrigation devices lead the market with a 41.2% share, driven by their critical role in infection prevention and operational efficiency. Hospitals and ambulatory surgical centers increasingly prefer single-use systems to eliminate cross-contamination risks, comply with stringent sterilization guidelines, and avoid downtime associated with reprocessing reusable devices.

Procurement decisions are further influenced by predictable per-procedure costs and the ability to maintain consistent performance without degradation over multiple uses. High adoption is seen in high-volume laparoscopic and general surgeries, where rapid turnover is essential. Leading manufacturers such as Stryker and Olympus have expanded their disposable portfolios with ergonomically designed, flow-controlled hand pieces, meeting surgeon demand for both precision and ease of use solidifying disposables as the preferred choice in modern surgical settings.
Insights on Segments Application Segment with Dominance of Laparoscopic Surgery

Suction Irrigation Devices Market By Application

By Application Market Value Share, 2025
Laparoscopic Surgery 37.2%
General Surgery 17.6%
Gynecology Surgery 11.3%
Urological Surgery 7.5%
Veterinary Application 8.6%
Orthopedic Surgery 6.1%
Others 11.8%

In 2025, laparoscopic surgery accounts for the largest share at 37.2%, reflecting the procedure’s central role in driving suction-irrigation device demand. Laparoscopic interventions require continuous suction to clear blood and debris, paired with controlled irrigation to maintain visibility in minimally invasive fields. The global shift toward minimally invasive techniques driven by faster recovery times, reduced postoperative complications, and shorter hospital stays has amplified device usage.

Hospitals prioritize advanced suction-irrigation systems with precise flow regulation to minimize tissue trauma and enhance surgical accuracy. High adoption in bariatrics, gastrointestinal procedures, and gynecology within the laparoscopic category further reinforces dominance. Manufacturers such as CONMED and Olympus are targeting this segment with procedure-specific hand pieces and hybrid solutions, cementing its position as the primary demand driver in the market.
Insights on End User Segment with Hospitals as the Primary Demand Center

Suction Irrigation Devices Market By End User

By End User Market Value Share, 2025
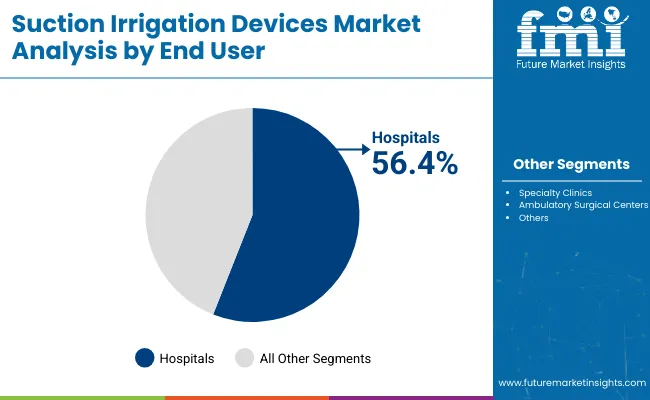
Hospitals 56.4%
Specialty Clinics 13.2%
Ambulatory Surgical Centers 20.9%
Others 9.5%

In 2025, hospitals dominate the suction irrigation devices market with a 56.4% share, driven by their high surgical volumes, advanced infrastructure, and capacity to perform complex, multidisciplinary procedures. Hospitals handle a majority of laparoscopic, general, and specialty surgeries, where suction-irrigation devices are essential for maintaining a clear operative field and ensuring patient safety.

Centralized procurement systems allow hospitals to invest in premium disposable and hybrid systems, often bundled with laparoscopic towers and visualization equipment from leading manufacturers like Stryker and Karl Storz. Additionally, hospitals have the sterilization capacity and trained personnel to manage reusable systems efficiently. The push toward infection control compliance, coupled with growing adoption of minimally invasive techniques in inpatient surgical units, further strengthens hospitals’ position as the largest and most consistent demand center.

What are the Key Drivers, Restraints, and Trend Shaping the Suction Irrigation Devices Market Growth?

The suction irrigation devices market sees rising adoption of laparoscopic and minimally invasive surgeries, where efficient fluid evacuation and targeted irrigation are essential for safety and visibility. Restraints include the high sterilization, reprocessing, and maintenance demands of reusable and hybrid models, which increase operational costs and limit adoption in resource-constrained facilities. A key trend is the shift toward smart, sensor-enabled, and ergonomically advanced devices that improve surgical control, reduce fatigue, and integrate with other operating room systems. Such innovations are influencing procurement decisions, especially in high-acuity centers seeking workflow efficiency and precision.

Growing Adoption of Laparoscopic and Minimally Invasive Surgeries Requiring Efficient Fluid Management

The increasing shift toward minimally invasive surgeries (MIS) is a primary growth driver for suction irrigation devices, as these instruments play a critical role in both fluid evacuation and targeted irrigation during laparoscopic procedures. According to product catalogs from leading manufacturers like Stryker, Olympus Corporation, and CONMED Corporation, modern suction irrigation devices integrate ergonomic hand pieces, interchangeable tips, and variable flow control senabling precise visibility and thermal safety in delicate anatomical zones.

MIS adoption is rising in specialties such as general surgery, gynecology, urology, and bariatrics due to reduced patient trauma, faster recovery, and lower infection risk. Surgeons increasingly prefer devices that combine high suction flow rates with adjustable irrigation pressure to manage intraoperative bleeding and maintain a clear surgical field without tissue damage. Furthermore, hospital procurement teams are prioritizing reusable or hybrid systems with disposable tips to balance cost-efficiency with sterility requirements.

The driver’s strength lies in the fact that suction irrigation devices are not optional in these procedures they are integral to intraoperative safety and efficiency, making demand directly proportional to the global laparoscopic surgery volume. This is reinforced by procedural growth data from hospital supply chain records and procurement contracts in major surgical centers.

High Sterilization and Maintenance Burden in Multi-Use Surgical Environments

While reusable and hybrid suction irrigation devices offer cost savings over time, their adoption is restrained by the operational complexities of sterilization, reprocessing, and maintenance in high-volume surgical departments. Device manuals from companies like Karl Storz and Richard Wolf GmbH specify detailed cleaning protocols involving disassembly, ultrasonic washing, and autoclaving to ensure lumen sterility. These processes are time-intensive and require specialized staff training to avoid cross-contamination risks.

In hospitals where surgical throughput is high, delays in reprocessing can cause inventory shortages, forcing facilities to maintain larger device fleets or revert to disposable systems. This increases total cost of ownership (TCO) and puts pressure on operating budgets. Additionally, improper reprocessing can cause lumen blockage, O-ring deterioration, and compromised suction flow impacting surgical safety and leading to unplanned device replacements.

In emerging markets, the challenge is amplified due to limited access to compliant sterilization infrastructure and skilled biomedical technicians. This barrier is not simply a cost issue it directly affects the availability and readiness of suction irrigation systems during critical surgeries, making it a major constraint for market penetration, particularly for reusable and hybrid models in cost-sensitive geographies.

Shift Toward Smart, Sensor-Enabled and Ergonomically Advanced Devices

A notable trend in the suction irrigation devices market is the integration of smart sensor technologies and ergonomic enhancements to improve surgical control, reduce fatigue, and enable real-time performance monitoring. Recent product announcements by Medtronic, Olympus, and CONMED highlight devices with programmable flow rate presets, tactile feedback triggers, and digital flow sensors that alert surgeons if suction or irrigation parameters deviate from set thresholds.

This evolution addresses two critical pain points: maintaining consistent visibility during prolonged laparoscopic procedures and reducing manual adjustments that distract from surgical precision. Additionally, advancements in hand piece design lighter materials, balanced weight distribution, and low-activation-force triggers are being developed to mitigate surgeon hand fatigue, particularly during multi-hour operations.

Hospitals are increasingly evaluating procurement not just on per-unit cost but on total surgical workflow efficiency. Devices that can integrate with electrosurgical systems or laparoscopic camera platforms for centralized control are gaining traction in procurement decisions. Early adoption patterns are visible in high-acuity centers in North America and Europe, with manufacturers positioning these innovations as premium-tier offerings. This trend represents a functional leap from purely mechanical devices toward integrated, data-supported surgical tools.
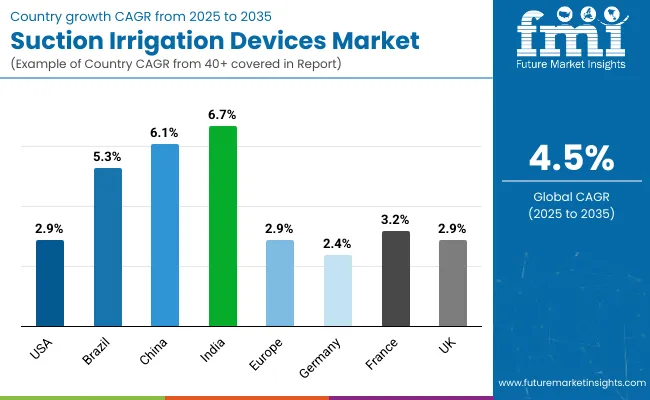
Analysis of Suction Irrigation Devices Key Countries

Country Wise Analysis Of Suction Irrigation Devices Market

Country CAGR (%)
United States 2.9%
Brazil 5.3%
China 6.1%
India 6.7%
Europe 2.9%
Germany 2.4%
France 3.2%
United Kingdom 2.9%

Asia-Pacific is emerging as the fastest-growing region in the suction irrigation devices market, propelled by rapid adoption of minimally invasive surgeries and increased investment in surgical infrastructure. India is expected to grow at a CAGR of 6.7%, driven by expanding laparoscopic procedure volumes in tier-2 and tier-3 cities, along with rising hospital capacity in private healthcare chains. China will grow at a CAGR of 6.1%, supported by aggressive procurement of surgical equipment in public hospitals and increasing surgeon training in advanced MIS techniques. The region’s growth is further strengthened by government-led healthcare modernization programs and local manufacturing initiatives that reduce device costs.

Europe is set for steady growth, with Germany at a CAGR of 2.4%, France at 3.2%, and the United Kingdom at 2.9%. Germany’s growth is supported by its high surgical throughput and hospital modernization initiatives. France benefits from strong public healthcare investment in MIS infrastructure, while the United Kingdom sees growth from increasing adoption of hybrid systems in NHS facilities.

North America remains a mature but expanding market, with the United States expected to grow at a CAGR of 2.9%. Growth is driven by high surgical volumes, early adoption of sensor-enabled suction irrigation devices, and strong presence of global market leaders. Favorable reimbursement policies and hospital preference for integrated surgical platforms further support market expansion.

Sales Outlook of Suction Irrigation Devices in United States

Year USA Suction Irrigation Devices Market (USD Million)
2025 142.6
2026 146.6
2027 150.7
2028 155.0
2029 159.5
2030 164.1
2031 168.8
2032 173.7
2033 178.8
2034 184.1
2035 189.7

The United States suction irrigation devices market is projected to grow at a CAGR of 2.9% from 2025 to 2035, reaching steady expansion despite being a mature market. Sales are supported by the country’s high volume of minimally invasive surgeries, strong hospital budgets for capital and consumable surgical products, and early adoption of advanced surgical technologies.

Hospitals and Ambulatory Surgical Centers (ASCs) increasingly integrate suction irrigation systems into standardized laparoscopic sets, ensuring consistent availability across specialties. The Centers for Medicare & Medicaid Services (CMS) reimbursement for certain MIS procedures incentivizes facilities to maintain up-to-date, high-performance equipment.

Additionally, the growing use of robotic-assisted platforms has created demand for compatible suction irrigation instruments with sensor-based flow regulation. The United States market also benefits from well-established domestic manufacturing and distribution networks, reducing lead times and ensuring compliance with FDA-mandated sterility requirements. Rising bariatric surgery rates, coupled with aging demographics requiring gastrointestinal and urological interventions, further sustain device demand.

  • Laparoscopic surgeons use high-flow suction irrigation to maintain visibility in minimally invasive procedures.
  • Gynecology departments deploy hybrid systems to balance sterility with cost efficiency in hysterectomy cases.
  • Urology teams adopt sensor-enabled devices for precise irrigation during delicate endoscopic stone removal.

Growth and Expansion Outlook of Suction Irrigation Devices in Germany

The German suction irrigation devices market is projected to grow at a CAGR of 2.4% from 2025 to 2035, supported by the country’s high surgical throughput, advanced hospital infrastructure, and strong commitment to adopting precision-driven medical devices. Germany’s healthcare system emphasizes quality and safety, which drives procurement of devices with enhanced ergonomics, consistent flow control, and superior sterility assurance.

The rise in complex oncologic and gastrointestinal laparoscopic surgeries in university hospitals is fueling demand for premium hybrid and reusable systems that can withstand repeated sterilization cycles without performance loss. In addition, strict Robert Koch Institute (RKI) guidelines for infection prevention have encouraged facilities to invest in advanced reprocessing-compatible devices.

Procurement contracts in Germany often favor suppliers with proven local service networks, ensuring quick maintenance and device availability. Growth is further reinforced by a high proportion of surgeries performed in specialized surgical centers, where demand for customized device configurations is higher. The focus on total cost of ownership, rather than upfront price, has also encouraged adoption of higher-end systems that deliver long-term reliability and consistent performance in high-volume environments.

  • University hospitals employ hybrid suction irrigation systems for precision in laparoscopic oncology procedures.
  • Bariatric surgery centers use high-capacity irrigation to control bleeding during complex gastric bypasses.
  • Colorectal surgical units rely on reusable systems designed for repeated sterilization in high-volume settings.

Growth and Expansion Outlook of Suction Irrigation Devices in United Kingdom

The United Kingdom suction irrigation devices market is projected to grow at a CAGR of 2.6% from 2025 to 2035, driven by the NHS’s modernization of surgical suites and a push toward expanding minimally invasive surgery capacity across regional hospitals. A significant share of procurement is influenced by centralized NHS tenders, where suppliers with proven cost efficiency, compliance with NICE surgical equipment guidelines, and strong after-sales support gain an advantage.

Growth is further supported by the United Kingdom’s rising adoption of day-case laparoscopic procedures, particularly in gallbladder, hernia, and gynecologic surgeries, where high-flow disposable systems improve turnover efficiency. Academic medical centers are also incorporating hybrid systems into robotic-assisted laparoscopic programs, increasing demand for sensor-enabled irrigation control. Additionally, the emphasis on reducing hospital-acquired infections (HAIs) has increased disposable usage in high-risk surgical environments.

United Kingdom device adoption trends also benefit from a strong focus on ergonomic design, driven by surgeon feedback collected through NHS procurement evaluations, encouraging the uptake of devices with reduced trigger force and improved handling during prolonged cases.

  • NHS laparoscopic hernia repair programs utilize disposable systems for rapid theatre turnaround.
  • Gynecologic oncology centers adopt hybrid devices for robotic-assisted hysterectomy procedures.
  • Regional hospitals deploy high-flow pumps for improved field clearance in complex gallbladder surgeries.

Europe Outlook of Suction Irrigation Devices by Country

Europe Countries Share 2025 % Share
Germany 27.9%
United Kingdom 16.8%
France 15.0%
Italy 11.3%
Spain 8.5%
BENELUX 6.9%
Nordic Countries 5.9%
Rest of Western Europe 7.7%
Europe Countries Share 2035 % Share
Germany 27.3%
United Kingdom 16.5%
France 14.7%
Italy 11.1%
Spain 8.3%
BENELUX 6.8%
Nordic Countries 5.8%
Rest of Western Europe 9.6%

Growth and Expansion Outlook of Suction Irrigation Devices in India

India’s suction irrigation devices market is projected to grow at a CAGR of 6.7%, underpinned by three India‑specific forces includes rising procedure volumes in public and private networks as PM‑JAY continues to scale inpatient admissions; its live dashboard reports 650+ lakh (6.5M) authorized hospital admissions cumulatively, signaling robust surgical demand funnels.

A quality push NABH accreditation and standards updates are tightening infection‑control expectations, nudging hospitals toward disposable and hybrid systems with predictable sterility and faster OR turnovers. supply‑side tailwinds “Make in India” policies and the PLI scheme for medical devices are encouraging local assembly of surgical hardware/consumables, improving availability and lead times for laparoscopic accessories, including suction/irrigation sets. Regulatory clarity also helps procurement: CDSCO classifies irrigation/aspiration catheters and related accessories under the Medical Device Rules, streamlining registrations for domestic and imported SKUs that pair with laparoscopic towers.

  • Tier-2 and tier-3 hospitals use disposable suction-irrigation sets to meet NABH infection control standards.
  • PM-JAY-empaneled surgical centers standardize hybrid devices to improve OR efficiency in high-volume laparoscopic lists.
  • Local OEMs bundle pumps and consumables to supply cost-effective solutions under “Make in India” initiatives.

Growth and Expansion Outlook of Suction Irrigation Devices in China

The China suction irrigation devices market is projected to grow at a CAGR of 5.6%,fueled by the rapid expansion of surgical capacity under the Healthy China 2030 framework. Large tertiary hospitals in tier-1 cities are upgrading to advanced hybrid and sensor-enabled devices to support complex laparoscopic oncology and gastrointestinal surgeries.

Provincial government investments in minimally invasive surgery (MIS) training programs are increasing surgeon proficiency, expanding device usage beyond top-tier hospitals into regional medical centers. Domestic manufacturers, supported by localization and procurement preferences, are producing cost-competitive systems that meet National Medical Products Administration (NMPA) requirements, reducing reliance on imports.

Additionally, high patient demand for shorter hospital stays is encouraging hospitals to adopt efficient disposable systems that reduce OR turnover times. The combination of strong public hospital funding, rapid MIS adoption in lower-tier cities, and the rise of domestic innovation positions China as one of the most dynamic growth markets for suction irrigation devices in Asia-Pacific.

  • Provincial cancer centers adopt hybrid suction irrigation systems for precision in laparoscopic tumor resections.
  • County-level hospitals integrate cost-efficient disposable devices to expand MIS access in rural areas.
  • Domestic OEMs develop NMPA-approved sensor-controlled devices tailored for high-volume urban surgical units.
Japan Suction Irrigation Devices Market By Product, Market Share (%) Analysis, 2025 2025 Share (%)
Japan Disposable Suction-Irrigation Devices 42.1%
Japan Reusable Suction-Irrigation Devices 18.9%
Japan Hybrid Systems (Reusable Handle + Disposable Tip) 27.0%
Japan Suction-Irrigation Pumps 12.1%

Growth Outlook of Suction Irrigation Devices in Japan

Japan will account for 3.1% of the global suction irrigation devices market in 2025 and is projected to grow at a steady CAGR of 2.4% through 2035. The market’s growth is underpinned by Japan’s precision-driven surgical culture and strong integration of advanced digital technologies into operating rooms. Software-enabled capabilities such as real-time irrigation flow analytics, pressure regulation, and integration with laparoscopic imaging systems lead slightly over hardware (50.2% vs. 49.8%), reflecting the country’s focus on data-supported surgical decision-making.

Adoption is also driven by digital twin simulations used in preoperative planning, allowing surgeons to model fluid management strategies before procedures. AI-based intraoperative monitoring tools are increasingly paired with suction irrigation devices to automatically adjust parameters during surgery, enhancing precision and reducing manual adjustments. Government investment in smart OR infrastructure, coupled with the country’s rapidly aging population requiring gastrointestinal, urological, and oncologic interventions, sustains demand. Japanese manufacturers are further contributing by developing compact, ergonomically refined hybrid devices that optimize space efficiency in ORs without compromising functionality.

  • Japan hold around 3.1% in the global market.
  • Disposable Suction-Irrigation Devices holds significant share 42.1% among product type in Japan.
  • The growth in Japan mainly driven by digital twin simulations used in preoperative planning, allowing surgeons to model fluid management strategies before procedures

Growth Outlook of Suction Irrigation Devices in South Korea

South Korea Suction Irrigation Devices Market By Technology Used, Market Share (%) Analysis, 2025 2025 Share (%)
South Korea Manual Control Devices 51.1%
South Korea Foot/Hand-Switch Activated 32.0%
South Korea Smart Sensor-Controlled Devices 16.9%

South Korea’s suction irrigation devices market is projected to grow at a CAGR of 5.9% from 2025 to 2035, driven by its rapid adoption of advanced minimally invasive surgery (MIS) techniques and strong government backing for surgical technology innovation. The country’s well-developed hospital infrastructure, particularly in tertiary care centers, is enabling widespread use of hybrid and smart sensor-controlled systems that offer precise irrigation flow and improved visibility in complex procedures. South Korea’s Ministry of Health and Welfare (MOHW) initiatives to expand robotic-assisted surgery programs in public and private hospitals have further increased demand for compatible suction irrigation devices, especially in urology, gynecology, and gastrointestinal oncology.

Medical device procurement in South Korea is also influenced by the country’s high digital health readiness, with hospitals integrating suction irrigation systems into networked OR platforms for central monitoring and maintenance. Domestic manufacturers are gaining ground by producing competitively priced devices tailored for the local market, while international players are focusing on premium models with ergonomic enhancements and automation features. Rising demand for shorter hospital stays and faster recovery rates has made high-performance disposable systems a preferred choice for high-volume surgical centers.
  • The suction irrigation devices industry in South Korea is projected to grow at a CAGR of 5.9% from 2025 to 2035.
  • The manual control devices dominate the technology used segment in South Korea.
  • The South Korea holds approximately 1.7% in global market.

Competitive Landscape

Suction Irrigation Devices Market By Company

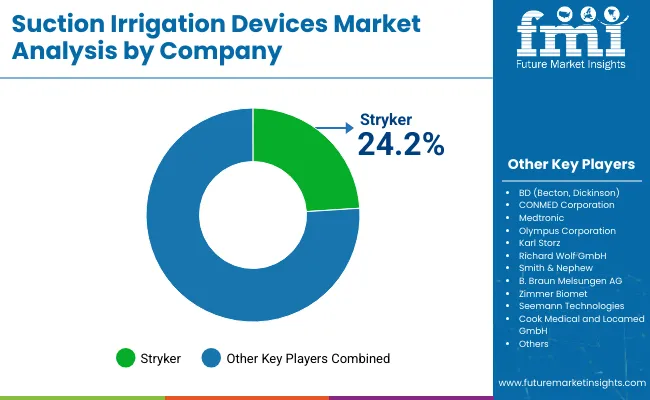
Key Players Global Value Share (%) 2025
Stryker 24.2%
Other Players 75.9%

The suction irrigation devices market is moderately consolidated, with Stryker holding the largest share at 24.2% in 2024, supported by its extensive laparoscopic portfolio, ergonomic disposable systems, and strong hospital contracting channels. Global surgical technology leaders such as Olympus Corporation, Karl Storz, and CONMED Corporation leverage deep expertise in MIS instrumentation, integrating suction irrigation hand pieces with their laparoscopic towers and imaging platforms to offer bundled procurement solutions. Medtronic and BD (Becton, Dickinson) strengthen their positions through cross-portfolio synergies, coupling suction irrigation systems with complementary surgical and infection prevention products.

Mid-sized players like Richard Wolf GmbH and B. Braun Melsungen AG focus on reusable and hybrid systems, emphasizing durability, reprocessing compatibility, and specialty-specific designs for gynecology and urology. Niche innovators such as Locamed GmbH, Seemann Technologies, and Cook Medical compete through customized devices tailored for regional hospital preferences and cost-sensitive markets.

Across the competitive landscape, differentiation is shifting toward workflow efficiency, infection control compliance, and integration with robotic-assisted and sensor-enabled surgical platforms, as well as service-driven models that enhance long-term customer retention.

Key Developments

  • In July 2025, Dyne Medical Group secured distribution rights for Robotic Suction-Irrigation System from United States-based VTI.
  • In August 2024, Irrimax Corporation completed launch of its antimicrobial wound lavage product, IRRISEPT®, to enable the use of the proprietary Irrisept solution with powered irrigation devices.

Scope of Report

Item Value
Quantitative Units (2035) USD 710.8 million
Product Disposable Suction-Irrigation Devices, Reusable Suction-Irrigation Devices, Hybrid Systems (Reusable Handle + Disposable Tip) and Suction-Irrigation Pumps
Application Laparoscopic Surgery, General Surgery, Gynecology Surgery, Urological Surgery, Veterinary Application, Orthopedic Surgery and Others
Technology User Manual Control Devices, Foot/Hand-Switch Activated and Smart Sensor-Controlled Devices
End User Hospitals, Specialty Clinics, Ambulatory Surgical Centers and Others
Regions Covered North America, Latin America, Western & Eastern Europe, East Asia, South Asia & Pacific, Middle East & Africa
Countries Covered United States, Brazil, China, India, Germany, France, United Kingdom etc.
Key Companies Profiled Stryker, BD (Becton, Dickinson), CONMED Corporation, Medtronic, Olympus Corporation, Karl Storz, Richard Wolf GmbH, Smith & Nephew, B. Braun Melsungen AG, Zimmer Biomet, Seemann Technologies, Cook Medical and Locamed GmbH
Additional Attributes Dollar sales in the suction irrigation devices market are led by laparoscopic surgery and general surgery applications, with hospitals in North America and Europe generating the highest revenue, while Asia-Pacific shows the fastest percentage growth due to rising MIS adoption. Uptake trends indicate a shift from purely manual devices toward hybrid systems and smart sensor-controlled technologies, reflecting surgeon demand for precision fluid management and infection control compliance.

Key Segmentation

By Product:

  • Disposable Suction-Irrigation Devices
  • Reusable Suction-Irrigation Devices
  • Hybrid Systems (Reusable Handle + Disposable Tip)
  • Suction-Irrigation Pumps

By Application:

  • Laparoscopic Surgery
  • General Surgery
  • Gynecology Surgery
  • Urological Surgery
  • Veterinary Application
  • Orthopedic Surgery
  • Others

By Technology Used:

  • Manual Control Devices
  • Foot/Hand-Switch Activated
  • Smart Sensor-Controlled Devices

By End User:

  • Hospitals
  • Specialty Clinics
  • Ambulatory Surgical Centers
  • Others

By Region:

  • North America
  • Latin America
  • East Asia
  • South Asia
  • Western Europe
  • Eastern Europe
  • Middle East & Africa

Table of Content

  1. Executive Summary
    • Global Market Outlook
    • Demand-side Trends
    • Supply-side Trends
    • Technology Roadmap Analysis
    • Analysis and Recommendations
  2. Market Overview
    • Market Coverage / Taxonomy
    • Market Definition / Scope / Limitations
  3. Market Background
    • Market Dynamics
      • Drivers
      • Restraints
      • Opportunity
      • Trends
    • Scenario Forecast
      • Demand in Optimistic Scenario
      • Demand in Likely Scenario
      • Demand in Conservative Scenario
    • Opportunity Map Analysis
    • Product Life Cycle Analysis
    • Supply Chain Analysis
      • Supply Side Participants and their Roles
        • Producers
        • Mid-Level Participants (Traders/ Agents/ Brokers)
        • Wholesalers and Distributors
      • Value Added and Value Created at Node in the Supply Chain
      • List of Raw Material Suppliers
      • List of Existing and Potential Buyer’s
    • Investment Feasibility Matrix
    • Value Chain Analysis
      • Profit Margin Analysis
      • Wholesalers and Distributors
      • Retailers
    • PESTLE and Porter’s Analysis
    • Regulatory Landscape
      • By Key Regions
      • By Key Countries
    • Regional Parent Market Outlook
    • Production and Consumption Statistics
    • Import and Export Statistics
    • Number of Laparoscopic Surgeries Performed by Key Countries
  4. Global Market Analysis 2020 to 2024 and Forecast, 2025 to 2035
    • Historical Market Size Value (USD Million) & Volume (Units) Analysis, 2020 to 2024
    • Current and Future Market Size Value (USD Million) & Volume (Units) Projections, 2025 to 2035
      • Y-o-Y Growth Trend Analysis
      • Absolute $ Opportunity Analysis
  5. Global Market Analysis 2020 to 2024 and Forecast 2025 to 2035, By Product
    • Introduction / Key Findings
    • Historical Market Size Value (USD Million) & Volume (Units) Analysis By Product, 2020 to 2024
    • Current and Future Market Size Value (USD Million) & Volume (Units) Analysis and Forecast By Product, 2025 to 2035
      • Disposable Suction-Irrigation Devices
      • Reusable Suction-Irrigation Devices
      • Hybrid Systems (Reusable Handle + Disposable Tip)
      • Suction-Irrigation Pumps
    • Y-o-Y Growth Trend Analysis By Product, 2020 to 2024
    • Absolute $ Opportunity Analysis By Product, 2025 to 2035
  6. Global Market Analysis 2020 to 2024 and Forecast 2025 to 2035, By Application
    • Introduction / Key Findings
    • Historical Market Size Value (USD Million) & Volume (Units) Analysis By Application, 2020 to 2024
    • Current and Future Market Size Value (USD Million) & Volume (Units) Analysis and Forecast By Application, 2025 to 2035
      • Laparoscopic Surgery
      • General Surgery
      • Gynecology Surgery
      • Urological Surgery
      • Veterinary Application
      • Orthopedic Surgery
      • Others
    • Y-o-Y Growth Trend Analysis By Application, 2020 to 2024
    • Absolute $ Opportunity Analysis By Application, 2025 to 2035
  7. Global Market Analysis 2020 to 2024 and Forecast 2025 to 2035, By Technology Used
    • Introduction / Key Findings
    • Historical Market Size Value (USD Million) & Volume (Units) Analysis By Technology Used, 2020 to 2024
    • Current and Future Market Size Value (USD Million) & Volume (Units) Analysis and Forecast By Technology Used, 2025 to 2035
      • Manual Control Devices
      • Foot/Hand-Switch Activated
      • Smart Sensor-Controlled Devices
    • Y-o-Y Growth Trend Analysis By Technology Used, 2020 to 2024
    • Absolute $ Opportunity Analysis By Technology Used, 2025 to 2035
  8. Global Market Analysis 2020 to 2024 and Forecast 2025 to 2035, By End User
    • Introduction / Key Findings
    • Historical Market Size Value (USD Million) & Volume (Units) Analysis By End User, 2020 to 2024
    • Current and Future Market Size Value (USD Million) & Volume (Units) Analysis and Forecast By End User, 2025 to 2035
      • Hospitals
      • Specialty Clinics
      • Ambulatory Surgical Centers
      • Others
    • Y-o-Y Growth Trend Analysis By End User, 2020 to 2024
    • Absolute $ Opportunity Analysis By End User, 2025 to 2035
  9. Global Market Analysis 2020 to 2024 and Forecast 2025 to 2035, By Region
    • Introduction
    • Historical Market Size Value (USD Million) & Volume (Units) Analysis By Region, 2020 to 2024
    • Current Market Size Value (USD Million) & Volume (Units) Analysis and Forecast By Region, 2025 to 2035
      • North America
      • Latin America
      • East Asia
      • South Asia
      • Western Europe
      • Eastern Europe
      • Middle East & Africa
    • Market Attractiveness Analysis By Region
  10. North America Market Analysis 2020 to 2024 and Forecast 2025 to 2035, By Country
    • Historical Market Size Value (USD Million) & Volume (Units) Trend Analysis By Market Taxonomy, 2020 to 2024
    • Market Size Value (USD Million) & Volume (Units) Forecast By Market Taxonomy, 2025 to 2035
      • By Country
        • USA
        • Canada
        • Mexico
      • By Product
      • By Application
      • By Technology Used
      • By End User
    • Market Attractiveness Analysis
      • By Country
      • By Product
      • By Application
      • By Technology Used
      • By End User
    • Key Takeaways
  11. Latin America Market Analysis 2020 to 2024 and Forecast 2025 to 2035, By Country
    • Historical Market Size Value (USD Million) & Volume (Units) Trend Analysis By Market Taxonomy, 2020 to 2024
    • Market Size Value (USD Million) & Volume (Units) Forecast By Market Taxonomy, 2025 to 2035
      • By Country
        • Brazil
        • Argentina
        • Rest of Latin America
      • By Product
      • By Application
      • By Technology Used
      • By End User
    • Market Attractiveness Analysis
      • By Country
      • By Product
      • By Application
      • By Technology Used
      • By End User
    • Key Takeaways
  12. East Asia Market Analysis 2020 to 2024 and Forecast 2025 to 2035, By Country
    • Historical Market Size Value (USD Million) & Volume (Units) Trend Analysis By Market Taxonomy, 2020 to 2024
    • Market Size Value (USD Million) & Volume (Units) Forecast By Market Taxonomy, 2025 to 2035
      • By Country
        • China
        • Japan
        • South Korea
      • By Product
      • By Application
      • By Technology Used
      • By End User
    • Market Attractiveness Analysis
      • By Country
      • By Product
      • By Application
      • By Technology Used
      • By End User
    • Key Takeaways
  13. South Asia Market Analysis 2020 to 2024 and Forecast 2025 to 2035, By Country
    • Historical Market Size Value (USD Million) & Volume (Units) Trend Analysis By Market Taxonomy, 2020 to 2024
    • Market Size Value (USD Million) & Volume (Units) Forecast By Market Taxonomy, 2025 to 2035
      • By Country
        • India
        • ASEAN Countries
        • Australia & New Zealand
        • Rest of South Asia
      • By Product
      • By Application
      • By Technology Used
      • By End User
    • Market Attractiveness Analysis
      • By Country
      • By Product
      • By Application
      • By Technology Used
      • By End User
    • Key Takeaways
  14. Western Europe Market Analysis 2020 to 2024 and Forecast 2025 to 2035, By Country
    • Historical Market Size Value (USD Million) & Volume (Units) Trend Analysis By Market Taxonomy, 2020 to 2024
    • Market Size Value (USD Million) & Volume (Units) Forecast By Market Taxonomy, 2025 to 2035
      • By Country
        • Germany
        • UK
        • France
        • Italy
        • Spain
        • BENELUX
        • Nordic Countries
        • Rest of Western Europe
      • By Product
      • By Application
      • By Technology Used
      • By End User
    • Market Attractiveness Analysis
      • By Country
      • By Product
      • By Application
      • By Technology Used
      • By End User
    • Key Takeaways
  15. Eastern Europe Market Analysis 2020 to 2024 and Forecast 2025 to 2035, By Country
    • Historical Market Size Value (USD Million) & Volume (Units) Trend Analysis By Market Taxonomy, 2020 to 2024
    • Market Size Value (USD Million) & Volume (Units) Forecast By Market Taxonomy, 2025 to 2035
      • By Country
        • Russia
        • Hungary
        • Poland
        • Rest of Eastern Europe
      • By Product
      • By Application
      • By Technology Used
      • By End User
    • Market Attractiveness Analysis
      • By Country
      • By Product
      • By Application
      • By Technology Used
      • By End User
    • Key Takeaways
  16. Middle East & Africa Market Analysis 2020 to 2024 and Forecast 2025 to 2035, By Country
    • Historical Market Size Value (USD Million) & Volume (Units) Trend Analysis By Market Taxonomy, 2020 to 2024
    • Market Size Value (USD Million) & Volume (Units) Forecast By Market Taxonomy, 2025 to 2035
      • By Country
        • Saudi Arabia
        • Other GCC Countries
        • Türkiye
        • South Africa
        • Rest of MEA
      • By Product
      • By Application
      • By Technology Used
      • By End User
    • Market Attractiveness Analysis
      • By Country
      • By Product
      • By Application
      • By Technology Used
      • By End User
    • Key Takeaways
  17. Key Countries Market Analysis
    • USA
      • Pricing Analysis
      • Market Share Analysis, 2024
        • By Product
        • By Application
        • By Technology Used
        • By End User
    • Brazil
      • Pricing Analysis
      • Market Share Analysis, 2024
        • By Product
        • By Application
        • By Technology Used
        • By End User
    • China
      • Pricing Analysis
      • Market Share Analysis, 2024
        • By Product
        • By Application
        • By Technology Used
        • By End User
    • India
      • Pricing Analysis
      • Market Share Analysis, 2024
        • By Product
        • By Application
        • By Technology Used
        • By End User
    • Europe
      • Pricing Analysis
      • Market Share Analysis, 2024
        • By Product
        • By Application
        • By Technology Used
        • By End User
    • Germany
      • Pricing Analysis
      • Market Share Analysis, 2024
        • By Product
        • By Application
        • By Technology Used
        • By End User
    • France
      • Pricing Analysis
      • Market Share Analysis, 2024
        • By Product
        • By Application
        • By Technology Used
        • By End User
    • UK
      • Pricing Analysis
      • Market Share Analysis, 2024
        • By Product
        • By Application
        • By Technology Used
        • By End User
  18. Market Structure Analysis
    • Competition Dashboard
    • Competition Benchmarking
    • Market Share Analysis of Top Players
      •  By Regional
      •  By Product
      •  By Application
      •  By Technology Used
      •  By End User
  19. Competition Analysis
    • Competition Deep Dive
      • Stryker
        • Overview
        • Product Portfolio
        • Profitability by Market Segments (Product/Age /Sales Channel/Region)
        • Sales Footprint
        • Strategy Overview
          • Marketing Strategy
          • Product Strategy
          • Channel Strategy
      • BD (Becton, Dickinson)
        • Overview
        • Product Portfolio
        • Profitability by Market Segments (Product/Age /Sales Channel/Region)
        • Sales Footprint
        • Strategy Overview
          • Marketing Strategy
          • Product Strategy
          • Channel Strategy
      • CONMED Corporation
        • Overview
        • Product Portfolio
        • Profitability by Market Segments (Product/Age /Sales Channel/Region)
        • Sales Footprint
        • Strategy Overview
          • Marketing Strategy
          • Product Strategy
          • Channel Strategy
      • Medtronic
        • Overview
        • Product Portfolio
        • Profitability by Market Segments (Product/Age /Sales Channel/Region)
        • Sales Footprint
        • Strategy Overview
          • Marketing Strategy
          • Product Strategy
          • Channel Strategy
      • Olympus Corporation
        • Overview
        • Product Portfolio
        • Profitability by Market Segments (Product/Age /Sales Channel/Region)
        • Sales Footprint
        • Strategy Overview
          • Marketing Strategy
          • Product Strategy
          • Channel Strategy
      • Karl Storz
        • Overview
        • Product Portfolio
        • Profitability by Market Segments (Product/Age /Sales Channel/Region)
        • Sales Footprint
        • Strategy Overview
          • Marketing Strategy
          • Product Strategy
          • Channel Strategy
      • Richard Wolf GmbH
        • Overview
        • Product Portfolio
        • Profitability by Market Segments (Product/Age /Sales Channel/Region)
        • Sales Footprint
        • Strategy Overview
          • Marketing Strategy
          • Product Strategy
          • Channel Strategy
      • Smith & Nephew
        • Overview
        • Product Portfolio
        • Profitability by Market Segments (Product/Age /Sales Channel/Region)
        • Sales Footprint
        • Strategy Overview
          • Marketing Strategy
          • Product Strategy
          • Channel Strategy
      • B. Braun Melsungen AG
        • Overview
        • Product Portfolio
        • Profitability by Market Segments (Product/Age /Sales Channel/Region)
        • Sales Footprint
        • Strategy Overview
          • Marketing Strategy
          • Product Strategy
          • Channel Strategy
      • Zimmer Biomet
        • Overview
        • Product Portfolio
        • Profitability by Market Segments (Product/Age /Sales Channel/Region)
        • Sales Footprint
        • Strategy Overview
          • Marketing Strategy
          • Product Strategy
          • Channel Strategy
      • Seemann Technologies
        • Overview
        • Product Portfolio
        • Profitability by Market Segments (Product/Age /Sales Channel/Region)
        • Sales Footprint
        • Strategy Overview
          • Marketing Strategy
          • Product Strategy
          • Channel Strategy
      • Cook Medical
        • Overview
        • Product Portfolio
        • Profitability by Market Segments (Product/Age /Sales Channel/Region)
        • Sales Footprint
        • Strategy Overview
          • Marketing Strategy
          • Product Strategy
          • Channel Strategy
      • Locamed GmbH
        • Overview
        • Product Portfolio
        • Profitability by Market Segments (Product/Age /Sales Channel/Region)
        • Sales Footprint
        • Strategy Overview
          • Marketing Strategy
          • Product Strategy
          • Channel Strategy
  20. Assumptions & Acronyms Used
  21. Research Methodology

List of Tables

  • Table 1: Global Market Value (USD Million) Forecast by Region, 2020-2035
  • Table 2: Global Market Volume (Units) Forecast by Region, 2020-2035
  • Table 3: Global Market Value (USD Million) Forecast by Product, 2020-2035
  • Table 4: Global Market Volume (Units) Forecast by Product, 2020-2035
  • Table 5: Global Market Value (USD Million) Forecast by Application, 2020-2035
  • Table 6: Global Market Volume (Units) Forecast by Application, 2020-2035
  • Table 7: Global Market Value (USD Million) Forecast by Technology Used, 2020-2035
  • Table 8: Global Market Volume (Units) Forecast by Technology Used, 2020-2035
  • Table 9: Global Market Value (USD Million) Forecast by End User, 2020-2035
  • Table 10: Global Market Volume (Units) Forecast by End User, 2020-2035
  • Table 11: North America Market Value (USD Million) Forecast by Country, 2020-2035
  • Table 12: North America Market Volume (Units) Forecast by Country, 2020-2035
  • Table 13: North America Market Value (USD Million) Forecast by Product, 2020-2035
  • Table 14: North America Market Volume (Units) Forecast by Product, 2020-2035
  • Table 15: North America Market Value (USD Million) Forecast by Application, 2020-2035
  • Table 16: North America Market Volume (Units) Forecast by Application, 2020-2035
  • Table 17: North America Market Value (USD Million) Forecast by Technology Used, 2020-2035
  • Table 18: North America Market Volume (Units) Forecast by Technology Used, 2020-2035
  • Table 19: North America Market Value (USD Million) Forecast by End User, 2020-2035
  • Table 20: North America Market Volume (Units) Forecast by End User, 2020-2035
  • Table 21: Latin America Market Value (USD Million) Forecast by Country, 2020-2035
  • Table 22: Latin America Market Volume (Units) Forecast by Country, 2020-2035
  • Table 23: Latin America Market Value (USD Million) Forecast by Product, 2020-2035
  • Table 24: Latin America Market Volume (Units) Forecast by Product, 2020-2035
  • Table 25: Latin America Market Value (USD Million) Forecast by Application, 2020-2035
  • Table 26: Latin America Market Volume (Units) Forecast by Application, 2020-2035
  • Table 27: Latin America Market Value (USD Million) Forecast by Technology Used, 2020-2035
  • Table 28: Latin America Market Volume (Units) Forecast by Technology Used, 2020-2035
  • Table 29: Latin America Market Value (USD Million) Forecast by End User, 2020-2035
  • Table 30: Latin America Market Volume (Units) Forecast by End User, 2020-2035
  • Table 31: East Asia Market Value (USD Million) Forecast by Country, 2020-2035
  • Table 32: East Asia Market Volume (Units) Forecast by Country, 2020-2035
  • Table 33: East Asia Market Value (USD Million) Forecast by Product, 2020-2035
  • Table 34: East Asia Market Volume (Units) Forecast by Product, 2020-2035
  • Table 35: East Asia Market Value (USD Million) Forecast by Application, 2020-2035
  • Table 36: East Asia Market Volume (Units) Forecast by Application, 2020-2035
  • Table 37: East Asia Market Value (USD Million) Forecast by Technology Used, 2020-2035
  • Table 38: East Asia Market Volume (Units) Forecast by Technology Used, 2020-2035
  • Table 39: East Asia Market Value (USD Million) Forecast by End User, 2020-2035
  • Table 40: East Asia Market Volume (Units) Forecast by End User, 2020-2035
  • Table 41: South Asia Market Value (USD Million) Forecast by Country, 2020-2035
  • Table 42: South Asia Market Volume (Units) Forecast by Country, 2020-2035
  • Table 43: South Asia Market Value (USD Million) Forecast by Product, 2020-2035
  • Table 44: South Asia Market Volume (Units) Forecast by Product, 2020-2035
  • Table 45: South Asia Market Value (USD Million) Forecast by Application, 2020-2035
  • Table 46: South Asia Market Volume (Units) Forecast by Application, 2020-2035
  • Table 47: South Asia Market Value (USD Million) Forecast by Technology Used, 2020-2035
  • Table 48: South Asia Market Volume (Units) Forecast by Technology Used, 2020-2035
  • Table 49: South Asia Market Value (USD Million) Forecast by End User, 2020-2035
  • Table 50: South Asia Market Volume (Units) Forecast by End User, 2020-2035
  • Table 51: Western Europe Market Value (USD Million) Forecast by Country, 2020-2035
  • Table 52: Western Europe Market Volume (Units) Forecast by Country, 2020-2035
  • Table 53: Western Europe Market Value (USD Million) Forecast by Product, 2020-2035
  • Table 54: Western Europe Market Volume (Units) Forecast by Product, 2020-2035
  • Table 55: Western Europe Market Value (USD Million) Forecast by Application, 2020-2035
  • Table 56: Western Europe Market Volume (Units) Forecast by Application, 2020-2035
  • Table 57: Western Europe Market Value (USD Million) Forecast by Technology Used, 2020-2035
  • Table 58: Western Europe Market Volume (Units) Forecast by Technology Used, 2020-2035
  • Table 59: Western Europe Market Value (USD Million) Forecast by End User, 2020-2035
  • Table 60: Western Europe Market Volume (Units) Forecast by End User, 2020-2035
  • Table 61: Eastern Europe Market Value (USD Million) Forecast by Country, 2020-2035
  • Table 62: Eastern Europe Market Volume (Units) Forecast by Country, 2020-2035
  • Table 63: Eastern Europe Market Value (USD Million) Forecast by Product, 2020-2035
  • Table 64: Eastern Europe Market Volume (Units) Forecast by Product, 2020-2035
  • Table 65: Eastern Europe Market Value (USD Million) Forecast by Application, 2020-2035
  • Table 66: Eastern Europe Market Volume (Units) Forecast by Application, 2020-2035
  • Table 67: Eastern Europe Market Value (USD Million) Forecast by Technology Used, 2020-2035
  • Table 68: Eastern Europe Market Volume (Units) Forecast by Technology Used, 2020-2035
  • Table 69: Eastern Europe Market Value (USD Million) Forecast by End User, 2020-2035
  • Table 70: Eastern Europe Market Volume (Units) Forecast by End User, 2020-2035
  • Table 71: Middle East & Africa Market Value (USD Million) Forecast by Country, 2020-2035
  • Table 72: Middle East & Africa Market Volume (Units) Forecast by Country, 2020-2035
  • Table 73: Middle East & Africa Market Value (USD Million) Forecast by Product, 2020-2035
  • Table 74: Middle East & Africa Market Volume (Units) Forecast by Product, 2020-2035
  • Table 75: Middle East & Africa Market Value (USD Million) Forecast by Application, 2020-2035
  • Table 76: Middle East & Africa Market Volume (Units) Forecast by Application, 2020-2035
  • Table 77: Middle East & Africa Market Value (USD Million) Forecast by Technology Used, 2020-2035
  • Table 78: Middle East & Africa Market Volume (Units) Forecast by Technology Used, 2020-2035
  • Table 79: Middle East & Africa Market Value (USD Million) Forecast by End User, 2020-2035
  • Table 80: Middle East & Africa Market Volume (Units) Forecast by End User, 2020-2035

List of Figures

  • Figure 1: Global Market Value (USD Million) by Product, 2025-2035
  • Figure 2: Global Market Value (USD Million) by Application, 2025-2035
  • Figure 3: Global Market Value (USD Million) by Technology Used, 2025-2035
  • Figure 4: Global Market Value (USD Million) by End User, 2025-2035
  • Figure 5: Global Market Value (USD Million) by Region, 2025-2035
  • Figure 6: Global Market Value (USD Million) Analysis by Region, 2020-2035
  • Figure 7: Global Market Volume (Units) Analysis by Region, 2020-2035
  • Figure 8: Global Market Value Share (%) and BPS Analysis by Region, 2025-2035
  • Figure 9: Global Market Y-o-Y Growth (%) Projections by Region, 2025-2035
  • Figure 10: Global Market Value (USD Million) Analysis by Product, 2020-2035
  • Figure 11: Global Market Volume (Units) Analysis by Product, 2020-2035
  • Figure 12: Global Market Value Share (%) and BPS Analysis by Product, 2025-2035
  • Figure 13: Global Market Y-o-Y Growth (%) Projections by Product, 2025-2035
  • Figure 14: Global Market Value (USD Million) Analysis by Application, 2020-2035
  • Figure 15: Global Market Volume (Units) Analysis by Application, 2020-2035
  • Figure 16: Global Market Value Share (%) and BPS Analysis by Application, 2025-2035
  • Figure 17: Global Market Y-o-Y Growth (%) Projections by Application, 2025-2035
  • Figure 18: Global Market Value (USD Million) Analysis by Technology Used, 2020-2035
  • Figure 19: Global Market Volume (Units) Analysis by Technology Used, 2020-2035
  • Figure 20: Global Market Value Share (%) and BPS Analysis by Technology Used, 2025-2035
  • Figure 21: Global Market Y-o-Y Growth (%) Projections by Technology Used, 2025-2035
  • Figure 22: Global Market Value (USD Million) Analysis by End User, 2020-2035
  • Figure 23: Global Market Volume (Units) Analysis by End User, 2020-2035
  • Figure 24: Global Market Value Share (%) and BPS Analysis by End User, 2025-2035
  • Figure 25: Global Market Y-o-Y Growth (%) Projections by End User, 2025-2035
  • Figure 26: Global Market Attractiveness by Product, 2025-2035
  • Figure 27: Global Market Attractiveness by Application, 2025-2035
  • Figure 28: Global Market Attractiveness by Technology Used, 2025-2035
  • Figure 29: Global Market Attractiveness by End User, 2025-2035
  • Figure 30: Global Market Attractiveness by Region, 2025-2035
  • Figure 31: North America Market Value (USD Million) by Product, 2025-2035
  • Figure 32: North America Market Value (USD Million) by Application, 2025-2035
  • Figure 33: North America Market Value (USD Million) by Technology Used, 2025-2035
  • Figure 34: North America Market Value (USD Million) by End User, 2025-2035
  • Figure 35: North America Market Value (USD Million) by Country, 2025-2035
  • Figure 36: North America Market Value (USD Million) Analysis by Country, 2020-2035
  • Figure 37: North America Market Volume (Units) Analysis by Country, 2020-2035
  • Figure 38: North America Market Value Share (%) and BPS Analysis by Country, 2025-2035
  • Figure 39: North America Market Y-o-Y Growth (%) Projections by Country, 2025-2035
  • Figure 40: North America Market Value (USD Million) Analysis by Product, 2020-2035
  • Figure 41: North America Market Volume (Units) Analysis by Product, 2020-2035
  • Figure 42: North America Market Value Share (%) and BPS Analysis by Product, 2025-2035
  • Figure 43: North America Market Y-o-Y Growth (%) Projections by Product, 2025-2035
  • Figure 44: North America Market Value (USD Million) Analysis by Application, 2020-2035
  • Figure 45: North America Market Volume (Units) Analysis by Application, 2020-2035
  • Figure 46: North America Market Value Share (%) and BPS Analysis by Application, 2025-2035
  • Figure 47: North America Market Y-o-Y Growth (%) Projections by Application, 2025-2035
  • Figure 48: North America Market Value (USD Million) Analysis by Technology Used, 2020-2035
  • Figure 49: North America Market Volume (Units) Analysis by Technology Used, 2020-2035
  • Figure 50: North America Market Value Share (%) and BPS Analysis by Technology Used, 2025-2035
  • Figure 51: North America Market Y-o-Y Growth (%) Projections by Technology Used, 2025-2035
  • Figure 52: North America Market Value (USD Million) Analysis by End User, 2020-2035
  • Figure 53: North America Market Volume (Units) Analysis by End User, 2020-2035
  • Figure 54: North America Market Value Share (%) and BPS Analysis by End User, 2025-2035
  • Figure 55: North America Market Y-o-Y Growth (%) Projections by End User, 2025-2035
  • Figure 56: North America Market Attractiveness by Product, 2025-2035
  • Figure 57: North America Market Attractiveness by Application, 2025-2035
  • Figure 58: North America Market Attractiveness by Technology Used, 2025-2035
  • Figure 59: North America Market Attractiveness by End User, 2025-2035
  • Figure 60: North America Market Attractiveness by Country, 2025-2035
  • Figure 61: Latin America Market Value (USD Million) by Product, 2025-2035
  • Figure 62: Latin America Market Value (USD Million) by Application, 2025-2035
  • Figure 63: Latin America Market Value (USD Million) by Technology Used, 2025-2035
  • Figure 64: Latin America Market Value (USD Million) by End User, 2025-2035
  • Figure 65: Latin America Market Value (USD Million) by Country, 2025-2035
  • Figure 66: Latin America Market Value (USD Million) Analysis by Country, 2020-2035
  • Figure 67: Latin America Market Volume (Units) Analysis by Country, 2020-2035
  • Figure 68: Latin America Market Value Share (%) and BPS Analysis by Country, 2025-2035
  • Figure 69: Latin America Market Y-o-Y Growth (%) Projections by Country, 2025-2035
  • Figure 70: Latin America Market Value (USD Million) Analysis by Product, 2020-2035
  • Figure 71: Latin America Market Volume (Units) Analysis by Product, 2020-2035
  • Figure 72: Latin America Market Value Share (%) and BPS Analysis by Product, 2025-2035
  • Figure 73: Latin America Market Y-o-Y Growth (%) Projections by Product, 2025-2035
  • Figure 74: Latin America Market Value (USD Million) Analysis by Application, 2020-2035
  • Figure 75: Latin America Market Volume (Units) Analysis by Application, 2020-2035
  • Figure 76: Latin America Market Value Share (%) and BPS Analysis by Application, 2025-2035
  • Figure 77: Latin America Market Y-o-Y Growth (%) Projections by Application, 2025-2035
  • Figure 78: Latin America Market Value (USD Million) Analysis by Technology Used, 2020-2035
  • Figure 79: Latin America Market Volume (Units) Analysis by Technology Used, 2020-2035
  • Figure 80: Latin America Market Value Share (%) and BPS Analysis by Technology Used, 2025-2035
  • Figure 81: Latin America Market Y-o-Y Growth (%) Projections by Technology Used, 2025-2035
  • Figure 82: Latin America Market Value (USD Million) Analysis by End User, 2020-2035
  • Figure 83: Latin America Market Volume (Units) Analysis by End User, 2020-2035
  • Figure 84: Latin America Market Value Share (%) and BPS Analysis by End User, 2025-2035
  • Figure 85: Latin America Market Y-o-Y Growth (%) Projections by End User, 2025-2035
  • Figure 86: Latin America Market Attractiveness by Product, 2025-2035
  • Figure 87: Latin America Market Attractiveness by Application, 2025-2035
  • Figure 88: Latin America Market Attractiveness by Technology Used, 2025-2035
  • Figure 89: Latin America Market Attractiveness by End User, 2025-2035
  • Figure 90: Latin America Market Attractiveness by Country, 2025-2035
  • Figure 91: East Asia Market Value (USD Million) by Product, 2025-2035
  • Figure 92: East Asia Market Value (USD Million) by Application, 2025-2035
  • Figure 93: East Asia Market Value (USD Million) by Technology Used, 2025-2035
  • Figure 94: East Asia Market Value (USD Million) by End User, 2025-2035
  • Figure 95: East Asia Market Value (USD Million) by Country, 2025-2035
  • Figure 96: East Asia Market Value (USD Million) Analysis by Country, 2020-2035
  • Figure 97: East Asia Market Volume (Units) Analysis by Country, 2020-2035
  • Figure 98: East Asia Market Value Share (%) and BPS Analysis by Country, 2025-2035
  • Figure 99: East Asia Market Y-o-Y Growth (%) Projections by Country, 2025-2035
  • Figure 100: East Asia Market Value (USD Million) Analysis by Product, 2020-2035
  • Figure 101: East Asia Market Volume (Units) Analysis by Product, 2020-2035
  • Figure 102: East Asia Market Value Share (%) and BPS Analysis by Product, 2025-2035
  • Figure 103: East Asia Market Y-o-Y Growth (%) Projections by Product, 2025-2035
  • Figure 104: East Asia Market Value (USD Million) Analysis by Application, 2020-2035
  • Figure 105: East Asia Market Volume (Units) Analysis by Application, 2020-2035
  • Figure 106: East Asia Market Value Share (%) and BPS Analysis by Application, 2025-2035
  • Figure 107: East Asia Market Y-o-Y Growth (%) Projections by Application, 2025-2035
  • Figure 108: East Asia Market Value (USD Million) Analysis by Technology Used, 2020-2035
  • Figure 109: East Asia Market Volume (Units) Analysis by Technology Used, 2020-2035
  • Figure 110: East Asia Market Value Share (%) and BPS Analysis by Technology Used, 2025-2035
  • Figure 111: East Asia Market Y-o-Y Growth (%) Projections by Technology Used, 2025-2035
  • Figure 112: East Asia Market Value (USD Million) Analysis by End User, 2020-2035
  • Figure 113: East Asia Market Volume (Units) Analysis by End User, 2020-2035
  • Figure 114: East Asia Market Value Share (%) and BPS Analysis by End User, 2025-2035
  • Figure 115: East Asia Market Y-o-Y Growth (%) Projections by End User, 2025-2035
  • Figure 116: East Asia Market Attractiveness by Product, 2025-2035
  • Figure 117: East Asia Market Attractiveness by Application, 2025-2035
  • Figure 118: East Asia Market Attractiveness by Technology Used, 2025-2035
  • Figure 119: East Asia Market Attractiveness by End User, 2025-2035
  • Figure 120: East Asia Market Attractiveness by Country, 2025-2035
  • Figure 121: South Asia Market Value (USD Million) by Product, 2025-2035
  • Figure 122: South Asia Market Value (USD Million) by Application, 2025-2035
  • Figure 123: South Asia Market Value (USD Million) by Technology Used, 2025-2035
  • Figure 124: South Asia Market Value (USD Million) by End User, 2025-2035
  • Figure 125: South Asia Market Value (USD Million) by Country, 2025-2035
  • Figure 126: South Asia Market Value (USD Million) Analysis by Country, 2020-2035
  • Figure 127: South Asia Market Volume (Units) Analysis by Country, 2020-2035
  • Figure 128: South Asia Market Value Share (%) and BPS Analysis by Country, 2025-2035
  • Figure 129: South Asia Market Y-o-Y Growth (%) Projections by Country, 2025-2035
  • Figure 130: South Asia Market Value (USD Million) Analysis by Product, 2020-2035
  • Figure 131: South Asia Market Volume (Units) Analysis by Product, 2020-2035
  • Figure 132: South Asia Market Value Share (%) and BPS Analysis by Product, 2025-2035
  • Figure 133: South Asia Market Y-o-Y Growth (%) Projections by Product, 2025-2035
  • Figure 134: South Asia Market Value (USD Million) Analysis by Application, 2020-2035
  • Figure 135: South Asia Market Volume (Units) Analysis by Application, 2020-2035
  • Figure 136: South Asia Market Value Share (%) and BPS Analysis by Application, 2025-2035
  • Figure 137: South Asia Market Y-o-Y Growth (%) Projections by Application, 2025-2035
  • Figure 138: South Asia Market Value (USD Million) Analysis by Technology Used, 2020-2035
  • Figure 139: South Asia Market Volume (Units) Analysis by Technology Used, 2020-2035
  • Figure 140: South Asia Market Value Share (%) and BPS Analysis by Technology Used, 2025-2035
  • Figure 141: South Asia Market Y-o-Y Growth (%) Projections by Technology Used, 2025-2035
  • Figure 142: South Asia Market Value (USD Million) Analysis by End User, 2020-2035
  • Figure 143: South Asia Market Volume (Units) Analysis by End User, 2020-2035
  • Figure 144: South Asia Market Value Share (%) and BPS Analysis by End User, 2025-2035
  • Figure 145: South Asia Market Y-o-Y Growth (%) Projections by End User, 2025-2035
  • Figure 146: South Asia Market Attractiveness by Product, 2025-2035
  • Figure 147: South Asia Market Attractiveness by Application, 2025-2035
  • Figure 148: South Asia Market Attractiveness by Technology Used, 2025-2035
  • Figure 149: South Asia Market Attractiveness by End User, 2025-2035
  • Figure 150: South Asia Market Attractiveness by Country, 2025-2035
  • Figure 151: Western Europe Market Value (USD Million) by Product, 2025-2035
  • Figure 152: Western Europe Market Value (USD Million) by Application, 2025-2035
  • Figure 153: Western Europe Market Value (USD Million) by Technology Used, 2025-2035
  • Figure 154: Western Europe Market Value (USD Million) by End User, 2025-2035
  • Figure 155: Western Europe Market Value (USD Million) by Country, 2025-2035
  • Figure 156: Western Europe Market Value (USD Million) Analysis by Country, 2020-2035
  • Figure 157: Western Europe Market Volume (Units) Analysis by Country, 2020-2035
  • Figure 158: Western Europe Market Value Share (%) and BPS Analysis by Country, 2025-2035
  • Figure 159: Western Europe Market Y-o-Y Growth (%) Projections by Country, 2025-2035
  • Figure 160: Western Europe Market Value (USD Million) Analysis by Product, 2020-2035
  • Figure 161: Western Europe Market Volume (Units) Analysis by Product, 2020-2035
  • Figure 162: Western Europe Market Value Share (%) and BPS Analysis by Product, 2025-2035
  • Figure 163: Western Europe Market Y-o-Y Growth (%) Projections by Product, 2025-2035
  • Figure 164: Western Europe Market Value (USD Million) Analysis by Application, 2020-2035
  • Figure 165: Western Europe Market Volume (Units) Analysis by Application, 2020-2035
  • Figure 166: Western Europe Market Value Share (%) and BPS Analysis by Application, 2025-2035
  • Figure 167: Western Europe Market Y-o-Y Growth (%) Projections by Application, 2025-2035
  • Figure 168: Western Europe Market Value (USD Million) Analysis by Technology Used, 2020-2035
  • Figure 169: Western Europe Market Volume (Units) Analysis by Technology Used, 2020-2035
  • Figure 170: Western Europe Market Value Share (%) and BPS Analysis by Technology Used, 2025-2035
  • Figure 171: Western Europe Market Y-o-Y Growth (%) Projections by Technology Used, 2025-2035
  • Figure 172: Western Europe Market Value (USD Million) Analysis by End User, 2020-2035
  • Figure 173: Western Europe Market Volume (Units) Analysis by End User, 2020-2035
  • Figure 174: Western Europe Market Value Share (%) and BPS Analysis by End User, 2025-2035
  • Figure 175: Western Europe Market Y-o-Y Growth (%) Projections by End User, 2025-2035
  • Figure 176: Western Europe Market Attractiveness by Product, 2025-2035
  • Figure 177: Western Europe Market Attractiveness by Application, 2025-2035
  • Figure 178: Western Europe Market Attractiveness by Technology Used, 2025-2035
  • Figure 179: Western Europe Market Attractiveness by End User, 2025-2035
  • Figure 180: Western Europe Market Attractiveness by Country, 2025-2035
  • Figure 181: Eastern Europe Market Value (USD Million) by Product, 2025-2035
  • Figure 182: Eastern Europe Market Value (USD Million) by Application, 2025-2035
  • Figure 183: Eastern Europe Market Value (USD Million) by Technology Used, 2025-2035
  • Figure 184: Eastern Europe Market Value (USD Million) by End User, 2025-2035
  • Figure 185: Eastern Europe Market Value (USD Million) by Country, 2025-2035
  • Figure 186: Eastern Europe Market Value (USD Million) Analysis by Country, 2020-2035
  • Figure 187: Eastern Europe Market Volume (Units) Analysis by Country, 2020-2035
  • Figure 188: Eastern Europe Market Value Share (%) and BPS Analysis by Country, 2025-2035
  • Figure 189: Eastern Europe Market Y-o-Y Growth (%) Projections by Country, 2025-2035
  • Figure 190: Eastern Europe Market Value (USD Million) Analysis by Product, 2020-2035
  • Figure 191: Eastern Europe Market Volume (Units) Analysis by Product, 2020-2035
  • Figure 192: Eastern Europe Market Value Share (%) and BPS Analysis by Product, 2025-2035
  • Figure 193: Eastern Europe Market Y-o-Y Growth (%) Projections by Product, 2025-2035
  • Figure 194: Eastern Europe Market Value (USD Million) Analysis by Application, 2020-2035
  • Figure 195: Eastern Europe Market Volume (Units) Analysis by Application, 2020-2035
  • Figure 196: Eastern Europe Market Value Share (%) and BPS Analysis by Application, 2025-2035
  • Figure 197: Eastern Europe Market Y-o-Y Growth (%) Projections by Application, 2025-2035
  • Figure 198: Eastern Europe Market Value (USD Million) Analysis by Technology Used, 2020-2035
  • Figure 199: Eastern Europe Market Volume (Units) Analysis by Technology Used, 2020-2035
  • Figure 200: Eastern Europe Market Value Share (%) and BPS Analysis by Technology Used, 2025-2035
  • Figure 201: Eastern Europe Market Y-o-Y Growth (%) Projections by Technology Used, 2025-2035
  • Figure 202: Eastern Europe Market Value (USD Million) Analysis by End User, 2020-2035
  • Figure 203: Eastern Europe Market Volume (Units) Analysis by End User, 2020-2035
  • Figure 204: Eastern Europe Market Value Share (%) and BPS Analysis by End User, 2025-2035
  • Figure 205: Eastern Europe Market Y-o-Y Growth (%) Projections by End User, 2025-2035
  • Figure 206: Eastern Europe Market Attractiveness by Product, 2025-2035
  • Figure 207: Eastern Europe Market Attractiveness by Application, 2025-2035
  • Figure 208: Eastern Europe Market Attractiveness by Technology Used, 2025-2035
  • Figure 209: Eastern Europe Market Attractiveness by End User, 2025-2035
  • Figure 210: Eastern Europe Market Attractiveness by Country, 2025-2035
  • Figure 211: Middle East & Africa Market Value (USD Million) by Product, 2025-2035
  • Figure 212: Middle East & Africa Market Value (USD Million) by Application, 2025-2035
  • Figure 213: Middle East & Africa Market Value (USD Million) by Technology Used, 2025-2035
  • Figure 214: Middle East & Africa Market Value (USD Million) by End User, 2025-2035
  • Figure 215: Middle East & Africa Market Value (USD Million) by Country, 2025-2035
  • Figure 216: Middle East & Africa Market Value (USD Million) Analysis by Country, 2020-2035
  • Figure 217: Middle East & Africa Market Volume (Units) Analysis by Country, 2020-2035
  • Figure 218: Middle East & Africa Market Value Share (%) and BPS Analysis by Country, 2025-2035
  • Figure 219: Middle East & Africa Market Y-o-Y Growth (%) Projections by Country, 2025-2035
  • Figure 220: Middle East & Africa Market Value (USD Million) Analysis by Product, 2020-2035
  • Figure 221: Middle East & Africa Market Volume (Units) Analysis by Product, 2020-2035
  • Figure 222: Middle East & Africa Market Value Share (%) and BPS Analysis by Product, 2025-2035
  • Figure 223: Middle East & Africa Market Y-o-Y Growth (%) Projections by Product, 2025-2035
  • Figure 224: Middle East & Africa Market Value (USD Million) Analysis by Application, 2020-2035
  • Figure 225: Middle East & Africa Market Volume (Units) Analysis by Application, 2020-2035
  • Figure 226: Middle East & Africa Market Value Share (%) and BPS Analysis by Application, 2025-2035
  • Figure 227: Middle East & Africa Market Y-o-Y Growth (%) Projections by Application, 2025-2035
  • Figure 228: Middle East & Africa Market Value (USD Million) Analysis by Technology Used, 2020-2035
  • Figure 229: Middle East & Africa Market Volume (Units) Analysis by Technology Used, 2020-2035
  • Figure 230: Middle East & Africa Market Value Share (%) and BPS Analysis by Technology Used, 2025-2035
  • Figure 231: Middle East & Africa Market Y-o-Y Growth (%) Projections by Technology Used, 2025-2035
  • Figure 232: Middle East & Africa Market Value (USD Million) Analysis by End User, 2020-2035
  • Figure 233: Middle East & Africa Market Volume (Units) Analysis by End User, 2020-2035
  • Figure 234: Middle East & Africa Market Value Share (%) and BPS Analysis by End User, 2025-2035
  • Figure 235: Middle East & Africa Market Y-o-Y Growth (%) Projections by End User, 2025-2035
  • Figure 236: Middle East & Africa Market Attractiveness by Product, 2025-2035
  • Figure 237: Middle East & Africa Market Attractiveness by Application, 2025-2035
  • Figure 238: Middle East & Africa Market Attractiveness by Technology Used, 2025-2035
  • Figure 239: Middle East & Africa Market Attractiveness by End User, 2025-2035
  • Figure 240: Middle East & Africa Market Attractiveness by Country, 2025-2035

Frequently Asked Questions

How big is the suction irrigation devices market in 2025?

The global suction irrigation devices is estimated to be valued at USD 457.7 million in 2025.

What will be the size of the suction irrigation devices market in 2035?

The market size for the suction irrigation devices market is projected to reach approximately USD 710.8 million by 2035.

How much will the suction irrigation devices market grow between 2025 and 2035?

The suction irrigation devices market is expected to grow at a CAGR of 4.5% between 2025 and 2035.

What are the key products formats in the suction irrigation devices market?

The key products in the suction irrigation devices market include disposable suction-irrigation devices, reusable suction-irrigation devices, hybrid systems (reusable handle + disposable tip) and suction-irrigation pumps.

Which end user segment will contribute a significant share in the suction irrigation devices market in 2025?

In terms of end user, the hospitals segment is projected to command the highest share at 56.4% in the suction irrigation devices market in 2025.

Explore Similar Insights

Future Market Insights

Suction Irrigation Devices Market