

- Market Size (2026)
- USD 820.6 Mn
- Forecast (2036)
- USD 1788.1 Mn
- CAGR (2026 to 2036)
- 8.1%
How big is the Sunscreen Dispersion Additives Market?
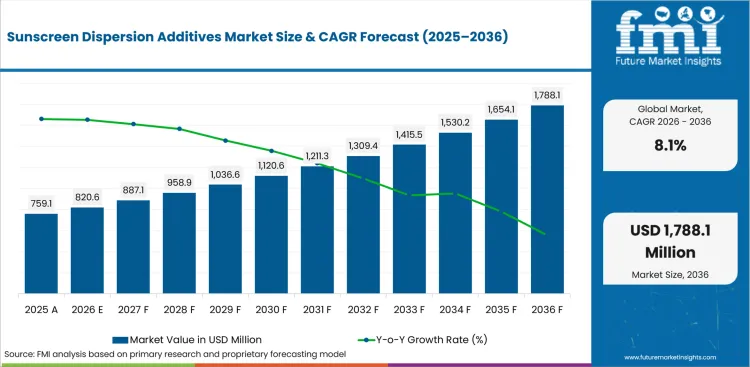
The Sunscreen Dispersion Additives Market is projected to grow from USD 820.6 million in 2026 to USD 1788.1 million by 2036, at a CAGR of 8.1%.
The Sunscreen Dispersion Additives Market was valued at USD 759.11 million in 2025. The market is expected to reach USD 820.6 million in 2026 and USD 1788.1 million by 2036 at a CAGR of 8.1%.
In March 2024, BASF supported Meifubao’s ocean-friendly sunscreen launch in China. The development showed stronger supplier-brand collaboration around environmentally screened sunscreen systems. In October 2024, Evonik partnered with Kolmar Cosmetics Wuxi for sustainable beauty innovation. The work included sun care and formulation research for China-focused development.
The FDA’s 2026 action on bemotrizinol signals renewed interest in modern UV filter systems, while European sunscreen claims rules keep pressure on reproducible testing.
| Metric | Value |
|---|---|
| 2025 Market Size | USD 759.11 million |
| 2026 Market Size | USD 820.6 million |
| 2036 Market Size | USD 1,788.1 million |
| Forecast CAGR (2026-2036) | 8.1% |
| Leading Additive Type | Wetting & Dispersing Agents |
| Wetting & Dispersing Agents Share (2026) | 38.0% |
| Leading UV Filter Compatibility | Mineral UV Filters |
| Mineral UV Filters Share (2026) | 46.5% |
| Fastest-growing Country | India |
| India CAGR by 2036 | 9.3% |
Summary of the Sunscreen Dispersion Additives Market
| Market Signal | Commercial Impact |
|---|---|
| Demand and Growth Drivers | Demand for sunscreen dispersion additives is increasing as cosmetic manufacturers develop high-performance mineral sunscreen formulations with improved stability, texture, and skin feel.
|
| Product and Segment View | Wetting and dispersing agents, mineral UV filters, and cream & lotion formulations continue to represent the leading commercial opportunities across the market.
|
| Geography and Growth Outlook | Asia continues to drive market expansion through growing sunscreen consumption, cosmetic innovation, and premium skincare product development.
|
| Competitive Landscape | Competition increasingly focuses on formulation expertise, dispersion performance, sensory enhancement, and regulatory support for advanced sunscreen products.
|
| Analyst Perspective | Sunscreen dispersion additives are evolving from supporting formulation ingredients into critical performance components that influence SPF stability, product aesthetics, and consumer experience.
- Nikhil Kaitwade, Principal Consultant at Future Market Insights |
Why is the Sunscreen Dispersion Additives Market growing?
Mineral sunscreens need stronger particle wetting since zinc oxide and titanium dioxide can agglomerate during storage and application. Daily SPF formats raise dispersion needs as formulators must combine UV protection with light skin-care texture.
- Mineral sunscreens need stronger particle wetting since zinc oxide and titanium dioxide can agglomerate during storage and application.
- Daily SPF formats raise dispersion needs as formulators must combine UV protection with light skin-care texture.
- Tinted sunscreen launches need pigment and UV filter dispersion so shade consistency stays stable across batches.
Daily facial sunscreen is changing the additive brief from basic stability to skin-care grade performance. European industry data showed skin care as a large cosmetics category at €32.3 billion in 2025, which shows how sunscreen is being pulled into daily facial routines. This means additive suppliers must support spreadability, low tack and filter distribution instead of treating sunscreen as a seasonal product. Buyers now test additives against sensory feel and SPF retention in the same cycle. The practical result is stronger demand for sun care products ingredients that can bridge cosmetic elegance and protection claims. Mineral and hybrid systems are driving higher additive intensity across formulation labs.
How is the Sunscreen Dispersion Additives Market segmented?
The Sunscreen Dispersion Additives Market is segmented by additive type, UV filter compatibility, application, form, sales channel, and region.
- Wetting & Dispersing Agents are projected to account for 38.0% of additive type demand in 2026 as mineral filters need controlled particle separation.
- With an estimated 46.5% share in 2026, Mineral UV Filters are expected to lead the UV-filter-compatibility category due to zinc oxide and titanium dioxide use.
- Creams & Lotions are anticipated to hold 51.0% of application demand in 2026 with daily facial SPF driving emulsion work.
How do Wetting & Dispersing Agents contribute to the additive type category?
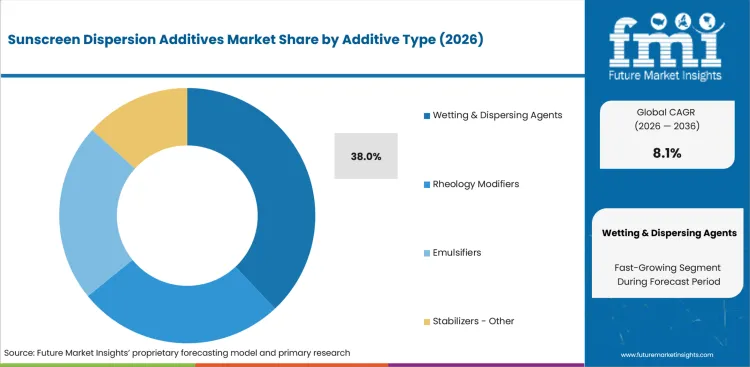
- Wetting & Dispersing Agents are projected to account for a 38.0% share in 2026 as mineral filters need particle wetting before viscosity and SPF performance can be controlled.
- Buyers compare dispersants through mill time, particle settling and whitening reduction, since small formulation changes can alter how zinc oxide or titanium dioxide spreads on skin.
What supports demand for Mineral UV Filters?
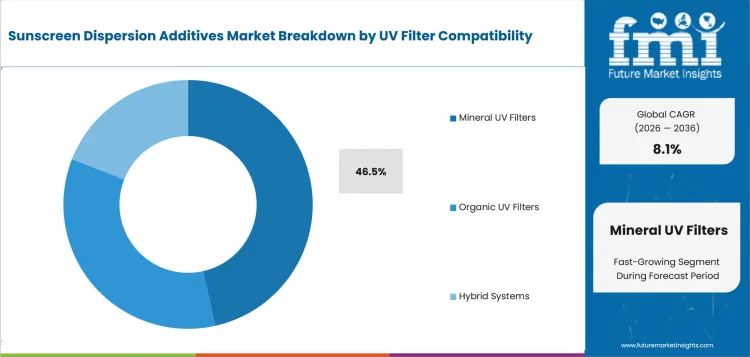
- Mineral UV Filters are expected to represent a 46.5% share in 2026 as zinc oxide and titanium dioxide systems require additive support from premix through final emulsion.
- Mineral systems create a higher testing burden than clear organic formulas, as formulators must check particle size, opacity and sensory drag after storage.
How do buyers evaluate Creams & Lotions within the application category?
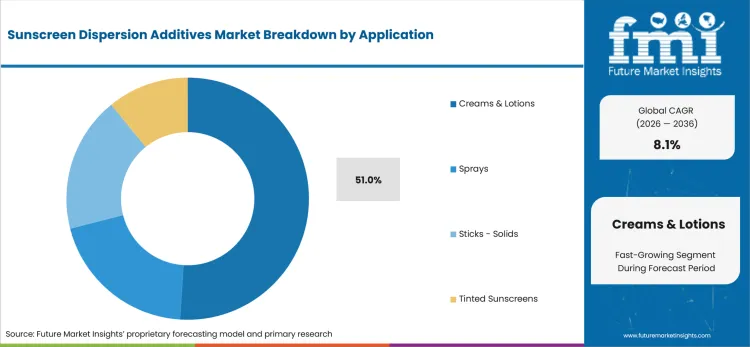
- Creams & Lotions are anticipated to account for a 51.0% share in 2026 as daily SPF moisturizers need dispersion control and pleasant rub-in.
- Cream formats let formulators combine emulsifiers, rheology modifiers and dispersants in one system, which supports higher SPF testing flexibility than sticks or sprays.
What market factors influence demand for Liquid?
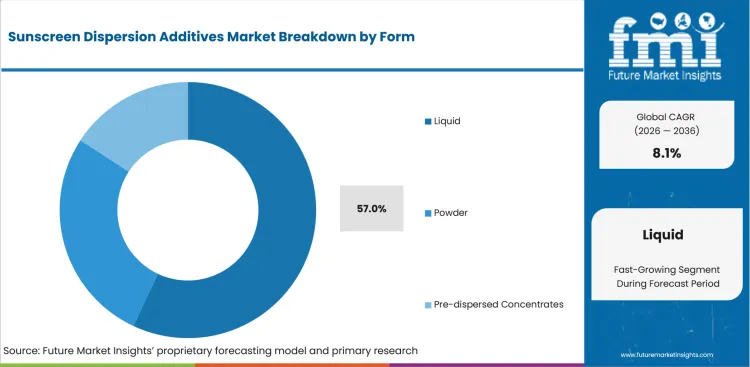
- Liquid is estimated to hold a 57.0% share in 2026 as production teams prefer additives that dose easily into emulsions and premixes.
- Liquid additives reduce weighing losses and dust exposure during batching, which makes them practical for contract manufacturers running several sunscreen formulas.
How does Direct to Formulators affect the sales channel outlook?
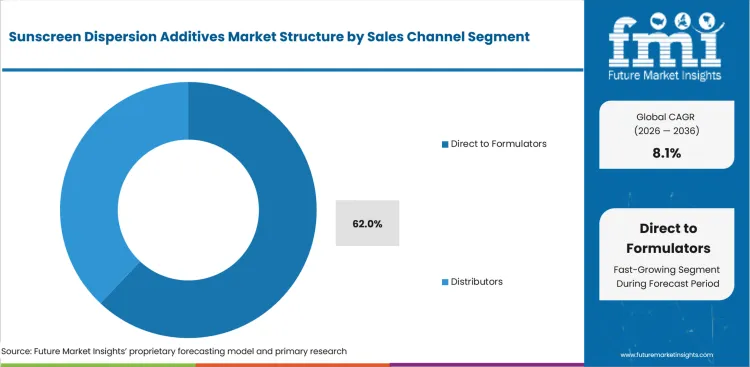
- Direct to Formulators is projected to represent a 62.0% share in 2026 as sunscreen buyers need technical support before approving additives.
- Direct sales channels handle sample work, formula adjustment and SPF troubleshooting, which distributors usually cannot support at the same depth for complex mineral systems.
What drives and restrains the market?
Driver: Mineral particle control drives additive use as brands try to reduce whitening without weakening UV protection; restraint: A key restraint is validation cost because every formulation change can require new stability and SPF testing; opportunity: daily facial SPF expands the opportunity as sunscreen textures must match moisturizers, primers and tinted sunscreen.
The market reflects a balance between the identified demand driver, adoption constraints, and the supplier opportunity outlined below.
- Driver: Mineral particle control drives additive use as brands try to reduce whitening without weakening UV protection.
- Restraint: A key restraint is validation cost because every formulation change can require new stability and SPF testing.
- Opportunity: daily facial SPF expands the opportunity as sunscreen textures must match moisturizers, primers and tinted sunscreen.
Mineral Particle Stability: Mineral sunscreen growth depends on the ability to keep particles separated during production and storage. BASF’s Z-COTE portfolio highlights low-whitening zinc oxide grades and dispersions made to improve processing flexibility. That supplier focus reflects a clear market need. Poor dispersion can reduce elegance, increase drag and create visible white residue after application. Wetting agents and dispersants therefore become performance tools rather than minor processing aids. Buyers choosing mineral systems need additives that survive heat, shear and long shelf life.
Daily SPF Texture Pressure: Daily-use SPF formats are raising the standard for sensory performance across sunscreen development. Evonik’s SunGuardians 2.0 concept points to strong European interest in SPF50+ products and new textures such as oils and sticks. This shows how sunscreen is moving closer to skin-care use occasions. Dispersion additives must now support light feel, low tack and even filter distribution in products used every morning. The opportunity is notable where sun protection overlaps with blue light protection ingredients and skin-care claims. Suppliers with broad sensory and emulsion know-how can protect margins in this part of the market.
Which factors support expansion?
Commercial expansion is reinforced by the value, workflow, and recurring-demand factors below.
- Market value is rising as high-SPF daily products need more additive content per finished formulation than older beach-use products.
- Mineral sunscreen work raises additive spending since zinc oxide and titanium dioxide need wetting, grinding support and anti-settling control.
- Hybrid UV systems lift value per kilogram as suppliers must balance oil-phase solubilization with mineral particle stability.
Which country markets are included in the CAGR comparison?
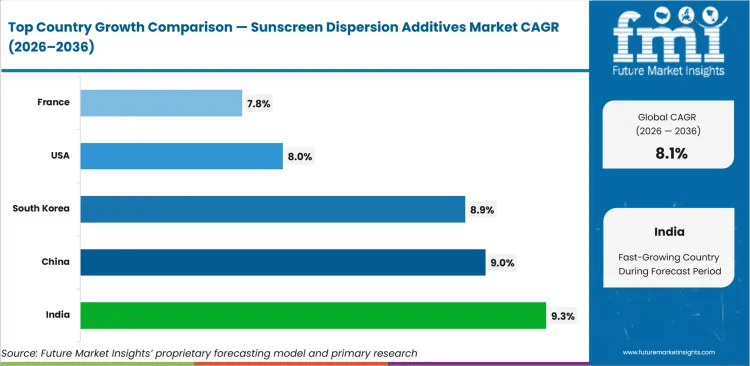
The selected CAGR comparison covers India (9.3%), China (9.0%), South Korea (8.9%), United States (8.0%), and France (7.8%) through 2036.
| Country | CAGR |
|---|---|
| India | 9.3% |
| China | 9.0% |
| South Korea | 8.9% |
| United States | 8.0% |
| France | 7.8% |
Source: Future Market Insights analysis.
How do country-level CAGRs compare?
- India (CAGR: 9.3%): India is projected to record a CAGR of 9.3% through 2036 as sunscreen shifts from an occasional product to a wider daily-care item.
- China (CAGR: 9.0%): China is forecast to grow at a CAGR of 9.0% through 2036 as local sunscreen brands combine fast product cycles with tighter registration needs.
- South Korea (CAGR: 8.9%): South Korea is expected to record a CAGR of 8.9% through 2036 as K-beauty sunscreen continues to influence texture, format and export requirements.
- United States (CAGR: 8.0%): The United States is projected to record a CAGR of 8.0% through 2036 as OTC sunscreen rules keep formula performance under close review.
- France (CAGR: 7.8%): France is expected to grow at a CAGR of 7.8% through 2036 as dermocosmetic and premium beauty brands keep sunscreen performance tied to skin-care credibility.
The global Sunscreen Dispersion Additives Market is forecast to record a CAGR of 8.1% from 2026 to 2036. The study covers 30+ countries across the report regions.
How is the Sunscreen Dispersion Additives Market developing in India?
India is projected to record a CAGR of 9.3% through 2036. The country outlook identifies this demand signal: Digital beauty platforms are expanding access to daily SPF products outside premium retail.
Country Market Snapshot
| Country | India |
|---|---|
| Forecast CAGR | 9.3% |
| CAGR signal | India is projected to record a CAGR of 9.3% through 2036. |
| Climate anchor | Heat, UV exposure and urban outdoor use support wider sunscreen awareness. |
| Trade signal | UK trade material noted beauty tariff reductions from 30% to 10% under the UK-India deal. |
| Channel behavior | Digital beauty brands and pharmacies widen access beyond premium counters. |
| Application mix | Affordable lotions, gels and tinted products drive additive cost discipline. |
| Restraint | Price sensitivity limits the use of high-cost pre-dispersed concentrates. |
| Company context | Companies active in or serving this market include BASF India, Croda India, Evonik India, Clariant India, and Galaxy Surfactants. |
Market Outlook
India is projected to record a CAGR of 9.3% through 2036 as sunscreen shifts from an occasional product to a wider daily-care item. Buyers need additives that work in hot storage conditions and support low-cost formulations. Digital-first brands are pushing more SPF products into mass awareness, but pricing pressure remains high. The market is most attractive where additives reduce failure risk without making formulas expensive.
Key Growth Drivers
- Digital beauty platforms are expanding access to daily SPF products outside premium retail.
- Hot climate conditions raise the need for stable viscosity and filter suspension.
- Contract manufacturers need additive systems that perform across affordable sunscreen lines.
- Affordable lotions, gels and tinted products drive additive cost discipline.
Key Restraints
- Low unit prices restrict adoption of expensive pre-dispersed concentrates.
- Regional climate variation can complicate packaging, storage and stability testing.
- Price sensitivity limits the use of high-cost pre-dispersed concentrates.
Country Market FAQs
What should C-suite teams prioritize in India?
C-suite teams should prioritize qualification requirements, procurement routes, local service coverage, and implementation economics before committing capital or supplier volume.
How should suppliers approach the India market?
Suppliers should align technical evidence, local channel support, and account-specific commercial terms with the buying process used by major customers in India.
What can weaken the business case in India?
Price sensitivity limits the use of high-cost pre-dispersed concentrates. Executives should test this exposure during supplier, investment, and rollout reviews.
How is the Sunscreen Dispersion Additives Market developing in China?
China is projected to record a CAGR of 9.0% through 2036. The country outlook identifies this demand signal: Special-cosmetic registration pushes brands toward documented additive systems.
Country Market Snapshot
| Country | China |
|---|---|
| Forecast CAGR | 9.0% |
| Regulatory route | Sunscreens are treated as special cosmetics and need registration before sale. |
| Policy signal | China’s regulator advanced cosmetics regulation reform guidance in December 2025. |
| Company context | Companies active in or serving this market include BASF, Evonik, Clariant, Croda, and dsm-firmenich. |
| Local R&D | Evonik partnered with Kolmar Cosmetics Wuxi in October 2024 for beauty innovation. |
| Channel behavior | Livestream and online retail shorten product refresh cycles for sunscreen brands. |
| Restraint | Registration timelines and local testing can slow new additive use. |
| Executive implication | Executive teams should compare qualification requirements, local service depth, and total implementation economics before selecting suppliers. |
Market Outlook
China is forecast to grow at a CAGR of 9.0% through 2036 as local sunscreen brands combine fast product cycles with tighter registration needs. Buyers need additive systems that can support claims, sensory feel and compliant dossiers. Mineral and hybrid formulas are gaining attention as brands try to balance protection, skin-care feel and environmental positioning. China’s market is shaped by special-cosmetic registration and rapid brand competition.
Key Growth Drivers
- Special-cosmetic registration pushes brands toward documented additive systems.
- Local sunscreen brands need faster lab support for digital-first launch cycles.
- Ocean-friendly and low-whitening claims increase interest in mineral dispersion packages.
- China combines strict sunscreen registration with fast beauty commerce, making speed and documentation equally important for additive suppliers.
Key Restraints
- Registration timelines can delay reformulated sunscreen launches.
- Price competition among local brands limits the use of costly specialty additives.
- Registration timelines and local testing can slow new additive use.
Country Market FAQs
What should C-suite teams prioritize in China?
C-suite teams should prioritize qualification requirements, procurement routes, local service coverage, and implementation economics before committing capital or supplier volume.
How should suppliers approach the China market?
Suppliers should align technical evidence, local channel support, and account-specific commercial terms with the buying process used by major customers in China.
What can weaken the business case in China?
Registration timelines and local testing can slow new additive use. Executives should test this exposure during supplier, investment, and rollout reviews.
How is the Sunscreen Dispersion Additives Market developing in South Korea?
South Korea is projected to record a CAGR of 8.9% through 2036. The country outlook identifies this demand signal: K-beauty export cycles support demand for fast technical support and ready dispersion systems.
Country Market Snapshot
| Country | South Korea |
|---|---|
| Forecast CAGR | 8.9% |
| Regulatory anchor | Functional cosmetics require safety and efficacy evaluation or reporting under the MFDS framework. |
| Export signal | K-beauty ranked as the established SME export item through first half 2025. |
| Format mix | Lightweight sunscreen, tone-up products and hybrid SPF formats shape additive use. |
| Channel behavior | OEM and ODM development cycles are short and launch-driven. |
| Application anchor | Daily facial sunscreen overlaps with make-up primer and skin-care use. |
| Restraint | SPF trust issues make brands cautious about unproven formula changes. |
| Company context | Companies active in or serving this market include Sunjin Beauty Science, KCI, BASF Korea, Evonik Korea, and Croda Korea. |
Market Outlook
South Korea is expected to record a CAGR of 8.9% through 2036 as K-beauty sunscreen continues to influence texture, format and export requirements. Formulators need additives that support clear feel, tone-up effects and stable hybrid systems. The market moves quickly, but suppliers must provide documentation that supports functional cosmetic review. The country is commercially relevant because beauty exports shape formulation ambition. South Korea’s SME ministry described K-beauty as the selected SME export item from 2023 through the first half of 2025.
Key Growth Drivers
- K-beauty export cycles support demand for fast technical support and ready dispersion systems.
- Tone-up sunscreen formats need additive systems that manage pigments and UV filters together.
- Functional cosmetic rules raise the value of documented safety and performance support.
- South Korea is the speed-and-texture market, with OEM and ODM activity turning sunscreen additive choices into fast launch decisions.
Key Restraints
- Public concern over SPF accuracy makes brands careful with new formulation packages.
- Fast retail cycles can compress testing time and strain supplier support teams.
- SPF trust issues make brands cautious about unproven formula changes.
Country Market FAQs
What should C-suite teams prioritize in South Korea?
C-suite teams should prioritize qualification requirements, procurement routes, local service coverage, and implementation economics before committing capital or supplier volume.
How should suppliers approach the South Korea market?
Suppliers should align technical evidence, local channel support, and account-specific commercial terms with the buying process used by major customers in South Korea.
What can weaken the business case in South Korea?
SPF trust issues make brands cautious about unproven formula changes. Executives should test this exposure during supplier, investment, and rollout reviews.
How is the Sunscreen Dispersion Additives Market developing in the United States?
The United States is projected to record a CAGR of 8.0% through 2036. The country outlook identifies this demand signal: OTC sunscreen compliance keeps formulators focused on stable additives with strong documentation.
Country Market Snapshot
| Country | United States |
|---|---|
| Forecast CAGR | 8.0% |
| Regulatory anchor | Sunscreens are regulated as OTC drugs, so formula changes carry testing and compliance consequences. |
| Filter signal | FDA’s 2026 bemotrizinol action renewed interest in modern UV filter systems. |
| Mineral use | Zinc oxide and titanium dioxide concentration limits support continued mineral formulation work. |
| Channel behavior | Indie brands often use contract manufacturers for SPF formula development and validation. |
| Application mix | Mineral creams, lotions and tinted daily SPF products support additive demand. |
| Restraint | Testing cost makes brands cautious when switching dispersants or emulsifiers. |
| Company context | Companies active in or serving this market include BASF, Croda, Dow, Ashland, and Lubrizol. |
Market Outlook
The United States is projected to record a CAGR of 8.0% through 2036 as OTC sunscreen rules keep formula performance under close review. Buyers treat dispersion additives as part of claim reliability because sunscreen failures can trigger reformulation delays and retail risk. Mineral and hybrid formats are especially important in facial SPF, children’s products and sensitive-skin ranges. USA demand is notable where additives reduce white cast, improve spread and keep filters stable through storage.
Key Growth Drivers
- OTC sunscreen compliance keeps formulators focused on stable additives with strong documentation.
- Mineral facial SPF demand favors dispersants that improve texture and reduce whitening.
- Contract manufacturers need additives that shorten trial cycles and reduce failed SPF tests.
- Mineral creams, lotions and tinted daily SPF products support additive demand.
Key Restraints
- Reformulation costs stay high when any additive change affects claim testing.
- Spray and powder sunscreen formats face added scrutiny around exposure and delivery behavior.
- Testing cost makes brands cautious when switching dispersants or emulsifiers.
Country Market FAQs
What should C-suite teams prioritize in the United States?
C-suite teams should prioritize qualification requirements, procurement routes, local service coverage, and implementation economics before committing capital or supplier volume.
How should suppliers approach the United States market?
Suppliers should align technical evidence, local channel support, and account-specific commercial terms with the buying process used by major customers in the United States.
What can weaken the business case in the United States?
Testing cost makes brands cautious when switching dispersants or emulsifiers. Executives should test this exposure during supplier, investment, and rollout reviews.
How is the Sunscreen Dispersion Additives Market developing in France?
France is projected to record a CAGR of 7.8% through 2036. The country outlook identifies this demand signal: Pharmacy dermocosmetic channels favor sunscreen products with credible feel and tested claims.
Country Market Snapshot
| Country | France |
|---|---|
| Forecast CAGR | 7.8% |
| Beauty anchor | France was valued at €14.5 billion in European beauty retail sales in 2025. |
| Export role | France is a major cosmetics exporter within Europe’s €29.8 billion 2025 export activity. |
| Channel route | Pharmacy and dermocosmetic brands influence sunscreen credibility. |
| Application mix | Premium facial SPF and anti-aging SPF products need elegant dispersion systems. |
| Buyer behavior | French brands often combine active skin-care claims with sunscreen protection. |
| Restraint | Premium positioning raises sensory expectations and validation cost. |
| Company context | Companies active in or serving this market include Seppic, Gattefossé, BASF, Croda, and Clariant. |
Market Outlook
France is expected to grow at a CAGR of 7.8% through 2036 as dermocosmetic and premium beauty brands keep sunscreen performance tied to skin-care credibility. Buyers look for additive systems that support high SPF, elegant feel and stable active compatibility. Mineral and hybrid sunscreens gain attention where brands need both protection and a softer environmental message. France is commercially important because sunscreen formulas often serve export portfolios beyond the local market.
Key Growth Drivers
- Pharmacy dermocosmetic channels favor sunscreen products with credible feel and tested claims.
- Premium facial SPF ranges raise demand for dispersants that reduce visible residue.
- Export-focused development supports additives with strong documentation and broad regulatory fit.
- Premium facial SPF and anti-aging SPF products need elegant dispersion systems.
Key Restraints
- High sensory expectations increase the cost and time of formula approval.
- Environmental screening can narrow the acceptable range of auxiliary ingredients.
- Premium positioning raises sensory expectations and validation cost.
Country Market FAQs
What should C-suite teams prioritize in France?
C-suite teams should prioritize qualification requirements, procurement routes, local service coverage, and implementation economics before committing capital or supplier volume.
How should suppliers approach the France market?
Suppliers should align technical evidence, local channel support, and account-specific commercial terms with the buying process used by major customers in France.
What can weaken the business case in France?
Premium positioning raises sensory expectations and validation cost. Executives should test this exposure during supplier, investment, and rollout reviews.
Which companies are discussed in the Sunscreen Dispersion Additives Market?
The preview discusses BASF, Croda, Evonik, Clariant, and Dow among the companies active in this market.
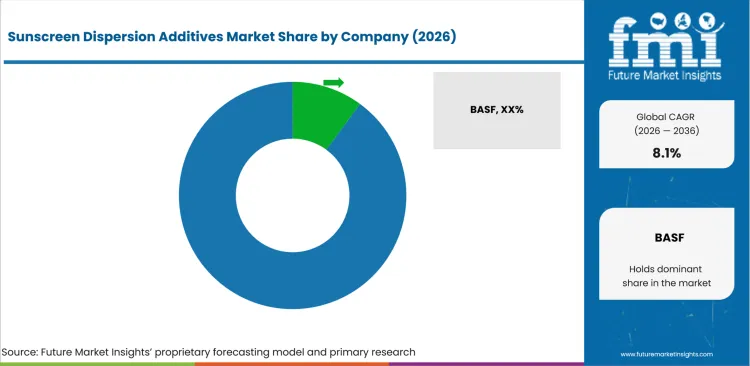
The market is moderately concentrated, with global specialty ingredient suppliers established complex mineral and hybrid sunscreen systems. Smaller suppliers compete with local formulation support, niche dispersants and faster sample delivery for indie brands. Entry barriers are high in premium sunscreen work because additives affect SPF testing, texture and stability.
Distributors hold ground with small formulators when they offer application notes and quick technical access. Established suppliers compete on formulation depth, not only product catalogs. BASF’s April 2025 upgrade of its Sunscreen Simulator shows how digital formulation support is becoming part of ingredient selling.
How is competition structured?
Competition reflects differences in specialization, portfolio scope, geographic reach, evidence, and customer access.
The competitive structure favors suppliers with sunscreen application labs, dispersion chemistry and regional technical support.
- Global Leaders: BASF, Croda and Evonik support through broad sun care portfolios that combine dispersants, emulsifiers, film support and sensory additives. BASF offers mineral UV filter dispersions and sunscreen formulation tools.
- Performance Additive Specialists: Dow, Clariant and Ashland compete through silicone dispersants, rheology modifiers and film-forming systems used in sun care. Dow’s DOWSIL dispersants support inorganic particle loading.
- Regional and Natural-Solution Players: Nouryon and Nikkol Group compete where buyers need biobased film formers, cellulose-based rheology systems or localized inorganic filter dispersants. Nouryon’s SolAmaze Natural and Akucell polymers support high-SPF sunscreen and texture control.
How do selected companies compare?
The selected companies differ in portfolio focus, geographic reach, evidence depth, and channel strength.
| Company | Competitive position |
|---|---|
| BASF | BASF is assessed for formulation or material technology, technical support, qualification evidence, and regional channel reach. |
| Croda | Croda is assessed for formulation or material technology, technical support, qualification evidence, and regional channel reach. |
| Evonik | Evonik is assessed for formulation or material technology, technical support, qualification evidence, and regional channel reach. |
| Clariant | Clariant is assessed for formulation or material technology, technical support, qualification evidence, and regional channel reach. |
| Dow | Dow is assessed for formulation or material technology, technical support, qualification evidence, and regional channel reach. |
What are the key developments in the Sunscreen Dispersion Additives Market?
- In March 2024, BASF supported Meifubao’s ocean-friendly sunscreen launch in China. The development showed stronger supplier-brand collaboration around environmentally screened sunscreen systems.
- In October 2024, Evonik partnered with Kolmar Cosmetics Wuxi for sustainable beauty innovation. The work included sun care and formulation research for China-focused development.
- In April 2025, BASF upgraded its Sunscreen Simulator with new features. The tool supports UV filter blend optimization before formulators move into lab trials.
Selected Companies in the Sunscreen Dispersion Additives Market
Companies referenced in this preview
- BASF.
- Croda.
- Evonik.
- Clariant.
- Dow.
- Ashland.
- Seppic.
- Gattefossé.
Market Scope & Definition
| Metric | Value |
|---|---|
| Market definition | The Sunscreen Dispersion Additives Market covers ingredients that improve the dispersion, stability, texture and application of sunscreen UV filter systems. Included products cover wetting agents, dispersants, rheology modifiers, emulsifiers, stabilizers and related performance additives used in finished sunscreen formulas. |
| Functions covered | Wetting & Dispersing Agents, Rheology Modifiers, Emulsifiers, Stabilizers / Other |
| Applications covered | Creams & Lotions, Sprays, Sticks / Solids, Tinted Sunscreens |
| End-use industries | Creams & Lotions, Sprays, Sticks / Solids, Tinted Sunscreens |
| Inclusions | Market scope covers additive types including Wetting & Dispersing Agents, Rheology Modifiers, Emulsifiers and Stabilizers / Other; UV filter compatibility covering Mineral UV Filters, Organic UV Filters and Hybrid Systems; applications covering Creams & Lotions, Sprays, Sticks / Solids and Tinted Sunscreens; forms covering. |
| Exclusions | The market excludes standalone sunscreen actives, finished sunscreen retail sales, contract manufacturing revenue, cosmetic packaging, medical photoprotection devices and general skin-care additives without sunscreen dispersion use. |
Research Methodology
| Metric | Value |
|---|---|
| Primary Research | FMI analysts reviewed input from personal care ingredient suppliers, sunscreen formulators, contract manufacturers and distributor teams handling formulation additives. Interviews focused on additive selection, validation hurdles, channel buying and reformulation costs. |
| Desk Research | covered regulatory classifications, sunscreen monograph references, UV filter rules, company product portfolios and official beauty industry statistics. The work also reviewed supplier information for dispersion polymers, mineral filter dispersions and sun care emulsifier systems. |
| Market Sizing and Forecasting | The model combined finished sunscreen formulation activity, additive use rates, average ingredient pricing and country-level channel differences. Segment forecasts were adjusted for mineral filter intensity, hybrid sunscreen complexity and direct technical selling. |
| Data Validation | Forecasts were checked against regulatory shifts, regional beauty market activity and supplier portfolios. Company relevance was cross-checked only where public evidence connected the supplier to sunscreen formulation additives. |
What does the report cover?
The report covers additive type, UV filter compatibility, application, form, sales channel, and region across the 2026-2036 forecast period in 30+ countries.
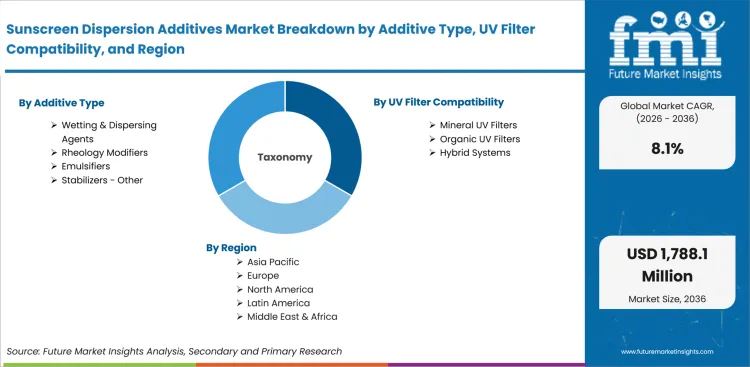
| Metric | Value |
|---|---|
| Periods | Base year 2025; estimated year 2026; forecast period 2026-2036 |
| Segment axes | additive type, UV filter compatibility, application, form, sales channel, and region |
| Regions | North America, Latin America, Europe, East Asia, South Asia and Pacific, Middle East and Africa |
| Countries | United States, United Kingdom, Germany, France, Japan, China, South Korea, India and 30+ countries |
| Companies | BASF, Croda, Evonik, Clariant, Dow, Ashland, Seppic, Gattefossé, and others |
| Approach | Hybrid bottom-up and top-down methodology using formulation activity, additive use rates, pricing and country-level channel differences. |
Market Segmentation Analysis
Segmented by Additive Type
- Wetting & Dispersing Agents.
- Rheology Modifiers.
- Emulsifiers.
- Stabilizers / Other.
Segmented by UV Filter Compatibility
- Mineral UV Filters.
- Organic UV Filters.
- Hybrid Systems.
Segmented by Application
- Creams & Lotions.
- Sprays.
- Sticks / Solids.
- Tinted Sunscreens.
Segmented by Form
- Liquid.
- Powder.
- Pre-dispersed Concentrates.
Segmented by Sales Channel
- Direct to Formulators.
- Distributors.
By Region
- North America.
- United States.
- Canada.
- Mexico.
- Latin America.
- Brazil.
- Chile.
- Rest of Latin America.
- Western Europe.
- Germany.
- UK.
- Italy.
- Spain.
- United Kingdom.
- France.
- Nordic.
- BENELUX.
- Rest of Western Europe.
- Eastern Europe.
- Russia.
- Poland.
- Hungary.
- Balkan & Baltic.
- Rest of Eastern Europe.
- East Asia.
- China.
- Japan.
- South Korea.
- South Asia and Pacific.
- India.
- ASEAN.
- Australia & New Zealand.
- Rest of South Asia and Pacific.
- Middle East & Africa.
- Kingdom of Saudi Arabia.
- Other GCC Countries.
- Turkiye.
- South Africa.
- Other African Union.
- Rest of Middle East & Africa.
Research Sources and Bibliography
- USA Food and Drug Administration. (2026, June 9). FDA expands sunscreen options for the first time in 20 years.
- Electronic Code of Federal Regulations. (2026). 21 CFR Part 352: Sunscreen drug products for over-the-counter human use.
- European Commission. (2026). Sunscreen products.
- European Commission. (2026). Legislation: Cosmetics.
- Cosmetics Europe. (2026). Our industry.
- Department for Business and Trade. (2025, December 1). Major British beauty brands set to showcase at Cosmoprof India 2025.
- German Cosmetic, Toiletry, Perfumery and Detergent Association. (2025). Annual report 2024/2025.
- National Medical Products Administration. (2025, December 22). NMPA’s opinions on deepening the reform of cosmetics regulation and promoting the high-quality development of the industry.
- Ministry of SMEs and Startups. (2025, December 1). K-beauty ranked No.1 export item among SME products.
- Ministry of Food and Drug Safety. (2026). Cosmetics.
- Japan Cosmetic Industry Association. (2026). Statistics.
- BASF. (2024, March 4). BASF backs launch of Eco-friendly Sun Care Product for Meifubao, a Uni-Asia Group Brand.
- BASF. (2025, April 7). BASF upgrades its Sunscreen Simulator with new features.
- BASF. (2025, October 7). BASF showcases inspiring textures and new cosmetic ingredients at SEPAWA Congress 2025.
- BASF. (2026, April 7). In-cosmetics Global 2026: BASF champions authenticity and emotional well-being.
- Croda International Plc. (2025, November 3). Effective SPF boosting for high performance sun care.
The bibliography is provided for reader reference and uses primary regulatory, government, trade body or official company publications.
This Report Answers
- What is the projected value of the Sunscreen Dispersion Additives Market in 2026?
- What value is forecast for the Sunscreen Dispersion Additives Market by 2036?
- What CAGR is forecast for the Sunscreen Dispersion Additives Market from 2026 to 2036?
- What 2026 share is projected for Wetting & Dispersing Agents within the additive type category?
- What 2026 share is projected for Mineral UV Filters within the UV filter compatibility category?
- Which demand factors support the Sunscreen Dispersion Additives Market outlook?
- Which restraints and opportunities affect adoption in the Sunscreen Dispersion Additives Market?
- How are country CAGR outlooks, including India at 9.3%, compared?
- Which companies and product developments are covered in the competitive analysis?
- What is included in the market scope, and how is the forecast validated?
Frequently Asked Questions
Why should executives track the Sunscreen Dispersion Additives Market?
Executives should track this market because it can affect capital allocation, supplier strategy, operating risk, and competitive positioning across commercial planning cycles.
What business problem does the Sunscreen Dispersion Additives Market address?
It helps executive teams judge where customer pain, supplier capability, compliance exposure, and implementation economics justify investment, procurement, or portfolio action.
What should procurement leaders evaluate before selecting suppliers?
Procurement leaders should assess evidence quality, integration fit, service coverage, compliance readiness, total cost of ownership, and supplier execution capability.
What can limit return on investment for buyers?
Return on investment can be limited by low utilization, integration delays, training gaps, unclear ownership, pricing pressure, or weak fit with existing workflows.
How can suppliers build executive confidence?
Suppliers can build confidence by proving implementation speed, risk reduction, support depth, reference use cases, and measurable outcomes for budget owners.
Preview the report firsthand - request a free sample
Get SampleGet the brochure for pricing and purchase details.
Get PDFTable of Content
- Key Takeaways
- Market Size and CAGR
- Top Growth Driver
- Fastest Growing Segment
- Leading Region
- Key Companies
- Emerging Opportunities
- Executive Summary
- Global Market Outlook
- Demand-side Trends
- Supply-side Trends
- Technology Roadmap Analysis
- Analysis and Recommendations
- Analyst Perspective (What is happening? Why now? What should investors know?)
- Key Questions Answered
- How large is the market?
- What is the CAGR?
- What are key trends?
- Which region dominates?
- Who are the leaders?
- Market Overview
- Market Coverage / Taxonomy
- Market Definition / Scope / Limitations
- Research Methodology
- Chapter Orientation
- Analytical Lens and Working Hypotheses
- Market Structure, Signals, and Trend Drivers
- Benchmarking and Cross-market Comparability
- Market Sizing, Forecasting, and Opportunity Mapping
- Research Design and Evidence Framework
- Desk Research Programme (Secondary Evidence)
- Expert Input and Fieldwork (Primary Evidence)
- Tooling, Models, and Reference Databases
- Data Engineering and Model Build
- Quality Assurance and Audit Trail
- Market Background
- Market Dynamics (Drivers, Restraints, Opportunity, Trends)
- Scenario Forecast (Optimistic, Likely, Conservative)
- Impact Analysis
- AI Impact
- Sustainability Impact
- Regulatory Impact
- Technology Impact
- Consumer / Buyer Analysis
- Purchase Drivers
- Adoption Barriers
- Buyer Journey
- Opportunity Map Analysis
- Product Life Cycle Analysis
- Supply Chain Analysis
- Investment Feasibility Matrix
- Value Chain Analysis
- PESTLE and Porter's Analysis
- Regulatory Landscape
- Regional Parent Market Outlook
- Production and Consumption Statistics
- Import and Export Statistics
- Global Market Analysis and Forecast, 2021 to 2036
- Historical Market Size Value (USD Million) & Volume (Unit) Analysis, 2021 to 2025
- Current and Future Market Size Value (USD Million) & Volume (Unit) Projections, 2026 to 2036
- Y-o-Y Growth Trend Analysis
- Absolute $ Opportunity Analysis
- Global Market Pricing Analysis, 2021 to 2036
- Global Market Analysis and Forecast, By Additive Type, 2021 to 2036
- Introduction / Key Findings
- Historical Market Size Value (USD Million) & Volume (Unit) Analysis By Additive Type, 2021 to 2025
- Current and Future Market Size Value (USD Million) & Volume (Unit) Analysis and Forecast By Additive Type, 2026 to 2036
- Wetting & Dispersing Agents
- Rheology Modifiers
- Emulsifiers
- Stabilizers - Other
- Wetting & Dispersing Agents
- Y-o-Y Growth Trend Analysis By Additive Type, 2021 to 2025
- Absolute $ Opportunity Analysis By Additive Type, 2026 to 2036
- Global Market Analysis and Forecast, By UV Filter Compatibility, 2021 to 2036
- Introduction / Key Findings
- Historical Market Size Value (USD Million) & Volume (Unit) Analysis By UV Filter Compatibility, 2021 to 2025
- Current and Future Market Size Value (USD Million) & Volume (Unit) Analysis and Forecast By UV Filter Compatibility, 2026 to 2036
- Mineral UV Filters
- Organic UV Filters
- Hybrid Systems
- Mineral UV Filters
- Y-o-Y Growth Trend Analysis By UV Filter Compatibility, 2021 to 2025
- Absolute $ Opportunity Analysis By UV Filter Compatibility, 2026 to 2036
- Global Market Analysis and Forecast, By Application, 2021 to 2036
- Introduction / Key Findings
- Historical Market Size Value (USD Million) & Volume (Unit) Analysis By Application, 2021 to 2025
- Current and Future Market Size Value (USD Million) & Volume (Unit) Analysis and Forecast By Application, 2026 to 2036
- Creams & Lotions
- Sprays
- Sticks - Solids
- Tinted Sunscreens
- Creams & Lotions
- Y-o-Y Growth Trend Analysis By Application, 2021 to 2025
- Absolute $ Opportunity Analysis By Application, 2026 to 2036
- Global Market Analysis and Forecast, By Form, 2021 to 2036
- Introduction / Key Findings
- Historical Market Size Value (USD Million) & Volume (Unit) Analysis By Form, 2021 to 2025
- Current and Future Market Size Value (USD Million) & Volume (Unit) Analysis and Forecast By Form, 2026 to 2036
- Liquid
- Powder
- Pre-dispersed Concentrates
- Liquid
- Y-o-Y Growth Trend Analysis By Form, 2021 to 2025
- Absolute $ Opportunity Analysis By Form, 2026 to 2036
- Global Market Analysis and Forecast, By Sales Channel, 2021 to 2036
- Introduction / Key Findings
- Historical Market Size Value (USD Million) & Volume (Unit) Analysis By Sales Channel, 2021 to 2025
- Current and Future Market Size Value (USD Million) & Volume (Unit) Analysis and Forecast By Sales Channel, 2026 to 2036
- Direct to Formulators
- Distributors
- Direct to Formulators
- Y-o-Y Growth Trend Analysis By Sales Channel, 2021 to 2025
- Absolute $ Opportunity Analysis By Sales Channel, 2026 to 2036
- Global Market Analysis and Forecast, By Region, 2021 to 2036
- Introduction
- Historical Market Size Value (USD Million) & Volume (Unit) Analysis By Region, 2021 to 2025
- Current Market Size Value (USD Million) & Volume (Unit) Analysis and Forecast By Region, 2026 to 2036
- North America
- Latin America
- Western Europe
- Eastern Europe
- East Asia
- South Asia and Pacific
- Middle East & Africa
- Market Attractiveness Analysis By Region
- North America Market Analysis and Forecast, By Country, 2021 to 2036
- Historical Market Size Value (USD Million) & Volume (Unit) Trend Analysis By Market Taxonomy, 2021 to 2025
- Market Size Value (USD Million) & Volume (Unit) Forecast By Market Taxonomy, 2026 to 2036
- By Country
- USA
- Canada
- Mexico
- By Additive Type
- By UV Filter Compatibility
- By Application
- By Form
- By Sales Channel
- By Country
- Market Attractiveness Analysis
- By Country
- By Additive Type
- By UV Filter Compatibility
- By Application
- By Form
- By Sales Channel
- Key Takeaways
- Latin America Market Analysis and Forecast, By Country
- Historical Market Size Value (USD Million) & Volume (Unit) Trend Analysis By Market Taxonomy, 2021 to 2025
- Market Size Value (USD Million) & Volume (Unit) Forecast By Market Taxonomy, 2026 to 2036
- By Country
- Brazil
- Chile
- Rest of Latin America
- By Additive Type
- By UV Filter Compatibility
- By Application
- By Form
- By Sales Channel
- By Country
- Market Attractiveness Analysis
- By Country
- By Additive Type
- By UV Filter Compatibility
- By Application
- By Form
- By Sales Channel
- Key Takeaways
- Western Europe Market Analysis and Forecast, By Country
- Historical Market Size Value (USD Million) & Volume (Unit) Trend Analysis By Market Taxonomy, 2021 to 2025
- Market Size Value (USD Million) & Volume (Unit) Forecast By Market Taxonomy, 2026 to 2036
- By Country
- Germany
- UK
- Italy
- Spain
- France
- Nordic
- BENELUX
- Rest of Western Europe
- By Additive Type
- By UV Filter Compatibility
- By Application
- By Form
- By Sales Channel
- By Country
- Market Attractiveness Analysis
- By Country
- By Additive Type
- By UV Filter Compatibility
- By Application
- By Form
- By Sales Channel
- Key Takeaways
- Eastern Europe Market Analysis and Forecast, By Country
- Historical Market Size Value (USD Million) & Volume (Unit) Trend Analysis By Market Taxonomy, 2021 to 2025
- Market Size Value (USD Million) & Volume (Unit) Forecast By Market Taxonomy, 2026 to 2036
- By Country
- Russia
- Poland
- Hungary
- Balkan & Baltic
- Rest of Eastern Europe
- By Additive Type
- By UV Filter Compatibility
- By Application
- By Form
- By Sales Channel
- By Country
- Market Attractiveness Analysis
- By Country
- By Additive Type
- By UV Filter Compatibility
- By Application
- By Form
- By Sales Channel
- Key Takeaways
- East Asia Market Analysis and Forecast, By Country
- Historical Market Size Value (USD Million) & Volume (Unit) Trend Analysis By Market Taxonomy, 2021 to 2025
- Market Size Value (USD Million) & Volume (Unit) Forecast By Market Taxonomy, 2026 to 2036
- By Country
- China
- Japan
- South Korea
- By Additive Type
- By UV Filter Compatibility
- By Application
- By Form
- By Sales Channel
- By Country
- Market Attractiveness Analysis
- By Country
- By Additive Type
- By UV Filter Compatibility
- By Application
- By Form
- By Sales Channel
- Key Takeaways
- South Asia and Pacific Market Analysis and Forecast, By Country
- Historical Market Size Value (USD Million) & Volume (Unit) Trend Analysis By Market Taxonomy, 2021 to 2025
- Market Size Value (USD Million) & Volume (Unit) Forecast By Market Taxonomy, 2026 to 2036
- By Country
- India
- ASEAN
- Australia & New Zealand
- Rest of South Asia and Pacific
- By Additive Type
- By UV Filter Compatibility
- By Application
- By Form
- By Sales Channel
- By Country
- Market Attractiveness Analysis
- By Country
- By Additive Type
- By UV Filter Compatibility
- By Application
- By Form
- By Sales Channel
- Key Takeaways
- Middle East & Africa Market Analysis and Forecast, By Country
- Historical Market Size Value (USD Million) & Volume (Unit) Trend Analysis By Market Taxonomy, 2021 to 2025
- Market Size Value (USD Million) & Volume (Unit) Forecast By Market Taxonomy, 2026 to 2036
- By Country
- Kingdom of Saudi Arabia
- Other GCC Countries
- Türkiye
- South Africa
- Other African Union
- Rest of Middle East & Africa
- By Additive Type
- By UV Filter Compatibility
- By Application
- By Form
- By Sales Channel
- By Country
- Market Attractiveness Analysis
- By Country
- By Additive Type
- By UV Filter Compatibility
- By Application
- By Form
- By Sales Channel
- Key Takeaways
- Key Countries Market Analysis
- USA
- Pricing Analysis
- Market Share Analysis, 2025
- By Additive Type
- By UV Filter Compatibility
- By Application
- By Form
- By Sales Channel
- Canada
- Pricing Analysis
- Market Share Analysis, 2025
- By Additive Type
- By UV Filter Compatibility
- By Application
- By Form
- By Sales Channel
- Mexico
- Pricing Analysis
- Market Share Analysis, 2025
- By Additive Type
- By UV Filter Compatibility
- By Application
- By Form
- By Sales Channel
- Brazil
- Pricing Analysis
- Market Share Analysis, 2025
- By Additive Type
- By UV Filter Compatibility
- By Application
- By Form
- By Sales Channel
- Chile
- Pricing Analysis
- Market Share Analysis, 2025
- By Additive Type
- By UV Filter Compatibility
- By Application
- By Form
- By Sales Channel
- Germany
- Pricing Analysis
- Market Share Analysis, 2025
- By Additive Type
- By UV Filter Compatibility
- By Application
- By Form
- By Sales Channel
- UK
- Pricing Analysis
- Market Share Analysis, 2025
- By Additive Type
- By UV Filter Compatibility
- By Application
- By Form
- By Sales Channel
- Italy
- Pricing Analysis
- Market Share Analysis, 2025
- By Additive Type
- By UV Filter Compatibility
- By Application
- By Form
- By Sales Channel
- Spain
- Pricing Analysis
- Market Share Analysis, 2025
- By Additive Type
- By UV Filter Compatibility
- By Application
- By Form
- By Sales Channel
- France
- Pricing Analysis
- Market Share Analysis, 2025
- By Additive Type
- By UV Filter Compatibility
- By Application
- By Form
- By Sales Channel
- India
- Pricing Analysis
- Market Share Analysis, 2025
- By Additive Type
- By UV Filter Compatibility
- By Application
- By Form
- By Sales Channel
- ASEAN
- Pricing Analysis
- Market Share Analysis, 2025
- By Additive Type
- By UV Filter Compatibility
- By Application
- By Form
- By Sales Channel
- Australia & New Zealand
- Pricing Analysis
- Market Share Analysis, 2025
- By Additive Type
- By UV Filter Compatibility
- By Application
- By Form
- By Sales Channel
- China
- Pricing Analysis
- Market Share Analysis, 2025
- By Additive Type
- By UV Filter Compatibility
- By Application
- By Form
- By Sales Channel
- Japan
- Pricing Analysis
- Market Share Analysis, 2025
- By Additive Type
- By UV Filter Compatibility
- By Application
- By Form
- By Sales Channel
- South Korea
- Pricing Analysis
- Market Share Analysis, 2025
- By Additive Type
- By UV Filter Compatibility
- By Application
- By Form
- By Sales Channel
- Russia
- Pricing Analysis
- Market Share Analysis, 2025
- By Additive Type
- By UV Filter Compatibility
- By Application
- By Form
- By Sales Channel
- Poland
- Pricing Analysis
- Market Share Analysis, 2025
- By Additive Type
- By UV Filter Compatibility
- By Application
- By Form
- By Sales Channel
- Hungary
- Pricing Analysis
- Market Share Analysis, 2025
- By Additive Type
- By UV Filter Compatibility
- By Application
- By Form
- By Sales Channel
- Kingdom of Saudi Arabia
- Pricing Analysis
- Market Share Analysis, 2025
- By Additive Type
- By UV Filter Compatibility
- By Application
- By Form
- By Sales Channel
- Türkiye
- Pricing Analysis
- Market Share Analysis, 2025
- By Additive Type
- By UV Filter Compatibility
- By Application
- By Form
- By Sales Channel
- South Africa
- Pricing Analysis
- Market Share Analysis, 2025
- By Additive Type
- By UV Filter Compatibility
- By Application
- By Form
- By Sales Channel
- USA
- Market Structure Analysis
- Competition Dashboard
- Competition Benchmarking
- Market Share Analysis of Top Players
- By Regional
- By Additive Type
- By UV Filter Compatibility
- By Application
- By Form
- By Sales Channel
- Emerging Startups
- Innovation Benchmarking
- Competition Analysis
- Competition Deep Dive
- BASF
- Overview
- Product Portfolio
- Profitability by Market Segments (Product/Region/Sales Channel)
- Sales Footprint
- Strategy Overview
- Marketing Strategy
- Product Strategy
- Channel Strategy
- Croda
- Evonik
- Clariant
- Dow
- Ashland
- Seppic
- Gattefossé
- BASF
- Case Studies
- Success Stories
- Recent Developments
- Competition Deep Dive
- Assumptions & Acronyms Used


