The Sweat Pad Market is estimated to be valued at USD 15.7 billion in 2025 and is projected to reach USD 22.3 billion by 2035, registering a compound annual growth rate (CAGR) of 3.6% over the forecast period.
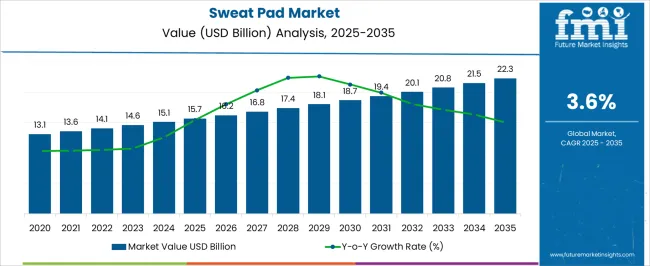
| Metric | Value |
|---|---|
| Sweat Pad Market Estimated Value in (2025 E) | USD 15.7 billion |
| Sweat Pad Market Forecast Value in (2035 F) | USD 22.3 billion |
| Forecast CAGR (2025 to 2035) | 3.6% |
The sweat pad market is expanding steadily, driven by increasing consumer awareness of personal hygiene, convenience, and the need for discreet sweat management solutions. Growing urbanization, rising disposable incomes, and heightened focus on grooming have supported demand across both men and women segments.
Disposable sweat pads are gaining traction as practical and affordable solutions for everyday use, supported by rising penetration of e-commerce channels. Market expansion is further influenced by product innovations, such as skin-friendly adhesives and eco-friendly materials, which improve comfort and reduce irritation.
Awareness campaigns highlighting hygiene benefits are expanding product acceptance across varied demographics. With the influence of lifestyle shifts and rising consumer preference for convenience-oriented hygiene products, the sweat pad market is poised for continuous growth.
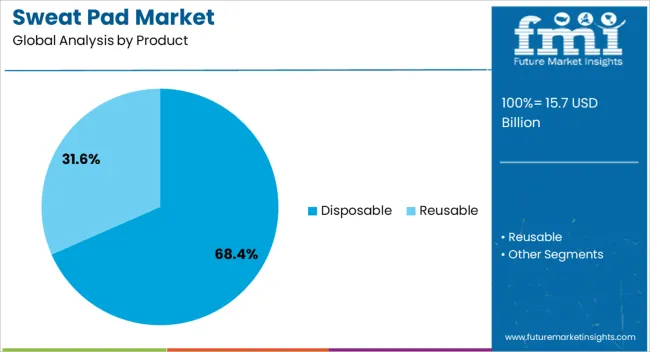
The disposable segment dominates the product category, accounting for approximately 68.40% share of the market. Its leadership is driven by convenience, affordability, and widespread availability, which make disposable sweat pads appealing for regular use.
The segment benefits from strong adoption among working professionals and students seeking on-the-go hygiene solutions. Manufacturing efficiency and scalability further support cost competitiveness, expanding accessibility across regions.
With continued product innovation and rising awareness, the disposable segment is expected to maintain its strong share.
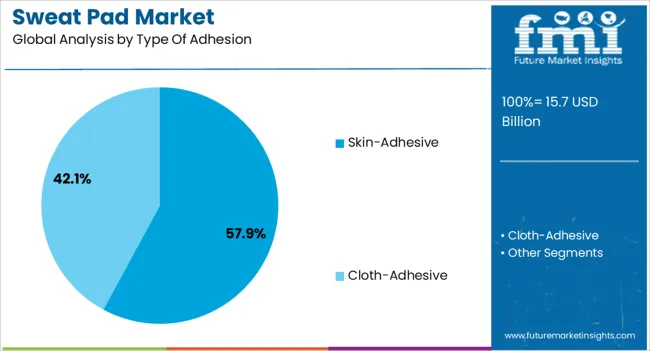
The skin-adhesive segment leads the type of adhesion category with approximately 57.90% share, reflecting strong consumer preference for reliable and comfortable attachment. The segment benefits from innovations in dermatologically tested adhesives that enhance wearability and reduce skin irritation.
Its dominance is reinforced by increasing adoption among consumers engaged in active lifestyles, where secure adhesion is essential. Product developers are focusing on breathable, hypoallergenic materials to expand consumer acceptance.
With rising demand for comfort and effectiveness, the skin-adhesive segment is projected to sustain its leadership.
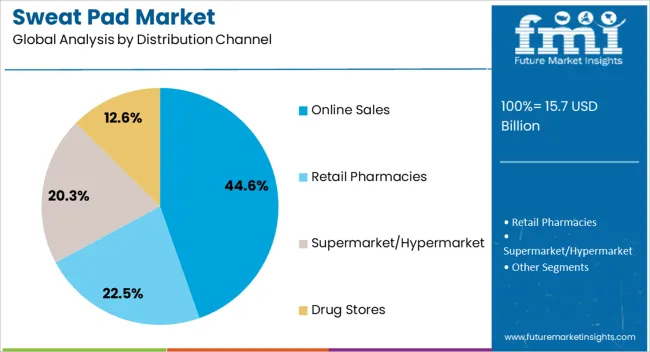
The online sales segment holds approximately 44.60% share of the distribution channel category, driven by the rapid expansion of e-commerce platforms and direct-to-consumer models. Consumers prefer online channels for privacy, convenience, and access to a wider range of product choices.
Promotional campaigns, subscription models, and targeted marketing have further strengthened online sales growth. The segment also benefits from increasing adoption in emerging markets, where digital penetration is accelerating.
With growing comfort in online purchasing of personal care products, the online sales segment is expected to remain the leading distribution channel.
The sweat pads market accounted for around 2.8% of the overall personal hygiene market during the historical period and registered a valuation of USD 13.1 billion in 2020.
The market for sweat pads is increasing due to the prevalence of hyperhidrosis, which causes excessive sweating. Due to this excessive sweating, the patient may feel discomfort. Sweat pads provide relief by absorbing the excessive sweat secreted by the body. These pads work by the mechanism of skin adhesiveness or by cloth adhesiveness.
The health conditions that might cause excessive sweating include acromegaly, neurologic disease, diabetic hypoglycemia, hyperthyroidism (overactive thyroid), lymphoma, malaria, infection, leukemia, menopause, and tuberculosis.
Night sweats are frequently brought on by low blood sugar, which can happen in people using sulfonylureas or insulin. When the blood glucose levels drop too low, adrenaline is overproduced, which leads to sweating.
Over the past few decades, diabetes has been rapidly increasing in both incidence and prevalence. The large patient population who suffer from excessive sweating is expected to have an impact on the market growth for sweat pads in the upcoming years.
The rise in hyperhidrosis conditions boosts the market growth of sweat pads. When there is no underlying medical issue causing excessive sweating, the condition is referred to as primary hyperhidrosis.
In this, excessive perspiration happens without being prompted by a rise in body temperature or physical activity. The disease is secondary hyperhidrosis when an underlying medical problem is the root of excessive sweating.
According to the journal Archives of Dermatology Research published in October 2020, 15.7.3 million people in the United States (about 4.8% of the population) were suffering from hyperhidrosis.
Meanwhile, 70% of them claimed to have significant, excessive perspiration in at least one body part. Despite this, just 51% of people had spoken with a healthcare provider about their issue. Due to this, the use of sweat pads is expected to increase significantly.
Thus, owing to the aforementioned factors, the global sweat pads market recorded a valuation of USD 15.7 billion in 2025.
The demand for sweat pads is being driven by the rise in product awareness and the importance of personal hygiene. The young millennial generation is incorporating personal hygiene practices more frequently to maintain good health. In addition, leading brands are creating flexible product lines to meet the changing demands of important consumer segments.
More and more young consumers are scheduling regular personal care and hygiene routines. Customers select proper personal care practices to avoid allergies and skin problems. To avoid perspiration, odor, and stains, consumers favor reasonably priced goods with a permeable material.
The government and private organizations frequently conduct a wide range of initiatives and campaigns to encourage personal hygiene, particularly in developing countries. For instance, in government hospitals in Delhi and Haryana, the Central Council for Research in Yoga and Naturopathy (CCRYN), an independent institution under the Ministry of AYUSH, built eight yoga outpatient departments, which has increased awareness among the people about health.
Sweating during yoga can lead to discomfort and bad odors, as well as stains on clothes. The use of sweat pads during this type of physical activity can help reduce this type of discomfort; due to this, the market for sweat pads is growing positively.
Sweat pads are used to drain the excessive sweat produced by the body, but sweat pads are not considered a long-term and sustainable solution for sweating. The popularised image of underarm sweat pads only applies to some of them. Using these pads has its drawbacks in contrast to its advantages. For individuals who experience light to moderate levels of sweating, sweat pads are of considerable assistance. Absolute failure occurs when the sweat bar rises too high.
Sweat pads may not be the best choice in a variety of circumstances. The impact of sweat pads on clothing is one of its main drawbacks. Stick-on pads frequently contain a potent adhesive that stays in clothing and could destroy it for a very long time. In the case of loose clothing, sweat pads are ineffective. Sweat absorption is improper if the shirt's underarm is not closed.
Wearing armpit pads also has an adverse effect on the skin. The sticky pads' substance can harm the skin and cause potentially harmful reactions like itchiness, redness, or discomfort. One of the frequent issues with sweat pads is irritation. Sweat pads simply don't work when you sweat a lot.
Excessive sweating causes the pad to be overused, which quickly renders it purposeful. Cumulatively, these factors propose a negative effect on the developmental growth of the sweat pads market.
| Country | Market Insights |
|---|---|
| The United States | 22.7% |
| China | 6.3% |
| Germany | 7.2% |
| India | 4.0% |
| The United Kingdom | 5.7% |
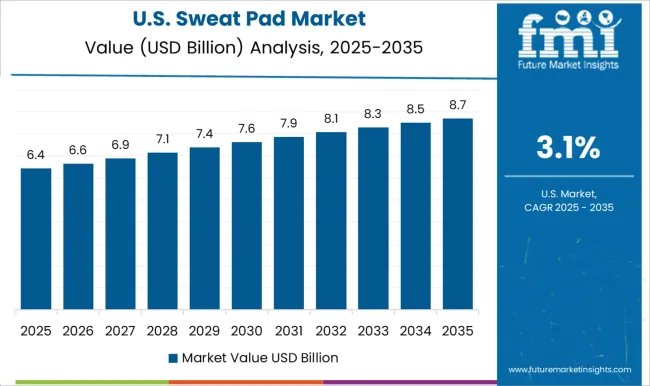
The United States dominated the regional market with a total market share of about 22.7% globally in 2025 and is expected to continue to experience the same growth throughout the forecast period.
As awareness about hyperhidrosis (excessive sweating) and its impact on people's daily lives is growing, more individuals are seeking out solutions to manage their sweating. Sweat pads provide a convenient and affordable option for addressing this issue, leading to increased demand.
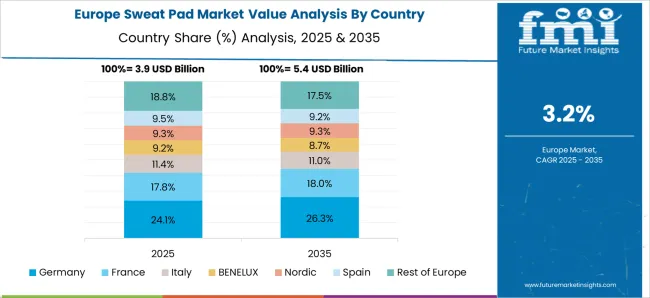
Germany had a significant market share of 6.3% in the global sweat pads market in 2025. The good healthcare infrastructure, along with the increased awareness among the people about hygiene, driving the market growth for sweat pads.
According to the WHO report published in June 2025, Germany is a leading global leader in public health, as seen by its global health strategy and programs, as well as the experience, knowledge, and funding it offers to WHO. Due to this increased awareness about personal hygiene, Germany is showing a lucrative opportunity for the growth of the sweat pads market.
India had a total market share of about 4.0% globally in 2025 and is expected to continue to experience the same growth throughout the forecast period.
With the rise in the case of diabetes, the country is boosting the market growth for sweat pads. According to the study published in the Indian Journal of Ophthalmology in 2024, both internationally and in emerging nations like India, the prevalence of diabetes is high and increasing, primarily as a result of rising rates of overweight/obesity and unhealthy lifestyles.
Over 134 million diabetics are anticipated to exist in India by 2045, up from the present estimate of 77 million. In diabetic patients, excessive sweating occurs. Due to this, the increasing cases of diabetes anticipated the market growth for sweat pads.
Disposable sweat pads had a significant market share, increasing in 2025, with a market share of about 57.8% of the total product segment. Due to the increased personal hygiene among individuals, increasing awareness of such products, and ease and convenience of using and disposing of disposable sweat pads without harming the environment, disposable sweat pads are leading the segment over reusable sweat pads.
Cloth adhesive dominated the global market with a value share of about 56.6% in 2025 out of the total type of adhesion segment. Due to the discomfort and itching of skin-adhesive sweat pads, people prefer cloth-adhesive sweat pads.
Retail pharmacies dominated the market with a market share of 33.2% of the total sweat pads market by the distribution channel, with a CAGR of 3.1% during the forecast period. Due to the ease of availability of sweat pads in retail pharmacies, they are leading the segment.
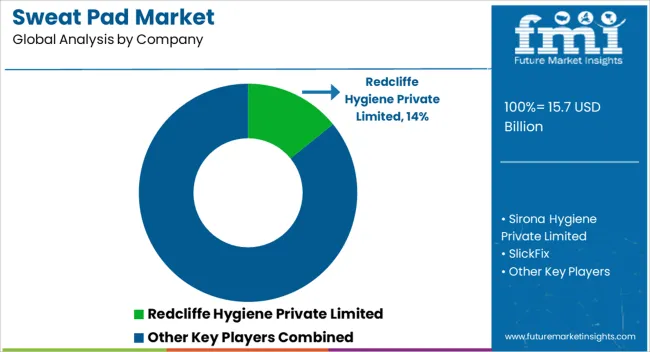
The sweat pads industry is a highly competitive one, which has resulted in a highly fragmented market. The manufacturers are employing strategies including investments, mergers, partnerships, and collaborations to meet consumer demand and grow their client base.
| Attribute | Details |
|---|---|
| Forecast Period | 2025 to 2035 |
| Historical Data Available for | 2020 to 2025 |
| Market Analysis | USD billion for Value |
| Key Regions Covered | North America; Latin America; Europe; South Asia; East Asia; Oceania; MEA |
| Key Countries Covered | The United States, Canada, Brazil, Mexico, Argentina, the United Kingdom, Germany, Italy, Russia, Spain, France, BENELUX, India, Thailand, Indonesia, Malaysia, Japan, China, South Korea, Australia, New Zealand, Türkiye, GCC Countries, North Africa, and South Africa |
| Key Market Segments Covered | Product, Type of Adhesion, Distribution Channel, and Region |
| Key Companies Profiled | Redcliffe Hygiene Private Limited.; Sirona Hygiene Private Limited; SlickFix; Miraigirls Pvt Ltd; Salvepharma; Garment Guard; Geyoga; Dandi London; SweatBlock; Protecht DryPlus |
| Pricing | Available upon Request |
The global sweat pad market is estimated to be valued at USD 15.7 billion in 2025.
The market size for the sweat pad market is projected to reach USD 22.3 billion by 2035.
The sweat pad market is expected to grow at a 3.6% CAGR between 2025 and 2035.
The key product types in sweat pad market are disposable and reusable.
In terms of type of adhesion, skin-adhesive segment to command 57.9% share in the sweat pad market in 2025.


Our Research Products

The "Full Research Suite" delivers actionable market intel, deep dives on markets or technologies, so clients act faster, cut risk, and unlock growth.

The Leaderboard benchmarks and ranks top vendors, classifying them as Established Leaders, Leading Challengers, or Disruptors & Challengers.

Locates where complements amplify value and substitutes erode it, forecasting net impact by horizon

We deliver granular, decision-grade intel: market sizing, 5-year forecasts, pricing, adoption, usage, revenue, and operational KPIs—plus competitor tracking, regulation, and value chains—across 60 countries broadly.

Spot the shifts before they hit your P&L. We track inflection points, adoption curves, pricing moves, and ecosystem plays to show where demand is heading, why it is changing, and what to do next across high-growth markets and disruptive tech

Real-time reads of user behavior. We track shifting priorities, perceptions of today’s and next-gen services, and provider experience, then pace how fast tech moves from trial to adoption, blending buyer, consumer, and channel inputs with social signals (#WhySwitch, #UX).

Partner with our analyst team to build a custom report designed around your business priorities. From analysing market trends to assessing competitors or crafting bespoke datasets, we tailor insights to your needs.
Supplier Intelligence
Discovery & Profiling
Capacity & Footprint
Performance & Risk
Compliance & Governance
Commercial Readiness
Who Supplies Whom
Scorecards & Shortlists
Playbooks & Docs
Category Intelligence
Definition & Scope
Demand & Use Cases
Cost Drivers
Market Structure
Supply Chain Map
Trade & Policy
Operating Norms
Deliverables
Buyer Intelligence
Account Basics
Spend & Scope
Procurement Model
Vendor Requirements
Terms & Policies
Entry Strategy
Pain Points & Triggers
Outputs
Pricing Analysis
Benchmarks
Trends
Should-Cost
Indexation
Landed Cost
Commercial Terms
Deliverables
Brand Analysis
Positioning & Value Prop
Share & Presence
Customer Evidence
Go-to-Market
Digital & Reputation
Compliance & Trust
KPIs & Gaps
Outputs
Full Research Suite comprises of:
Market outlook & trends analysis
Interviews & case studies
Strategic recommendations
Vendor profiles & capabilities analysis
5-year forecasts
8 regions and 60+ country-level data splits
Market segment data splits
12 months of continuous data updates
DELIVERED AS:
PDF EXCEL ONLINE
Sweat Resistant Apparel Market Size and Share Forecast Outlook 2025 to 2035
Padded Mailers Market Size and Share Forecast Outlook 2025 to 2035
Pad Mounted Distribution Transformer Market Size and Share Forecast Outlook 2025 to 2035
Padding Bags Market Size and Share Forecast Outlook 2025 to 2035
Pad Printing Machine Market Insights - Growth & Demand 2025 to 2035
Market Share Insights for Padded Mailers Providers
Padded Divider Market Insights & Trends 2024-2034
Pad Mounted Switchgear Market Growth – Trends & Forecast 2024-2034
Padlock Seals Market
Examining Market Share Trends in the Meat Pads Industry
Brake Pads and Shoes Market Size and Share Forecast Outlook 2025 to 2035
Multi Pad Drilling Market Size and Share Forecast Outlook 2025 to 2035
Global Toner Pads Market Size and Share Forecast Outlook 2025 to 2035
Layer Pads Market from 2025 to 2035
Corner Pads Market Insights - Growth & Demand 2025 to 2035
Tipper Pads Market
Sleeper Pads Market Size and Share Forecast Outlook 2025 to 2035
Acrylic Pad Market Size and Share Forecast Outlook 2025 to 2035
Heating Pad Market
Scouring Pads Market Size and Share Forecast Outlook 2025 to 2035

Thank you!
You will receive an email from our Business Development Manager. Please be sure to check your SPAM/JUNK folder too.
Chat With
MaRIA