

- Market Size (2026)
- USD 110.5 Mn
- Forecast (2036)
- USD 118.6 Mn
- CAGR (2026 to 2036)
- 0.7%
How big is the Telmisartan Market?
The Telmisartan Market is projected to grow from USD 110.5 million in 2026 to USD 118.6 million by 2036, at a CAGR of 0.7%.
The Telmisartan Market was valued at USD 109.7 million in 2025. It is expected to reach USD 110.5 million in 2026 and USD 118.6 million by 2036. The market is projected to expand at a CAGR of 0.7% from 2026 to 2036. Powder is projected to account for a 72.8% share by form in 2026, while ≥99.5% purity grade is expected to represent a 64.3% share.
The World Health Organization reported 1.4 billion adults aged 30 to 79 with hypertension in 2024, while USA prescribing information identifies telmisartan tablets for hypertension and cardiovascular risk reduction in selected patients.
This keeps the API market tied to high-volume generic tablet use instead of new-brand launch cycles.
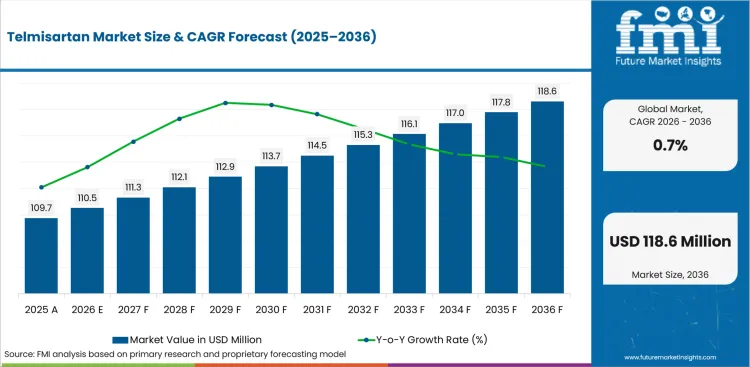
| Metric | Value |
|---|---|
| 2025 Market Size | USD 109.7 million |
| 2026 Market Size | USD 110.5 million |
| 2036 Market Size | USD 118.6 million |
| Forecast CAGR (2026-2036) | 0.7% |
| Leading Form | Powder |
| Powder Share (2026) | 72.8% |
| Leading Purity Grade | ≥99.5% |
| ≥99.5% Share (2026) | 99.5% |
| Fastest-growing Country | India |
| India CAGR by 2036 | 1.2% |
Summary of the Telmisartan Market
| Market Signal | Commercial Impact |
|---|---|
| Demand and Growth Drivers | Demand for Telmisartan API remains stable as pharmaceutical manufacturers continue expanding generic antihypertensive production while prioritizing supply continuity and regulatory compliance.
|
| Product and Segment View | High-purity powder APIs and hypertension treatment applications continue to represent the leading commercial opportunities across the market.
|
| Geography and Growth Outlook | Asia continues to dominate manufacturing and supply through established API production capabilities and expanding regulated pharmaceutical exports.
|
| Competitive Landscape | Competition increasingly focuses on regulatory compliance, manufacturing consistency, API quality, and long-term supply reliability.
|
| Analyst Perspective | Telmisartan API remains a mature generic pharmaceutical market where manufacturing quality, regulatory compliance, and uninterrupted supply are becoming stronger competitive differentiators than pricing alone.
- Anurag Sharma, Principal Consultant at Future Market Insights |
Why is the Telmisartan Market growing?
Chronic hypertension therapy keeps repeat API demand active as telmisartan is used in once-daily oral treatment pathways. Fixed-dose combination approvals support selective volume growth when telmisartan is paired with other blood-pressure medicines.
- Chronic hypertension therapy keeps repeat API demand active as telmisartan is used in once-daily oral treatment pathways.
- Fixed-dose combination approvals support selective volume growth when telmisartan is paired with other blood-pressure medicines.
- Regulated generic buyers prefer documented ARB suppliers as impurity scrutiny raises the cost of weak quality files.
Hypertension treatment creates the core demand floor for telmisartan API. In 2024, the World Health Organization estimated that 1.4 billion adults aged 30 to 79 had hypertension, and about 630 million were diagnosed and treated. That treated pool explains why mature ARB APIs keep moving even after branded exclusivity has passed. Telmisartan benefits from once-daily oral use and from physician familiarity in chronic blood-pressure control. The practical result is a stable API category where suppliers win through continuity, cost control and trusted documentation. Combination therapy creates a smaller but useful demand layer for telmisartan API.
How is the Telmisartan Market segmented?
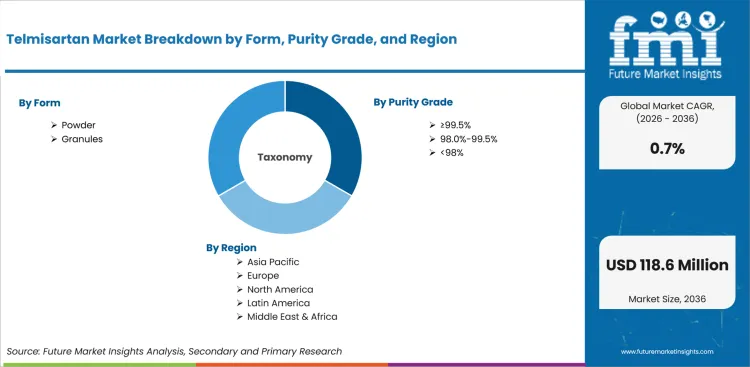
The Telmisartan Market is segmented by form, purity grade, application, sales channel, and region.
- With an estimated 72.8% share in 2026, powder is expected to lead the form category because tablet manufacturers control blend behavior in-house.
- ≥99.5% purity grade is projected to represent a 64.3% share in 2026 with regulated buyers screening impurity profiles closely.
- Hypertension buyers are expected to account for 87.6% of application demand in 2026 given telmisartan’s primary labeled use.
How does Powder contribute to the form category?
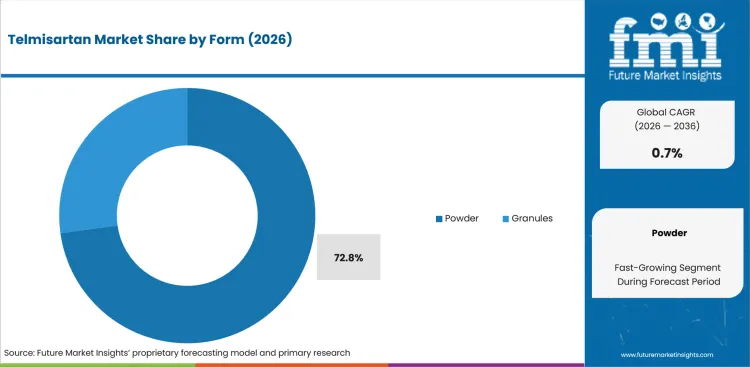
- Powder is projected to account for 72.8% of form demand in 2026 as formulation plants prefer to tune blending and compression inside validated tablet lines.
- Granules serve buyers that want easier flow and lower dust handling, but they can restrict process flexibility for firms with established wet-granulation steps.
What supports demand for ≥99.5%?
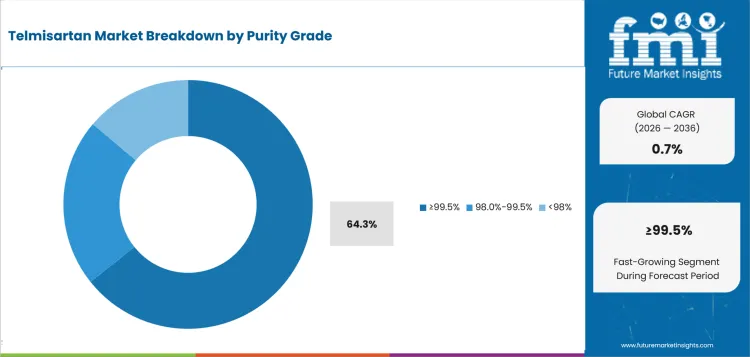
- ≥99.5% purity grade is expected to represent 64.3% of demand in 2026 as regulated buyers place impurity files before price in supplier screening.
- The 98.0%-99.5% tier stays relevant in price-sensitive channels, though buyers usually need stronger incoming testing before commercial release.
How do buyers evaluate Hypertension within the application category?
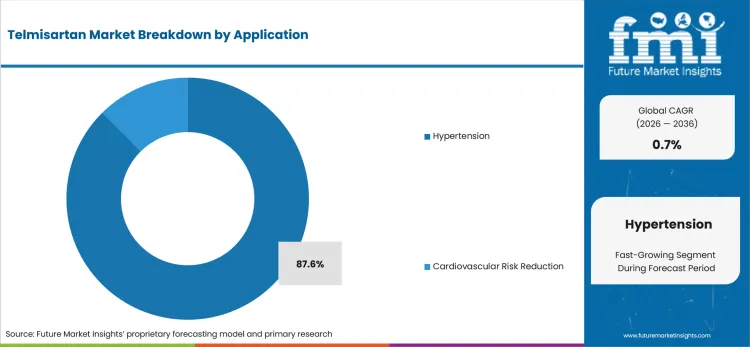
- Hypertension is anticipated to hold 87.6% application share in 2026 as telmisartan’s main label use remains blood-pressure reduction.
- Cardiovascular risk reduction is narrower because prescribing labels tie use to selected patients who cannot take ACE inhibitors.
What market factors influence demand for Direct?
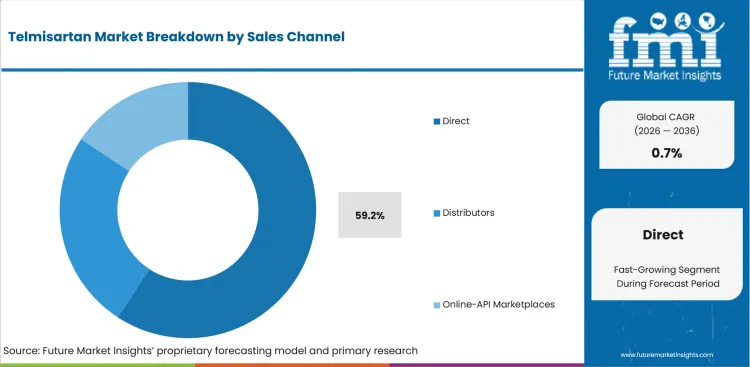
- Direct sales are projected to account for 59.2% of channel demand in 2026 as large formulation buyers prefer audited API contracts.
- Distributors serve smaller formulators and qualification batches, while online API marketplaces are more useful for discovery than routine commercial supply.
How does East Asia affect the regional outlook?
- East Asia is expected to hold 36.8% regional share in 2026 as China combines validated API production with large domestic hypertension need.
- South Asia & Pacific follows with a 29.4% share because India has both generic formulation capacity and a large untreated patient pool.
What drives and restrains the market?
Driver: Once-daily oral ARB use keeps telmisartan in chronic-care formularies and supports repeat API supply; restraint: Multisource generic competition keeps API pricing tight and limits the value gain from volume growth; opportunity: suppliers with strong impurity control can win regulated buyers that want fewer API vendors.
The market reflects a balance between the identified demand driver, adoption constraints, and the supplier opportunity outlined below.
- Driver: Once-daily oral ARB use keeps telmisartan in chronic-care formularies and supports repeat API supply.
- Restraint: Multisource generic competition keeps API pricing tight and limits the value gain from volume growth.
- Opportunity: suppliers with strong impurity control can win regulated buyers that want fewer API vendors.
Once-Daily ARB Pull Telmisartan benefits from a use pattern that suits long-term disease control. Prescribing information describes a usual starting dose of 40 mg once daily, with a dose-related response across 20 mg to 80 mg. That simple dosing structure supports repeat finished-dose production and keeps the API relevant to generic tablet makers. The market mechanism is steady refilling rather than sudden new demand. Suppliers therefore need stable commercial lots, good particle control and predictable documentation. Buyers that serve chronic-care portfolios value fewer supply breaks more than occasional spot-price discounts.
Generic Price Compression: The main restraint is price compression across mature generic antihypertensive medicines. FDA determined in May 2026 that discontinued MICARDIS telmisartan tablets were not withdrawn for safety or effectiveness, and eligible approved ANDAs could stay linked to that reference product history. That keeps the multisource generic structure active. API suppliers cannot rely on scarcity pricing in such a setting. They need process yield, solvent recovery and low batch-failure rates to protect margin. For buyers, a prudent decision is often to keep two qualified suppliers while steering routine volume to the most reliable file holder.
Which factors support expansion?
Commercial expansion is reinforced by the value, workflow, and recurring-demand factors below.
- Value growth is expected to stay modest as telmisartan competes in a mature generic ARB category with high therapeutic familiarity.
- Regulated-market demand supports premium retention for ≥99.5% purity grade, which is projected to hold a 64.3% share in 2026.
- Combination hypertension products create a small value lift when telmisartan is used with amlodipine or diuretic components.
Which country markets are included in the CAGR comparison?
The selected CAGR comparison covers India (1.2%), China (1.0%), South Korea (0.7%), United States (0.6%), and Germany (0.5%) through 2036.
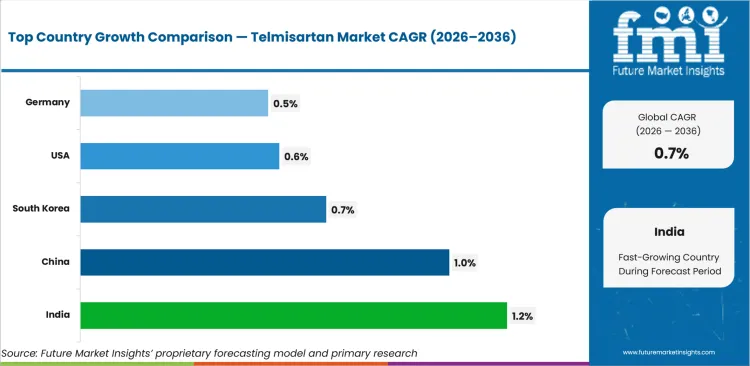
| Country | CAGR |
|---|---|
| India | 1.2% |
| China | 1.0% |
| South Korea | 0.7% |
| United States | 0.6% |
| Germany | 0.5% |
Source: Future Market Insights analysis.
How do country-level CAGRs compare?
- India (CAGR: 1.2%): India combines a large hypertension burden with domestic generic manufacturing depth.
- China (CAGR: 1.0%): China has one of the world’s substantial hypertension patient pools.
- South Korea (CAGR: 0.7%): South Korea has strong treatment awareness and high chronic-care use.
- United States (CAGR: 0.6%): USA hypertension burden keeps chronic antihypertensive prescribing central to generic oral medicine demand.
- Germany (CAGR: 0.5%): Germany has a large treated cardiovascular patient pool within a strict reimbursement system.
The global Telmisartan Market is forecast to record a CAGR of 0.7% from 2026 to 2036. The study covers 30+ countries across the report regions.
How is the Telmisartan Market developing in India?
India is projected to record a CAGR of 1.2% through 2036. The country outlook identifies this demand signal: India combines a large hypertension burden with domestic generic manufacturing depth.
Country Market Snapshot
| Country | India |
|---|---|
| Forecast CAGR | 1.2% |
| Demand anchor | India combines a large hypertension burden with domestic generic manufacturing depth. |
| Local proof point | WHO profiles show 210.2 million Indian adults aged 30 to 79 with hypertension. |
| Supply base | Dr. Reddy’s and Smilax list telmisartan in public API product information. |
| Channel behavior | Domestic formulators buy through direct contracts and API distributor networks. |
| Application mix | Hypertension therapy dominates across branded generic and generic channels. |
| Restraint | Price-sensitive buyers limit margin upside for standard-grade API. |
| Company context | Companies active in or serving this market include Dr. Reddy’s Laboratories, Aurobindo Pharma, Cipla, MSN Laboratories, and Smilax Laboratories. |
Market Outlook
India is the higher-CAGR selected country because demand and supply reinforce each other. WHO profiles show 173.9 million Indian adults aged 30 to 79 with uncontrolled hypertension. This gives domestic formulators a large chronic-care market to serve with affordable oral medicines. API buyers in India also benefit from local supplier depth across Hyderabad, Visakhapatnam, Mumbai and Ahmedabad manufacturing corridors. India is expected to grow at a CAGR of 1.2% through 2036 as domestic generic output and treatment access keep rising.
Key Growth Drivers
- Large uncontrolled hypertension burden supports wider chronic-care treatment and repeat prescription demand.
- Domestic API and formulation clusters reduce supply lead times for local generic makers.
- Branded generic competition keeps telmisartan visible across physician and pharmacy channels.
- India combines a large hypertension burden with domestic generic manufacturing depth.
Key Restraints
- Price-sensitive formulation buyers pressure API margins in standard specifications.
- Smaller buyers may use distributors, which can reduce visibility into end-use demand.
- Price-sensitive buyers limit margin upside for standard-grade API.
India Market FAQs
What should C-suite teams prioritize in India?
C-suite teams should prioritize qualification requirements, procurement routes, local service coverage, and implementation economics before committing capital or supplier volume.
How should suppliers approach the India market?
Suppliers should align technical evidence, local channel support, and account-specific commercial terms with the buying process used by major customers in India.
What can weaken the business case in India?
Price-sensitive buyers limit margin upside for standard-grade API. Executives should test this exposure during supplier, investment, and rollout reviews.
How is the Telmisartan Market developing in China?
China is projected to record a CAGR of 1.0% through 2036. The country outlook identifies this demand signal: China has one of the world’s substantial hypertension patient pools.
Country Market Snapshot
| Country | China |
|---|---|
| Forecast CAGR | 1.0% |
| Demand anchor | China has one of the world’s substantial hypertension patient pools. |
| Local proof point | WHO profiles show 271.5 million Chinese adults aged 30 to 79 with hypertension. |
| Supply base | Zhejiang Huahai lists telmisartan as a validated antihypertensive API. |
| Channel behavior | Domestic bulk procurement keeps finished-dose prices under pressure. |
| Application mix | Hypertension volume dominates, while combination therapy remains selective. |
| Restraint | Price-based competition can compress API margins even when volume is large. |
| Company context | Companies active in or serving this market include Zhejiang Huahai Pharmaceutical, Zhejiang Tianyu Pharmaceutical, Jiangsu Hengrui Pharmaceuticals, CSPC Pharmaceutical, and Qilu Pharmaceutical. |
Market Outlook
China is both a demand center and a supply center for telmisartan API. WHO profiles show 221.4 million Chinese adults aged 30 to 79 with uncontrolled hypertension, which gives the country a large clinical need. At the same time, Chinese API manufacturers influence global pricing and availability. This dual role means buyers watch China for both demand signals and supplier capacity. China is forecast to grow at a CAGR of 1.0% through 2036 due to domestic treatment need and API production strength.
Key Growth Drivers
- Large uncontrolled hypertension burden supports continued oral antihypertensive treatment expansion.
- Domestic API manufacturing capacity supports local and export-oriented supply.
- Centralized generic buying can raise volume for qualified low-cost suppliers.
- China has one of the world’s substantial hypertension patient pools.
Key Restraints
- Bulk procurement pressure can reduce finished-dose prices and API margins.
- Export buyers may require added documentation beyond domestic product acceptance.
- Price-based competition can compress API margins even when volume is large.
China Market FAQs
What should C-suite teams prioritize in China?
C-suite teams should prioritize qualification requirements, procurement routes, local service coverage, and implementation economics before committing capital or supplier volume.
How should suppliers approach the China market?
Suppliers should align technical evidence, local channel support, and account-specific commercial terms with the buying process used by major customers in China.
What can weaken the business case in China?
Price-based competition can compress API margins even when volume is large. Executives should test this exposure during supplier, investment, and rollout reviews.
How is the Telmisartan Market developing in South Korea?
South Korea is projected to record a CAGR of 0.7% through 2036. The country outlook identifies this demand signal: South Korea has strong treatment awareness and high chronic-care use.
Country Market Snapshot
| Country | South Korea |
|---|---|
| Forecast CAGR | 0.7% |
| Demand anchor | South Korea has strong treatment awareness and high chronic-care use. |
| Local proof point | WHO profiles show 11.3 million adults aged 30 to 79 with hypertension. |
| Channel route | Domestic generic firms source APIs through regulated supplier qualification. |
| Buyer behavior | Korean buyers value impurity data, stability records and reliable logistics. |
| Application mix | Hypertension therapy drives the main commercial opportunity. |
| Restraint | Higher control rates limit the scope for sudden prescription expansion. |
| Company context | Companies active in or serving this market include Hanmi Pharmaceutical, Yuhan Corporation, Chong Kun Dang, Daewoong Pharmaceutical, and Celltrion Pharm. |
Market Outlook
South Korea is a mature but well-organized antihypertensive market. WHO country profiles show a 61% control rate among adults aged 30 to 79 with hypertension, which is high compared with many large markets. This reduces the case for rapid volume upside. It does create a stable refill market for generic medicines where supplier reliability carries weight. South Korea is expected to record a CAGR of 0.7% through 2036 as steady treatment coverage supports repeat API use.
Key Growth Drivers
- High treatment coverage supports recurring demand for chronic antihypertensive tablets.
- Domestic generic manufacturers require qualified API sources for stable finished-dose supply.
- Combination therapy use creates selective demand for telmisartan in multi-drug regimens.
- South Korea has strong treatment awareness and high chronic-care use.
Key Restraints
- Stronger hypertension control limits the pace of new prescription growth.
- Supplier qualification can be demanding for API vendors without a Korean track record.
- Higher control rates limit the scope for sudden prescription expansion.
South Korea Market FAQs
What should C-suite teams prioritize in South Korea?
C-suite teams should prioritize qualification requirements, procurement routes, local service coverage, and implementation economics before committing capital or supplier volume.
How should suppliers approach the South Korea market?
Suppliers should align technical evidence, local channel support, and account-specific commercial terms with the buying process used by major customers in South Korea.
What can weaken the business case in South Korea?
Higher control rates limit the scope for sudden prescription expansion. Executives should test this exposure during supplier, investment, and rollout reviews.
How is the Telmisartan Market developing in the United States?
The United States is projected to record a CAGR of 0.6% through 2036. The country outlook identifies this demand signal: USA hypertension burden keeps chronic antihypertensive prescribing central to generic oral medicine demand.
Country Market Snapshot
| Country | United States |
|---|---|
| Forecast CAGR | 0.6% |
| Demand anchor | USA hypertension burden keeps chronic antihypertensive prescribing central to generic oral medicine demand. |
| Regulatory context | FDA Orange Book listings support multisource generic competition and reference-product clarity. |
| Channel route | ANDA holders source API through audited direct contracts and qualified distributor channels. |
| Application mix | Hypertension use dominates, while cardiovascular risk reduction is narrower and label-specific. |
| Buyer behavior | Finished-dose firms screen suppliers around DMF strength, impurity control and batch history. |
| Restraint | Generic price pressure limits the value upside from large treatment volume. |
| Company context | Companies active in or serving this market include Boehringer Ingelheim, Teva USA, Aurobindo Pharma USA, Lupin Pharmaceuticals, and Torrent Pharma. |
Market Outlook
United States demand is driven by a large chronic treatment pool and a mature generic channel. CDC data published in June 2026 reported that 119.9 million USA adults had hypertension during 2021 to 2024. This means telmisartan API demand depends on refill continuity and formulary access rather than new patient discovery. Buyers usually prefer suppliers that can support annual quality reviews and stable change-control files.
Key Growth Drivers
- Chronic blood-pressure treatment supports repeat finished-dose output across retail and mail-order pharmacy channels.
- FDA reference-product clarity keeps generic development and supply planning commercially workable.
- Combination hypertension products create small but useful demand for well-documented telmisartan API.
- USA hypertension burden keeps chronic antihypertensive prescribing central to generic oral medicine demand.
Key Restraints
- Consolidated generic buyers push hard on API prices during annual supply negotiations.
- Supplier switches can be slow when DMF references and quality agreements are already approved.
- Generic price pressure limits the value upside from large treatment volume.
United States Market FAQs
What should C-suite teams prioritize in the United States?
C-suite teams should prioritize qualification requirements, procurement routes, local service coverage, and implementation economics before committing capital or supplier volume.
How should suppliers approach the United States market?
Suppliers should align technical evidence, local channel support, and account-specific commercial terms with the buying process used by major customers in the United States.
What can weaken the business case in the United States?
Generic price pressure limits the value upside from large treatment volume. Executives should test this exposure during supplier, investment, and rollout reviews.
How is the Telmisartan Market developing in Germany?
Germany is projected to record a CAGR of 0.5% through 2036. The country outlook identifies this demand signal: Germany has a large treated cardiovascular patient pool within a strict reimbursement system.
Country Market Snapshot
| Country | Germany |
|---|---|
| Forecast CAGR | 0.5% |
| Demand anchor | Germany has a large treated cardiovascular patient pool within a strict reimbursement system. |
| Local proof point | WHO country profiles show 19.0 million German adults aged 30 to 79 with hypertension. |
| Channel route | Statutory insurance rebate contracts shape generic product and sourcing economics. |
| Buyer behavior | Formulators and distributors emphasize EU-grade quality files and supply continuity. |
| Policy context | Pharmacy substitution and reimbursement rules reinforce price competition. |
| Restraint | High quality expectations raise the cost of entering regulated supply chains. |
| Company context | Companies active in or serving this market include Boehringer Ingelheim, STADA, Hexal, Teva Germany, and Zentiva Germany. |
Market Outlook
Germany is a quality-sensitive market where API price and regulatory confidence must both fit. WHO country data show 9.3 million German adults aged 30 to 79 with uncontrolled hypertension, which keeps the clinical need visible despite a mature treatment system. This volume does not automatically create fast API growth. It creates recurring generic demand under strict payer and pharmacy substitution rules. Germany is forecast to grow at a CAGR of 0.5% through 2036 as steady therapy need is balanced by rebate-contract pressure.
Key Growth Drivers
- Statutory reimbursement keeps chronic antihypertensive medicines widely accessible.
- Generic substitution supports recurring volume for qualified telmisartan finished products.
- EU documentation needs favor suppliers with strong impurity and stability packages.
- Germany has a large treated cardiovascular patient pool within a strict reimbursement system.
Key Restraints
- Rebate contracts reduce pricing flexibility for finished-dose companies and their API suppliers.
- German buyers often need long quality histories before changing approved API vendors.
- High quality expectations raise the cost of entering regulated supply chains.
Germany Market FAQs
What should C-suite teams prioritize in Germany?
C-suite teams should prioritize qualification requirements, procurement routes, local service coverage, and implementation economics before committing capital or supplier volume.
How should suppliers approach the Germany market?
Suppliers should align technical evidence, local channel support, and account-specific commercial terms with the buying process used by major customers in Germany.
What can weaken the business case in Germany?
High quality expectations raise the cost of entering regulated supply chains. Executives should test this exposure during supplier, investment, and rollout reviews.
Which companies are discussed in the Telmisartan Market?
The preview discusses Zhejiang Huahai, Smilax Laboratories, Dr. Reddy’s Laboratories, Aurobindo Pharma, and Cipla among the companies active in this market.
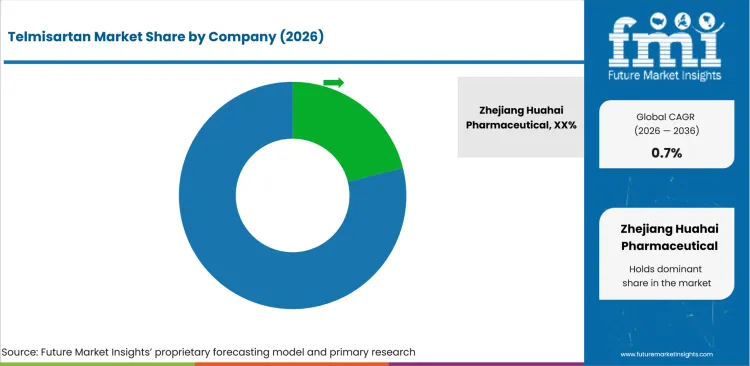
The market is moderately fragmented as validated suppliers compete across China, India and regulated export channels. established companies hold ground through impurity control, DMF support and repeat commercial batch history. Smaller specialists compete in distributor-led channels where buyers need smaller volumes or alternate sources.
Entry barriers are elevated in regulated markets because documentation gaps can delay finished-dose approvals. Price pressure is constant as telmisartan is a mature generic API with many substitute ARB sourcing options. Competition in telmisartan API is shaped by trust in files and repeat supply.
How is competition structured?
Competition reflects differences in specialization, portfolio scope, geographic reach, evidence, and customer access.
The competitive structure is role-based, with API specialists and integrated generic firms serving different buyer needs.
- Validated ARB API Suppliers: Zhejiang Huahai, Smilax Laboratories and Dr. Reddy’s Laboratories have direct public evidence tied to telmisartan API or cardiovascular API supply. Zhejiang Huahai lists telmisartan as validated. Smilax lists telmisartan as an antihypertensive API.
- Vertically Integrated Generic Manufacturers: Aurobindo Pharma, Cipla and Lupin are relevant because they operate across generic medicine portfolios that include cardiovascular products or telmisartan finished-dose references. Aurobindo reports large in-house API use across its formulations platform.
- Broad API and Channel Platforms: Hetero Drugs and Teva Pharmaceutical Industries are best viewed as broad API-channel participants unless direct telmisartan evidence is separately confirmed for a specific country.
How do selected companies compare?
The selected companies differ in portfolio focus, geographic reach, evidence depth, and channel strength.
| Company | Competitive position |
|---|---|
| Zhejiang Huahai Pharmaceutical | Zhejiang Huahai Pharmaceutical is assessed for API or finished-dose relevance, regulated-market documentation, supply reliability, and access to pharmaceutical buyers. |
| Smilax Laboratories | Smilax Laboratories is assessed for API or finished-dose relevance, regulated-market documentation, supply reliability, and access to pharmaceutical buyers. |
| Dr. Reddy’s Laboratories | Dr. Reddy’s Laboratories is assessed for API or finished-dose relevance, regulated-market documentation, supply reliability, and access to pharmaceutical buyers. |
| Aurobindo Pharma | Aurobindo Pharma is assessed for API or finished-dose relevance, regulated-market documentation, supply reliability, and access to pharmaceutical buyers. |
| Cipla | Cipla is assessed for API or finished-dose relevance, regulated-market documentation, supply reliability, and access to pharmaceutical buyers. |
What are the key developments in the Telmisartan Market?
- In June 2025, the USA FDA approved Widaplik with telmisartan, amlodipine and indapamide for hypertension. This supports telmisartan’s role in newer fixed-dose regimens.
- In May 2026, FDA’s Orange Book supplement listed Widaplik telmisartan-containing strengths with June 2025 approval dates. This shows continuing regulatory activity around telmisartan combinations.
- In May 2026, FDA determined MICARDIS telmisartan tablets were not withdrawn for safety or effectiveness. This supports continued generic reference-product confidence.
Selected Companies in the Telmisartan Market
Companies referenced in this preview
- Zhejiang Huahai Pharmaceutical.
- Smilax Laboratories.
- Dr. Reddy’s Laboratories.
- Aurobindo Pharma.
- Cipla.
- MSN Laboratories.
- Hetero.
- Boehringer Ingelheim.
Market Scope & Definition
| Metric | Value |
|---|---|
| Market definition | The Telmisartan Market covers commercially traded telmisartan active pharmaceutical ingredient used in oral finished-dose medicines. Scope includes powder and granule API supplied in ≥99.5%, 98.0%-99.5% and <98% purity grades. |
| Functions covered | Powder, Granules |
| Applications covered | Hypertension, Cardiovascular Risk Reduction |
| End-use industries | Hypertension, Cardiovascular Risk Reduction |
| Inclusions | Market scope covers telmisartan API in powder and granule forms across all listed purity grades, hypertension and cardiovascular risk reduction applications, direct sales, distributor sales, online API marketplaces and the six regional coverage areas used in this study. |
| Exclusions | Market scope excludes finished telmisartan tablets, fixed-dose combination retail products, losartan, valsartan, olmesartan, candesartan, excipients, packaging, clinical services and finished pharmaceutical distribution margins. |
Research Methodology
| Metric | Value |
|---|---|
| Primary Research | Future Market Insights reviewed API buyers, generic formulation manufacturers, sourcing managers and pharmaceutical distributors active in cardiovascular medicines. Interviews focused on supplier qualification, impurity data expectations, batch release timelines and contract length. |
| Desk Research | used regulator databases, prescribing labels, pharmacopeial references and company product information to define the addressable telmisartan API pool. Publicly available evidence was used to separate direct telmisartan suppliers from broader ARB or cardiovascular-drug participants. |
| Market Sizing and Forecasting | The model combined API volume, average export pricing, purity-grade mix and country-level formulation demand. Forecast growth was checked against hypertension treatment need, generic channel behavior and company portfolio evidence. |
| Data Validation | Forecasts were cross-checked with regulatory listings, hypertension statistics and supplier product portfolios. Segment estimates were reviewed against buyer behavior in regulated and price-sensitive generic channels. |
What does the report cover?
The report covers form, purity grade, application, sales channel, and region across the 2026-2036 forecast period in 30+ countries.
| Metric | Value |
|---|---|
| Periods | Base year 2025; estimated year 2026; forecast period 2026-2036 |
| Segment axes | form, purity grade, application, sales channel, and region |
| Regions | North America; Latin America; Europe; East Asia; South Asia & Pacific; Middle East & Africa |
| Countries | United States; United Kingdom; Germany; France; Japan; China; South Korea; India and 30+ countries |
| Companies | Zhejiang Huahai Pharmaceutical, Smilax Laboratories, Dr. Reddy’s Laboratories, Aurobindo Pharma, Cipla, MSN Laboratories, Hetero, Boehringer Ingelheim, and others |
| Approach | Hybrid bottom-up and top-down methodology using API demand, country treatment patterns, purity-grade mix and supplier evidence. |
Market Segmentation Analysis
Segmented by Form
- Powder.
- Granules.
Segmented by Purity Grade
- ≥99.5%.
- 98.0%-99.5%.
- <98%.
Segmented by Application
- Hypertension.
- Cardiovascular Risk Reduction.
Segmented by Sales Channel
- Direct.
- Distributors.
- Online/API Marketplaces.
By Region
- North America.
- United States.
- Latin America.
- East Asia.
- China.
- Japan.
- South Korea.
- Middle East & Africa.
- Western Europe.
- United Kingdom.
- Germany.
- France.
- South Asia and Pacific.
- India.
Research Sources and Bibliography
- World Health Organization. (2025, September 25). Hypertension. World Health Organization.
- DailyMed. (2024). Telmisartan tablet prescribing information. National Library of Medicine.
- USA Food and Drug Administration. (2025, June 5). Widaplik NDA approval letter. USA Food and Drug Administration.
- USA Food and Drug Administration. (2026, May). Approved drug products with therapeutic equivalence evaluations cumulative supplement. USA Food and Drug Administration.
- Federal Register. (2026, May 7). Determination that MICARDIS was not withdrawn from sale for reasons of safety or effectiveness. USA Food and Drug Administration.
- Centers for Disease Control and Prevention. (2026, June 2). High blood pressure facts. Centers for Disease Control and Prevention.
- NHS England Digital. (2026, January 27). Health Survey for England, 2024: Adults’ health. NHS England Digital.
- Santé publique France. (2026, January 26). High blood pressure in France: Latest data. Santé publique France.
- World Health Organization. (2025). Global report on hypertension 2025 country profiles. World Health Organization.
- Zhejiang Huahai Pharmaceutical Co., Ltd. (2026). APIs and intermediates product list. Zhejiang Huahai Pharmaceutical Co., Ltd.
- Smilax Laboratories Limited. (2026). Active pharmaceutical ingredients. Smilax Laboratories Limited.
- Dr. Reddy’s Laboratories. (2026). Active pharmaceutical ingredient product list. Dr. Reddy’s Laboratories.
- Dr. Reddy’s Laboratories. (2026). Manufacturing capabilities. Dr. Reddy’s Laboratories.
- Aurobindo Pharma Limited. (2024). Integrated annual report 2023-24. Aurobindo Pharma Limited.
- Hikal Limited. (2025, November 13). Hikal announces new product pipeline and API capability expansion. Hikal Limited.
The bibliography is provided for reader reference and uses primary government, regulatory, official trade body or company-published sources.
This Report Answers
- What is the projected value of the Telmisartan Market in 2026?
- What value is forecast for the Telmisartan Market by 2036?
- What CAGR is forecast for the Telmisartan Market from 2026 to 2036?
- What 2026 share is projected for Powder within the form category?
- What 2026 share is projected for ≥99.5% within the purity grade category?
- Which demand factors support the Telmisartan Market outlook?
- Which restraints and opportunities affect adoption in the Telmisartan Market?
- How are country CAGR outlooks, including India at 1.18%, compared?
- Which companies and product developments are covered in the competitive analysis?
- What is included in the market scope, and how is the forecast validated?
Frequently Asked Questions
Why should executives track the Telmisartan Market?
Executives should track this market because it can affect capital allocation, supplier strategy, operating risk, and competitive positioning across commercial planning cycles.
What business problem does the Telmisartan Market address?
It helps executive teams judge where customer pain, supplier capability, compliance exposure, and implementation economics justify investment, procurement, or portfolio action.
What should procurement leaders evaluate before selecting suppliers?
Procurement leaders should assess evidence quality, integration fit, service coverage, compliance readiness, total cost of ownership, and supplier execution capability.
What can limit return on investment for buyers?
Return on investment can be limited by low utilization, integration delays, training gaps, unclear ownership, pricing pressure, or weak fit with existing workflows.
How can suppliers build executive confidence?
Suppliers can build confidence by proving implementation speed, risk reduction, support depth, reference use cases, and measurable outcomes for budget owners.
Preview the report firsthand - request a free sample
Get SampleGet the brochure for pricing and purchase details.
Get PDFTable of Content
- Key Takeaways
- Market Size and CAGR
- Top Growth Driver
- Fastest Growing Segment
- Leading Region
- Key Companies
- Emerging Opportunities
- Executive Summary
- Global Market Outlook
- Demand-side Trends
- Supply-side Trends
- Technology Roadmap Analysis
- Analysis and Recommendations
- Analyst Perspective (What is happening? Why now? What should investors know?)
- Key Questions Answered
- How large is the market?
- What is the CAGR?
- What are key trends?
- Which region dominates?
- Who are the leaders?
- Market Overview
- Market Coverage / Taxonomy
- Market Definition / Scope / Limitations
- Research Methodology
- Chapter Orientation
- Analytical Lens and Working Hypotheses
- Market Structure, Signals, and Trend Drivers
- Benchmarking and Cross-market Comparability
- Market Sizing, Forecasting, and Opportunity Mapping
- Research Design and Evidence Framework
- Desk Research Programme (Secondary Evidence)
- Expert Input and Fieldwork (Primary Evidence)
- Tooling, Models, and Reference Databases
- Data Engineering and Model Build
- Quality Assurance and Audit Trail
- Market Background
- Market Dynamics (Drivers, Restraints, Opportunity, Trends)
- Scenario Forecast (Optimistic, Likely, Conservative)
- Impact Analysis
- AI Impact
- Sustainability Impact
- Regulatory Impact
- Technology Impact
- Consumer / Buyer Analysis
- Purchase Drivers
- Adoption Barriers
- Buyer Journey
- Opportunity Map Analysis
- Product Life Cycle Analysis
- Supply Chain Analysis
- Investment Feasibility Matrix
- Value Chain Analysis
- PESTLE and Porter's Analysis
- Regulatory Landscape
- Regional Parent Market Outlook
- Production and Consumption Statistics
- Import and Export Statistics
- Global Market Analysis and Forecast, 2021 to 2036
- Historical Market Size Value (USD Million) & Volume (Unit) Analysis, 2021 to 2025
- Current and Future Market Size Value (USD Million) & Volume (Unit) Projections, 2026 to 2036
- Y-o-Y Growth Trend Analysis
- Absolute $ Opportunity Analysis
- Global Market Pricing Analysis, 2021 to 2036
- Global Market Analysis and Forecast, By Form, 2021 to 2036
- Introduction / Key Findings
- Historical Market Size Value (USD Million) & Volume (Unit) Analysis By Form, 2021 to 2025
- Current and Future Market Size Value (USD Million) & Volume (Unit) Analysis and Forecast By Form, 2026 to 2036
- Powder
- Granules
- Powder
- Y-o-Y Growth Trend Analysis By Form, 2021 to 2025
- Absolute $ Opportunity Analysis By Form, 2026 to 2036
- Global Market Analysis and Forecast, By Purity Grade, 2021 to 2036
- Introduction / Key Findings
- Historical Market Size Value (USD Million) & Volume (Unit) Analysis By Purity Grade, 2021 to 2025
- Current and Future Market Size Value (USD Million) & Volume (Unit) Analysis and Forecast By Purity Grade, 2026 to 2036
- ≥99.5%
- 98.0%-99.5%
- <98%
- ≥99.5%
- Y-o-Y Growth Trend Analysis By Purity Grade, 2021 to 2025
- Absolute $ Opportunity Analysis By Purity Grade, 2026 to 2036
- Global Market Analysis and Forecast, By Application, 2021 to 2036
- Introduction / Key Findings
- Historical Market Size Value (USD Million) & Volume (Unit) Analysis By Application, 2021 to 2025
- Current and Future Market Size Value (USD Million) & Volume (Unit) Analysis and Forecast By Application, 2026 to 2036
- Hypertension
- Cardiovascular Risk Reduction
- Hypertension
- Y-o-Y Growth Trend Analysis By Application, 2021 to 2025
- Absolute $ Opportunity Analysis By Application, 2026 to 2036
- Global Market Analysis and Forecast, By Sales Channel, 2021 to 2036
- Introduction / Key Findings
- Historical Market Size Value (USD Million) & Volume (Unit) Analysis By Sales Channel, 2021 to 2025
- Current and Future Market Size Value (USD Million) & Volume (Unit) Analysis and Forecast By Sales Channel, 2026 to 2036
- Direct
- Distributors
- Online-API Marketplaces
- Direct
- Y-o-Y Growth Trend Analysis By Sales Channel, 2021 to 2025
- Absolute $ Opportunity Analysis By Sales Channel, 2026 to 2036
- Global Market Analysis and Forecast, By Region, 2021 to 2036
- Introduction
- Historical Market Size Value (USD Million) & Volume (Unit) Analysis By Region, 2021 to 2025
- Current Market Size Value (USD Million) & Volume (Unit) Analysis and Forecast By Region, 2026 to 2036
- North America
- Latin America
- Western Europe
- Eastern Europe
- East Asia
- South Asia and Pacific
- Middle East & Africa
- Market Attractiveness Analysis By Region
- North America Market Analysis and Forecast, By Country, 2021 to 2036
- Historical Market Size Value (USD Million) & Volume (Unit) Trend Analysis By Market Taxonomy, 2021 to 2025
- Market Size Value (USD Million) & Volume (Unit) Forecast By Market Taxonomy, 2026 to 2036
- By Country
- USA
- Canada
- Mexico
- By Form
- By Purity Grade
- By Application
- By Sales Channel
- By Country
- Market Attractiveness Analysis
- By Country
- By Form
- By Purity Grade
- By Application
- By Sales Channel
- Key Takeaways
- Latin America Market Analysis and Forecast, By Country
- Historical Market Size Value (USD Million) & Volume (Unit) Trend Analysis By Market Taxonomy, 2021 to 2025
- Market Size Value (USD Million) & Volume (Unit) Forecast By Market Taxonomy, 2026 to 2036
- By Country
- Brazil
- Chile
- Rest of Latin America
- By Form
- By Purity Grade
- By Application
- By Sales Channel
- By Country
- Market Attractiveness Analysis
- By Country
- By Form
- By Purity Grade
- By Application
- By Sales Channel
- Key Takeaways
- Western Europe Market Analysis and Forecast, By Country
- Historical Market Size Value (USD Million) & Volume (Unit) Trend Analysis By Market Taxonomy, 2021 to 2025
- Market Size Value (USD Million) & Volume (Unit) Forecast By Market Taxonomy, 2026 to 2036
- By Country
- Germany
- UK
- Italy
- Spain
- France
- Nordic
- BENELUX
- Rest of Western Europe
- By Form
- By Purity Grade
- By Application
- By Sales Channel
- By Country
- Market Attractiveness Analysis
- By Country
- By Form
- By Purity Grade
- By Application
- By Sales Channel
- Key Takeaways
- Eastern Europe Market Analysis and Forecast, By Country
- Historical Market Size Value (USD Million) & Volume (Unit) Trend Analysis By Market Taxonomy, 2021 to 2025
- Market Size Value (USD Million) & Volume (Unit) Forecast By Market Taxonomy, 2026 to 2036
- By Country
- Russia
- Poland
- Hungary
- Balkan & Baltic
- Rest of Eastern Europe
- By Form
- By Purity Grade
- By Application
- By Sales Channel
- By Country
- Market Attractiveness Analysis
- By Country
- By Form
- By Purity Grade
- By Application
- By Sales Channel
- Key Takeaways
- East Asia Market Analysis and Forecast, By Country
- Historical Market Size Value (USD Million) & Volume (Unit) Trend Analysis By Market Taxonomy, 2021 to 2025
- Market Size Value (USD Million) & Volume (Unit) Forecast By Market Taxonomy, 2026 to 2036
- By Country
- China
- Japan
- South Korea
- By Form
- By Purity Grade
- By Application
- By Sales Channel
- By Country
- Market Attractiveness Analysis
- By Country
- By Form
- By Purity Grade
- By Application
- By Sales Channel
- Key Takeaways
- South Asia and Pacific Market Analysis and Forecast, By Country
- Historical Market Size Value (USD Million) & Volume (Unit) Trend Analysis By Market Taxonomy, 2021 to 2025
- Market Size Value (USD Million) & Volume (Unit) Forecast By Market Taxonomy, 2026 to 2036
- By Country
- India
- ASEAN
- Australia & New Zealand
- Rest of South Asia and Pacific
- By Form
- By Purity Grade
- By Application
- By Sales Channel
- By Country
- Market Attractiveness Analysis
- By Country
- By Form
- By Purity Grade
- By Application
- By Sales Channel
- Key Takeaways
- Middle East & Africa Market Analysis and Forecast, By Country
- Historical Market Size Value (USD Million) & Volume (Unit) Trend Analysis By Market Taxonomy, 2021 to 2025
- Market Size Value (USD Million) & Volume (Unit) Forecast By Market Taxonomy, 2026 to 2036
- By Country
- Kingdom of Saudi Arabia
- Other GCC Countries
- Türkiye
- South Africa
- Other African Union
- Rest of Middle East & Africa
- By Form
- By Purity Grade
- By Application
- By Sales Channel
- By Country
- Market Attractiveness Analysis
- By Country
- By Form
- By Purity Grade
- By Application
- By Sales Channel
- Key Takeaways
- Key Countries Market Analysis
- USA
- Pricing Analysis
- Market Share Analysis, 2025
- By Form
- By Purity Grade
- By Application
- By Sales Channel
- Canada
- Pricing Analysis
- Market Share Analysis, 2025
- By Form
- By Purity Grade
- By Application
- By Sales Channel
- Mexico
- Pricing Analysis
- Market Share Analysis, 2025
- By Form
- By Purity Grade
- By Application
- By Sales Channel
- Brazil
- Pricing Analysis
- Market Share Analysis, 2025
- By Form
- By Purity Grade
- By Application
- By Sales Channel
- Chile
- Pricing Analysis
- Market Share Analysis, 2025
- By Form
- By Purity Grade
- By Application
- By Sales Channel
- Germany
- Pricing Analysis
- Market Share Analysis, 2025
- By Form
- By Purity Grade
- By Application
- By Sales Channel
- UK
- Pricing Analysis
- Market Share Analysis, 2025
- By Form
- By Purity Grade
- By Application
- By Sales Channel
- Italy
- Pricing Analysis
- Market Share Analysis, 2025
- By Form
- By Purity Grade
- By Application
- By Sales Channel
- Spain
- Pricing Analysis
- Market Share Analysis, 2025
- By Form
- By Purity Grade
- By Application
- By Sales Channel
- France
- Pricing Analysis
- Market Share Analysis, 2025
- By Form
- By Purity Grade
- By Application
- By Sales Channel
- India
- Pricing Analysis
- Market Share Analysis, 2025
- By Form
- By Purity Grade
- By Application
- By Sales Channel
- ASEAN
- Pricing Analysis
- Market Share Analysis, 2025
- By Form
- By Purity Grade
- By Application
- By Sales Channel
- Australia & New Zealand
- Pricing Analysis
- Market Share Analysis, 2025
- By Form
- By Purity Grade
- By Application
- By Sales Channel
- China
- Pricing Analysis
- Market Share Analysis, 2025
- By Form
- By Purity Grade
- By Application
- By Sales Channel
- Japan
- Pricing Analysis
- Market Share Analysis, 2025
- By Form
- By Purity Grade
- By Application
- By Sales Channel
- South Korea
- Pricing Analysis
- Market Share Analysis, 2025
- By Form
- By Purity Grade
- By Application
- By Sales Channel
- Russia
- Pricing Analysis
- Market Share Analysis, 2025
- By Form
- By Purity Grade
- By Application
- By Sales Channel
- Poland
- Pricing Analysis
- Market Share Analysis, 2025
- By Form
- By Purity Grade
- By Application
- By Sales Channel
- Hungary
- Pricing Analysis
- Market Share Analysis, 2025
- By Form
- By Purity Grade
- By Application
- By Sales Channel
- Kingdom of Saudi Arabia
- Pricing Analysis
- Market Share Analysis, 2025
- By Form
- By Purity Grade
- By Application
- By Sales Channel
- Türkiye
- Pricing Analysis
- Market Share Analysis, 2025
- By Form
- By Purity Grade
- By Application
- By Sales Channel
- South Africa
- Pricing Analysis
- Market Share Analysis, 2025
- By Form
- By Purity Grade
- By Application
- By Sales Channel
- USA
- Market Structure Analysis
- Competition Dashboard
- Competition Benchmarking
- Market Share Analysis of Top Players
- By Regional
- By Form
- By Purity Grade
- By Application
- By Sales Channel
- Emerging Startups
- Innovation Benchmarking
- Competition Analysis
- Competition Deep Dive
- Zhejiang Huahai Pharmaceutical
- Overview
- Product Portfolio
- Profitability by Market Segments (Product/Region/Sales Channel)
- Sales Footprint
- Strategy Overview
- Marketing Strategy
- Product Strategy
- Channel Strategy
- Smilax Laboratories
- Dr. Reddy's Laboratories
- Aurobindo Pharma
- Cipla
- MSN Laboratories
- Hetero
- Boehringer Ingelheim
- Zhejiang Huahai Pharmaceutical
- Case Studies
- Success Stories
- Recent Developments
- Competition Deep Dive
- Assumptions & Acronyms Used


