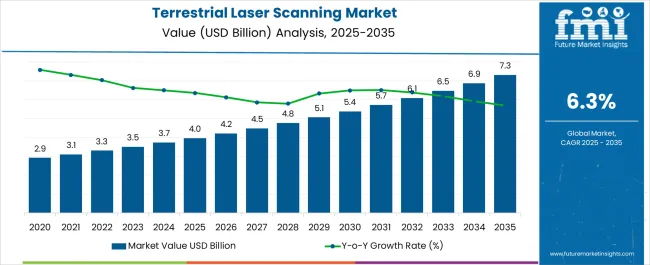
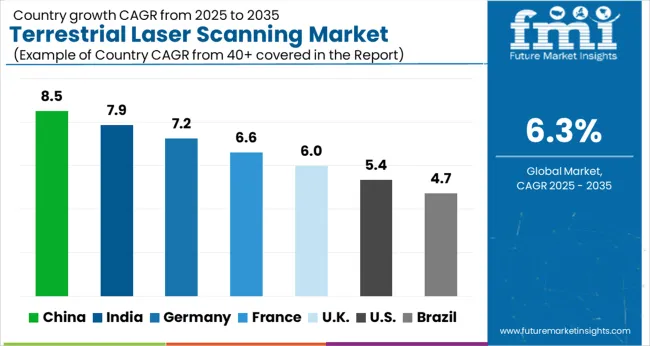
The terrestrial laser scanning market is estimated to be valued at USD 4.0 billion in 2025 and is projected to reach USD 7.3 billion by 2035, registering a compound annual growth rate (CAGR) of 6.3% over the forecast period.
Survey professionals evaluate terrestrial laser scanning specifications based on measurement accuracy, scanning range, and data acquisition speed when establishing surveying protocols for topographic mapping, structural monitoring, and industrial facility documentation. Equipment selection involves analyzing point cloud density, measurement precision, and environmental operating limits while considering data processing requirements, battery life characteristics, and transportation portability necessary for diverse field applications. Procurement decisions balance initial scanner investment against productivity advantages including reduced field time, improved measurement accuracy, and comprehensive data capture that influence project efficiency and client service quality throughout surveying operations.
Data acquisition processes require specialized scanning equipment, registration target systems, and environmental control considerations that ensure measurement accuracy while maintaining operational efficiency throughout varying site conditions and accessibility constraints. Operations coordination involves managing scanning location planning, equipment transportation, and data processing workflows while maintaining survey control networks and coordinate system accuracy across multiple measurement sessions. Quality assurance procedures address registration accuracy verification, point cloud completeness assessment, and measurement precision validation that confirm survey deliverable quality while supporting engineering design and construction layout requirements.
Cross-functional coordination involves survey technicians, data processing specialists, and project managers collaborating to optimize scanning workflows that balance data collection thoroughness with processing efficiency while addressing specific project requirements and delivery schedules. Field operations encompass scanning setup procedures, environmental monitoring, and safety protocol implementation while coordinating with construction activities, facility operations, and access control requirements. Training programs address scanner operation techniques, data processing methodologies, and quality control procedures essential for maintaining measurement accuracy and ensuring optimal project outcomes throughout diverse scanning applications.
Technology advancement prioritizes mobile scanning systems, real-time processing capabilities, and automated registration techniques that improve data collection efficiency while reducing operational complexity and field time requirements throughout diverse scanning applications. Manufacturers develop integrated GNSS systems, automated target recognition, and cloud-based processing platforms that optimize workflow efficiency while maintaining measurement precision and data quality standards. Innovation encompasses handheld scanning devices, robotic scanning platforms, and artificial intelligence-supported analysis that expand scanning capabilities while supporting automated measurement and inspection applications.
Application diversification addresses construction progress monitoring requiring temporal change detection, manufacturing quality control needing dimensional verification, and cultural heritage documentation demanding preservation-quality accuracy that leverage terrestrial laser scanning advantages for diverse measurement objectives. Service providers coordinate with engineering consultants, construction contractors, and facility management companies to establish comprehensive scanning solutions that optimize project delivery while maintaining cost-effectiveness and quality standards. Specialized applications encompass forensic documentation, mining volume calculations, and bridge inspection programs that require specific measurement protocols and analysis expertise.
| Metric | Value |
|---|---|
| Terrestrial Laser Scanning Market Estimated Value in (2025 E) | USD 4.0 billion |
| Terrestrial Laser Scanning Market Forecast Value in (2035 F) | USD 7.3 billion |
| Forecast CAGR (2025 to 2035) | 6.3% |
The terrestrial laser scanning market is experiencing notable expansion owing to its critical role in infrastructure development, urban planning, and geospatial analysis. The growing demand for precise three dimensional data in construction, mining, and heritage conservation has accelerated adoption.
The technology’s ability to deliver high speed and high accuracy spatial data without physical contact is driving efficiency across industries. Integration with advanced software platforms and BIM workflows is further enhancing usability and decision making.
Regulatory emphasis on sustainable infrastructure development and safety monitoring is supporting market growth, particularly in regions undergoing rapid industrialization and urbanization. The outlook remains positive as the convergence of automation, AI based analytics, and increasing reliance on digital twins fosters greater reliance on terrestrial laser scanning technologies.
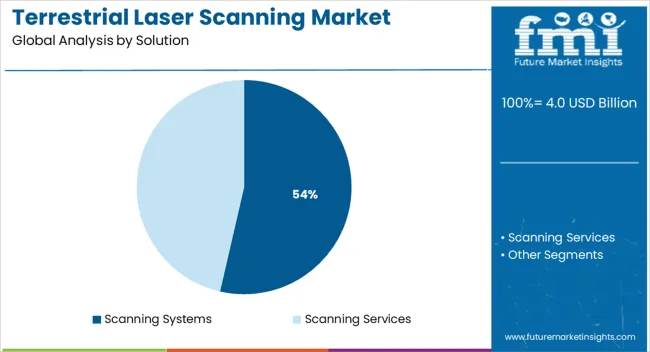
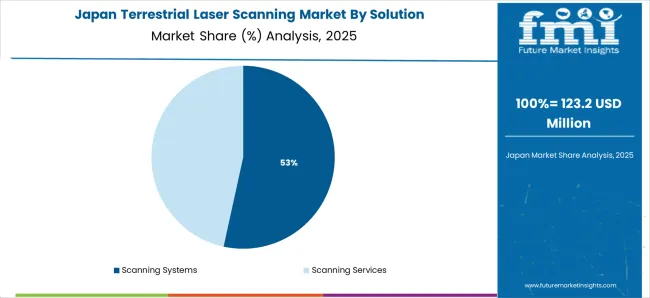
The scanning systems segment is projected to hold 53.60% of total market revenue by 2025 within the solution category, making it the leading segment. This growth is being driven by the rising need for integrated systems that combine hardware, software, and services into a single package.
Scanning systems are preferred due to their efficiency in capturing detailed point cloud data and seamless compatibility with analysis platforms. Their adoption has been reinforced by growing demand for end to end solutions that minimize errors and reduce operational costs.
As industries increasingly seek ready to deploy systems with automated processing capabilities, scanning systems continue to strengthen their leadership position in the solution category.
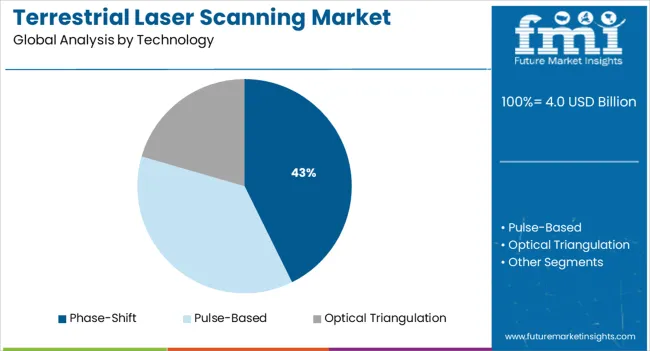
The phase shift technology segment is expected to account for 42.70% of the total market revenue by 2025 under the technology category. This is attributed to its superior accuracy, high scanning speed, and suitability for short to medium range applications.
Phase shift systems provide dense point clouds that are highly valued in applications requiring detailed surface modeling such as construction site surveys, industrial plant maintenance, and architectural documentation. The segment’s growth is further supported by continuous advancements in phase modulation techniques that improve efficiency and reduce noise.
As precision and speed become critical success factors, phase shift technology maintains a strong competitive edge in the terrestrial laser scanning market.
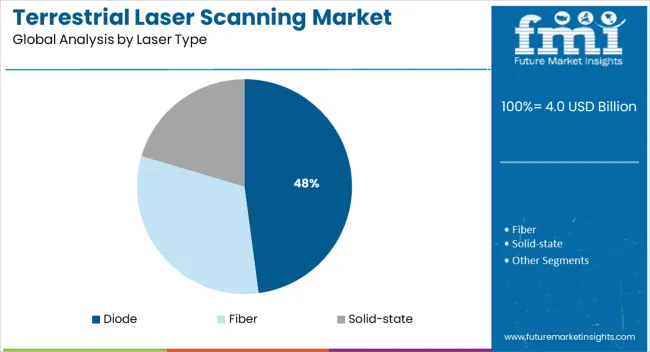
The diode laser type segment is projected to represent 47.90% of total market revenue by 2025 within the laser type category, positioning it as the most prominent segment. Its dominance is attributed to compact size, energy efficiency, and cost effectiveness compared to other laser sources.
Diode lasers are widely used due to their long operational life, high modulation speed, and versatility across different environmental conditions. Their compatibility with portable scanning systems has also enhanced market adoption, particularly for field applications where mobility is critical.
As industries emphasize cost efficiency while maintaining accuracy and reliability, diode lasers continue to be the preferred choice, consolidating their leadership in the laser type category.
As per Future Market Insights (FMI), the global terrestrial laser scanning market witnessed growth at a CAGR of 6.9% in the historical period from 2020 to 2024. Between 2025 and 2035, the market is likely to exhibit a CAGR of 6.3%.
Real-time data collection is becoming increasingly necessary in sectors such as construction and manufacturing. These sectors would benefit from the time and cost savings provided by terrestrial laser scanning systems.
Terrestrial laser scanning systems also offer excellent data transfer rates, volume, and precision. Hence, the market for terrestrial laser scanning systems is expanding due to the urgent need for accurate, large volume data transfer.
A primary driver of industry growth will be the huge requirement for 3D laser scanning in infrastructure associated with research and development. In the forecast period, the market is expected to rise astonishingly due to surging adoption of laser scanning systems for inventory generation and quick mapping. Increasing increase in global capital expenditure from the infrastructure sector would also bode well for the market.
| Historical CAGR | 6.9% |
|---|---|
| Historical Market Value (2024) | USD 3.1 billion |
| Forecast CAGR | 6.3% |
Requirement of Mobile Terrestrial Laser Scanning for Oil Extraction to Boost Sales
Terrestrial laser scanning services are widely used in numerous industries such as oil & gas, mining, infrastructure, forestry & agriculture, transportation & logistics, education, and media & entertainment. In the oil & gas industry, terrestrial lasers are used in scanning areas where oil extraction takes place and a complete area scan can be done in just 26 seconds and their 3D models can be formed.
Terrestrial laser scanners are used in the oil & gas industry where detection range is around 450m and effective point rate is 240,000 pts/s. In gas pipelines of oil and gas industries, 1:500 to 1:5000 scales are being used for target scanning.
Terrestrial laser scanners offer several advantages when it comes to construction coordination, particularly in avoiding conflicts between different systems such as plumbing, ventilation, and electrical, among others. Information may be provided between parties to help with any remote interaction.
To properly document milestones, reduce the need for change orders, and assign work to concerned specialists, scanning may also be done in various later phases of a project. Terrestrial laser scanners in the construction industry can help with problem identification and error recording more promptly.
Terrestrial laser scanners are widely used in the mining industry as they can minimize risks of accidents by providing a controlled safety perimeter of 4-800m of study area. In topological surveys, for pavement analysis scans, roadway topological surveys, structures, and bridges clearance surveys terrestrial laser scanners are used.
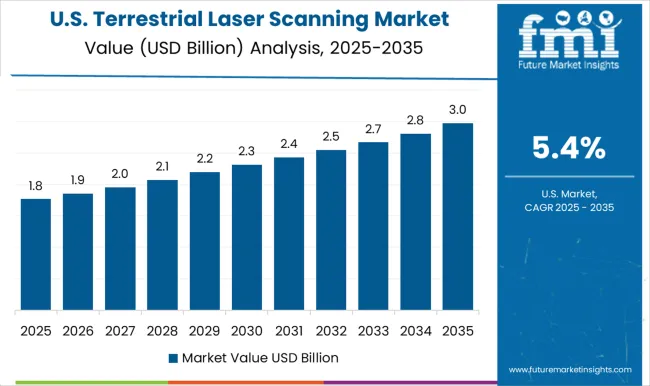
Demand for Inexpensive 3D Models to Spur Sales of Terrestrial Laser Scanning Equipment in the USA
The USA terrestrial laser scanning industry is expected to be worth USD 7.3 billion by 2035. It is set to create an absolute dollar opportunity of USD 2.9 million in the assessment period. As per FMI, the USA market exhibited a CAGR of 5.5% from 2020 to 2024.
Terrestrial laser scanning solutions instantly acquire precise, dense three-dimensional data on an object's surface by comparing the laser's propagation time to the emitted beam. This makes creating 3D models inexpensive and incredibly quick, which will further push the USA market in the forecast period. However, the market may be constrained by high initial investments and ongoing operating costs for ground-based laser scanning, as well as light detection and ranging.
Requirement of Accurate Measurements among Builders to Propel Sales of Airborne Laser Scanning Solutions in the United Kingdom
The United Kingdom terrestrial laser scanning industry is set to exhibit a CAGR of around 5.5% in the forecast period. According to Future Market Insights, the country is likely to create an absolute $ opportunity of USD 116.4 million by 2035.
Terrestrial laser scanning in the building industry can offer timely and reasonably priced documentation of the entire process. A seamless capture and monitoring procedure is necessary for accurate dimensional inspection of complex components.
It includes project coordination, free-form shape elements, monitoring of countermeasures, and documenting of deformation processes to enable a smooth multi-trade project collaboration. These factors are likely to push terrestrial laser scanning demand in the United Kingdom.
Terrestrial Scanners in China are to be Utilized for Building Information Modelling
China terrestrial laser scanning market is likely to create an incremental opportunity of USD 263.0 million in the estimated time period. The country exhibited a CAGR of 8.4% in the historical period. It is set to reach a valuation of around USD 523.9 million by 2035.
Increasing investments by key players and government bodies to come up with new equipment for terrestrial laser scanning purposes would drive sales in China. In September 2024, for instance, a research study was conducted on applications of terrestrial laser scanning in 3D modeling of a traditional village in China.
The village under observation was called Fenghuang. During research, buildings in the village were scanned by using terrestrial lasers and then appropriate models were created. Hence, for building information modeling, these lasers are set to be widely used in China.
Demand for Mobile Terrestrial Laser Scanning Solutions to Boom in Japan with Sales from Construction Projects
Japan terrestrial laser scanning market is projected to reach a valuation of USD 442.6 million by 2035, finds FMI. The country showcased 6.2% CAGR during the historical period between 2020 and 2024.
Terrestrial laser scanning has several advantages when it comes to construction coordination, particularly in avoiding conflicts between different systems such as electrical, ventilation, and plumbing. Information can be shared between parties to help with any remote interaction.
To efficiently document milestones, reduce the need for change orders, and assign work to concerned professionals, scanning may also be done in various later phases of a project. Terrestrial laser scanning in the Japan construction industry can help with problem identification and error recording more promptly.
Sales of 3D Terrestrial Laser Scanner Services to Skyrocket amid Urgent Demand from Land Surveyors
Based on solution, the scanning services segment is projected to dominate the global market during the forecast period. As per Future Market Insights, the segment held a CAGR of 6.8% in the historical period from 2020 to 2024. It is anticipated to showcase a CAGR of 6.2% in the estimated time frame.
Since different kinds of land surveyors worldwide have been investing in cutting-edge technologies, the terrestrial scanning services segment is anticipated to expand at a significant CAGR throughout the forecast period. These scanners are used to create 3D models of all types of items and buildings, which aids land surveyors in mapping the data of highly developed economies with strong purchasing power.
Scanning services are widely employed in numerous mining applications due to their excellent advantages. Few of these applications include identifying irregularities in underground mines, finding out the shotcrete thickness in tunnels, evaluating transformation measurements in tunnels, and identifying discontinuities to stop rock falls & landslides. These factors are anticipated to support the segment's revenue growth.
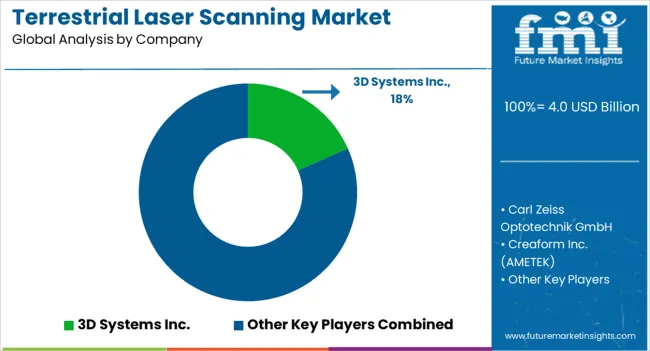
The terrestrial laser scanning market is highly competitive, driven by advancements in 3D scanning technologies used in applications such as architecture, construction, mining, and surveying. 3D Systems Inc., FARO Technologies Inc., and Hexagon AB are among the market leaders, offering a wide range of high-precision terrestrial laser scanners. These companies provide comprehensive solutions that combine hardware and software for 3D modeling, measurement, and real-time data processing, catering to industries that require high accuracy and efficiency in spatial data collection.
Carl Zeiss Optotechnik GmbH, Teledyne Technologies Inc., and Leica Geosystems AG (part of Hexagon AB) specialize in cutting-edge laser scanning systems that deliver advanced features such as longer range, higher resolution, and faster data acquisition, crucial for large-scale industrial and geospatial applications. Their solutions are used extensively in sectors like civil engineering, surveying, and environmental monitoring.
Creaform Inc. (AMETEK Inc.) and Trimble Inc. focus on mobile and handheld scanning solutions, offering portability and flexibility for dynamic environments and complex geometries. Fugro N.V. and RIEGL Laser Measurement Systems GmbH are also prominent players, providing specialized laser scanning technology for geospatial mapping and subsurface applications.
Maptek Pty Ltd., Topcon Corporation, and Zoller + Fröhlich GmbH round out the competitive landscape, offering advanced solutions for mining, construction, and infrastructure projects, where precise measurements and data integration are essential. Overall, competition is driven by technological innovation, product accuracy, and industry-specific solutions.
| Attribute | Details |
|---|---|
| Estimated Market Size (2025) | USD 4.0 billion |
| Projected Market Valuation (2035) | USD 7.3 billion |
| Value-based CAGR (2025 to 2035) | 6.3% |
| Forecast Period | 2025 to 2035 |
| Historical Data Available for | 2020 to 2024 |
| Market Analysis | Value (USD billion) |
| Key Regions Covered | North America; Latin America; Europe; East Asia; South Asia; and the Middle East & Africa |
| Key Countries Covered | USA, Canada, Brazil, Mexico, Germany, United Kingdom, France, Italy, Spain, Nordic, Russia, Poland, China, India, Thailand, Indonesia, Australia and New Zealand, Japan, Gulf Cooperation Council countries, North Africa, South Africa, others. |
| Key Segments Covered | Solution, Technology, Laser Type, Application, Region |
| Key Companies Profiled |
3D Systems Inc., Carl Zeiss Optotechnik GmbH, Creaform Inc. (AMETEK Inc.), FARO Technologies Inc., Fugro N.V., Hexagon AB, Leica Geosystems AG (part of Hexagon AB), Maptek Pty Ltd., RIEGL Laser Measurement Systems GmbH, Teledyne Technologies Inc., Topcon Corporation, Trimble Inc., Zoller + Fröhlich GmbH |
| Report Coverage | Market Forecast, Company Share Analysis, Competitive Landscape, Market Dynamics and Challenges, and Strategic Growth Initiatives |
The global terrestrial laser scanning market is estimated to be valued at USD 4.0 billion in 2025.
The market size for the terrestrial laser scanning market is projected to reach USD 7.3 billion by 2035.
The terrestrial laser scanning market is expected to grow at a 6.3% CAGR between 2025 and 2035.
The key product types in terrestrial laser scanning market are scanning systems and scanning services.
In terms of technology, phase-shift segment to command 42.7% share in the terrestrial laser scanning market in 2025.


Full Research Suite comprises of:
Market outlook & trends analysis
Interviews & case studies
Strategic recommendations
Vendor profiles & capabilities analysis
5-year forecasts
8 regions and 60+ country-level data splits
Market segment data splits
12 months of continuous data updates
DELIVERED AS:
PDF EXCEL ONLINE
Terrestrial Trunked Radio (TETRA) Market Analysis - Size, Share, and Forecast 2025 to 2035
Laser-Assisted Smart Lathes Market Size and Share Forecast Outlook 2025 to 2035
Laser Drilling Equipment Market Size and Share Forecast Outlook 2025 to 2035
Laser Transverse Mode Teaching Instrument Market Forecast and Outlook 2025 to 2035
Laser Welding Equipment Market Forecast and Outlook 2025 to 2035
Laser Welding Market Size and Share Forecast Outlook 2025 to 2035
Laser Ablation Systems Market Size and Share Forecast Outlook 2025 to 2035
Laser Measurement Integrating Sphere Market Size and Share Forecast Outlook 2025 to 2035
Laser Safety Cloths Market Size and Share Forecast Outlook 2025 to 2035
Laser Dazzler Market Size and Share Forecast Outlook 2025 to 2035
Laser Cable Marking Market Size and Share Forecast Outlook 2025 to 2035
Laser Cladding Market Size and Share Forecast Outlook 2025 to 2035
Laser Marking Equipment Market Size and Share Forecast Outlook 2025 to 2035
Laser Cutting Machines Market Size and Share Forecast Outlook 2025 to 2035
Laser Wire Marking Systems Market Size and Share Forecast Outlook 2025 to 2035
Laser Photomask Market Size and Share Forecast Outlook 2025 to 2035
Laser Measuring Instrument Market Size and Share Forecast Outlook 2025 to 2035
Laser Welding Machine Market Size and Share Forecast Outlook 2025 to 2035
Laser Technology Market Size and Share Forecast Outlook 2025 to 2035
Laser Interferometer Market Size and Share Forecast Outlook 2025 to 2035

Thank you!
You will receive an email from our Business Development Manager. Please be sure to check your SPAM/JUNK folder too.
Chat With
MaRIA