

- Market Size (2026)
- USD 860.6 Mn
- Forecast (2036)
- USD 1708.8 Mn
- CAGR (2026 to 2036)
- 7.1%
How big is the Top Drive Modernization Kits Market?
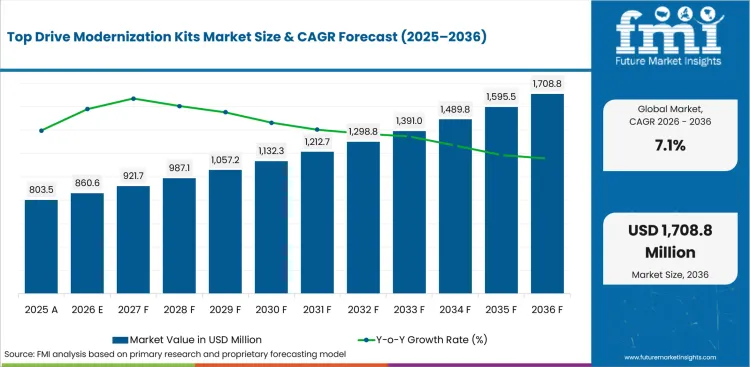
The Top Drive Modernization Kits Market is projected to grow from USD 860.6 million in 2026 to USD 1708.8 million by 2036, at a CAGR of 7.1%.
The Top Drive Modernization Kits Market was valued at USD 803.55 million in 2025 and is expected to reach USD 860.6 million in 2026. The market is projected to reach USD 1708.8 million by 2036 at a CAGR of 7.1%. Control System Upgrade Kits are projected to lead the kit-type category with a 34.0% share in 2026. Land Rigs are expected to lead the rig-type category with a 46.0% share in 2026.
In February 2024, Canrig issued a Sigma 500T top drive product bulletin covering back-up wrench cylinder rod inspection and a field securement kit. The notice shows how retrofit parts and inspection work support operating fleets. In August 2024, Canrig released its 2024 top drive brochure detailing SmartROS controls, Advanced Diagnostics System, and hydraulic torque boost.
Buyers are not simply replacing worn parts. They are choosing upgrades that cut non-productive time and extend the useful life of existing rigs.
| Metric | Value |
|---|---|
| 2025 Market Size | USD 803.55 million |
| 2026 Market Size | USD 860.6 million |
| 2036 Market Size | USD 1,708.8 million |
| Forecast CAGR (2026-2036) | 7.1% |
| Leading Kit Type | Control System Upgrade Kits |
| Control System Upgrade Kits Share (2026) | 34.0% |
| Leading Rig Type | Land Rigs |
| Land Rigs Share (2026) | 46.0% |
| Fastest-growing Country | China |
| China CAGR by 2036 | 8.0% |
Summary of the Top Drive Modernization Kits Market
| Market Signal | Commercial Impact |
|---|---|
| Demand and Growth Drivers | Demand for top drive upgrade kits is increasing as drilling contractors modernize existing rigs with automation, improved torque control, and enhanced operational safety.
|
| Product and Segment View | Control system upgrade kits, land rigs, and partial retrofit projects continue to represent the leading commercial opportunities across the market.
|
| Geography and Growth Outlook | North America and Asia continue to drive market expansion through drilling activity, unconventional resource development, and rig modernization investments.
|
| Competitive Landscape | Competition increasingly focuses on automation integration, retrofit capability, equipment reliability, and lifecycle support for existing drilling fleets.
|
| Analyst Perspective | Top drive upgrade kits are evolving from maintenance components into strategic modernization solutions that extend rig life while improving drilling performance and operational safety.
- Nikhil Kaitwade, Principal Consultant at Future Market Insights |
Why is the Top Drive Modernization Kits Market growing?
Longer lateral drilling raises torque-control needs, which pushes buyers toward drive and control upgrades. Automation-ready rig floors need top drive controls that can communicate with digital drilling platforms.
- Longer lateral drilling raises torque-control needs, which pushes buyers toward drive and control upgrades.
- Automation-ready rig floors need top drive controls that can communicate with digital drilling platforms.
- Safety teams prefer interlock kits when older rigs lack reliable motion and pipe-handling protection.
Top drive upgrades are becoming a practical way to increase rig capability without buying a new rig. In the United States, the Energy Information Administration reported that Lower 48 active oil and gas rigs fell from 750 in December 2022 to 517 in October 2025, while output stayed high due to better drilling efficiency. This means the same rig fleet is being asked to deliver more footage and better uptime. For modernization suppliers, that changes the sales pitch from replacement to measurable production support. Buyers want better torque response and fewer service failures. Vendors that can connect Top drive upgrades to longer laterals and lower downtime will protect pricing better.
How is the Top Drive Modernization Kits Market segmented?
The Top Drive Modernization Kits Market is segmented by kit type, rig type, upgrade scope, end use, sales channel, and region.
- Control System Upgrade Kits are projected to lead the kit-type category with a 34.0% share in 2026 as automation interfaces become the first retrofit priority.
- With an estimated 46.0% share in 2026, Land Rigs are expected to lead the rig-type category due to a larger addressable retrofit fleet.
- Partial Upgrade is expected to represent 39.0% of the upgrade scope category in 2026, with buyers phasing work around scheduled maintenance.
How does Control System Upgrade Kits contribute to the kit type category?
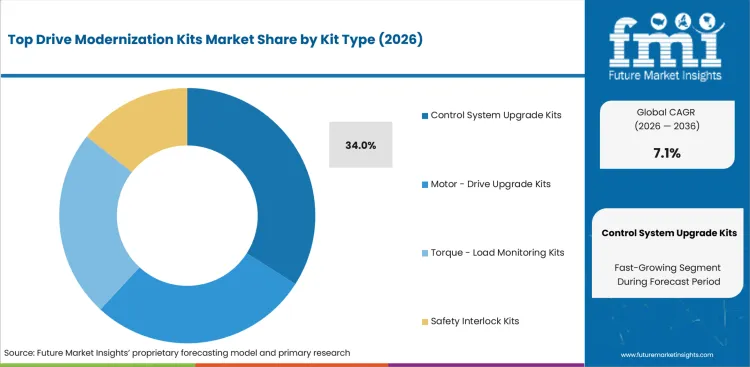
- Control System Upgrade Kits are projected to account for a 34.0% share in 2026 as driller cabins, PLCs, and HMI interfaces become the practical bridge into rig automation.
- Buyers often approve controls before motors because software diagnostics can reduce troubleshooting time without pulling the top drive out of service for a long rebuild.
What supports demand for Land Rigs?
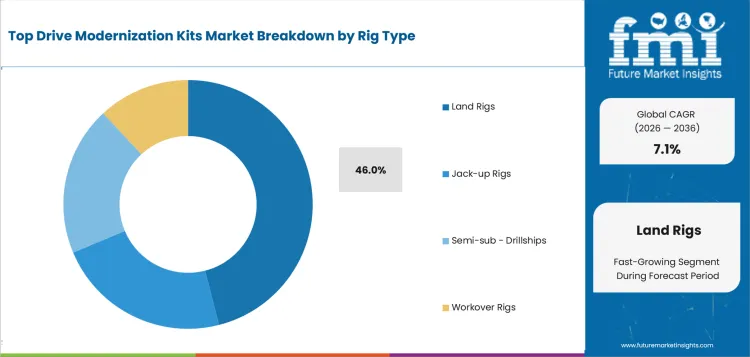
- Land Rigs are expected to hold a 46.0% share in 2026 as shale and conventional rig fleets create a large repeatable retrofit opportunity.
- Land contractors value quick installation windows since rig moves and pad schedules leave less room for long workshop rebuilds.
How do buyers evaluate Partial Upgrade within the upgrade scope category?
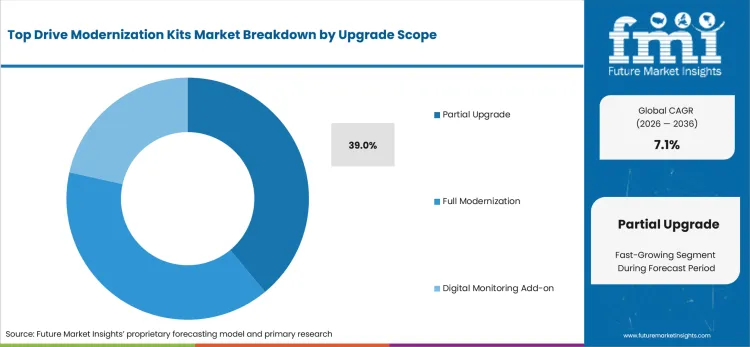
- Partial Upgrade is anticipated to represent a 39.0% share in 2026 as buyers replace controls, sensors, or interlocks before funding full modernization.
- Partial packages suit mixed fleets where older selected drives need safety and monitoring improvements but do not justify a complete motor rebuild.
What market factors influence demand for Oil & Gas Drilling?
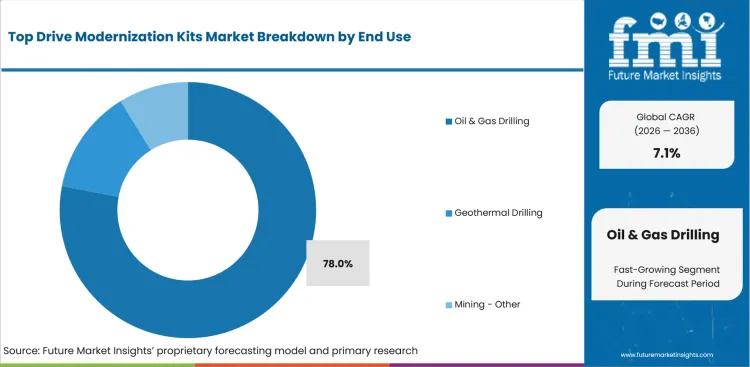
- Oil & Gas Drilling is projected to account for a 78.0% share in 2026 due to high drilling hours and heavier torque loading.
- Geothermal buyers use similar rotating equipment, but their project rhythm depends more on permits and drilling risk than routine rig fleet cycles.
How does OEM Direct affect the sales channel outlook?
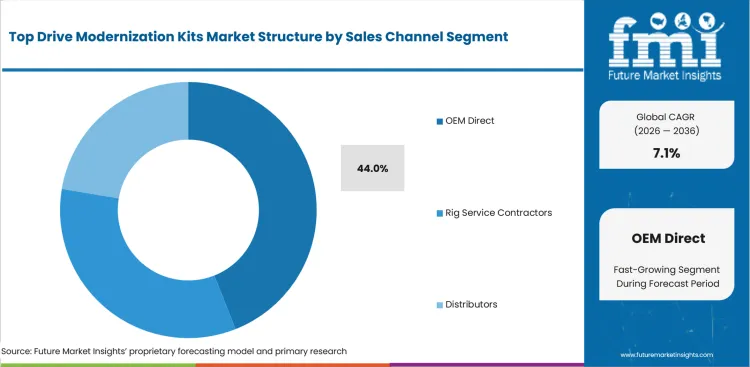
- OEM Direct is expected to represent a 44.0% share in 2026 as certified load-path upgrades and control changes need engineering sign-off.
- Rig service contractors compete well on installation speed, but OEMs gain an edge when gearbox safety factors and software compatibility must be documented.
What drives and restrains the market?
Driver: Longer wells raise top drive duty cycles, which supports torque monitoring and drive upgrade demand; restraint: The main restraint is downtime during installation as contractors lose revenue when rigs leave service; opportunity: geothermal drilling opens an opportunity for rugged upgrades that tolerate heat, vibration, and uneven project schedules.
The market reflects a balance between the identified demand driver, adoption constraints, and the supplier opportunity outlined below.
- Driver: Longer wells raise top drive duty cycles, which supports torque monitoring and drive upgrade demand.
- Restraint: The main restraint is downtime during installation as contractors lose revenue when rigs leave service.
- Opportunity: geothermal drilling opens an opportunity for rugged upgrades that tolerate heat, vibration, and uneven project schedules.
Torque Control: Retrofit Top drive modernization is driven by the need to control torque under harder drilling programs. NOV’s TDX-1500 and TDX-1250 selected drives list 105,000 ft-lb of maximum continuous torque and NOVOS readiness, which shows how torque performance and digital control are now linked. This matters for retrofit decisions because older rigs often need better control before they need full replacement. A motor upgrade without gearbox review can create fatigue risk. OEM-backed kits that address torque, controls, and mechanical margins will win repeat work from fleet owners.
Downtime Installation Risk: The main restraint is the operational cost of taking a rig out of service. Canrig product bulletins show how even focused top drive service work can involve specific inspections, function tests, and field kits. That creates a buyer concern around schedule risk. Contractors prefer modernization during planned maintenance windows or rig moves. This supports modular kits and pre-engineered upgrade packages. Suppliers that shorten commissioning time will gain share over low-cost vendors that cannot control field risk.
Which factors support expansion?
Commercial expansion is reinforced by the value, workflow, and recurring-demand factors below.
- The market is rising as rig owners use retrofit budgets to extend asset life instead of replacing complete rig packages.
- A USD 848.2 million incremental opportunity is expected as control systems and monitoring add-ons become planned maintenance items.
- Partial Upgrade demand is projected at a 39.0% share in 2026 since many contractors upgrade controls before motors.
Which country markets are included in the CAGR comparison?
The selected CAGR comparison covers China (8.0%), India (7.8%), United States (7.3%), South Korea (7.2%), and Japan (7.0%) through 2036.
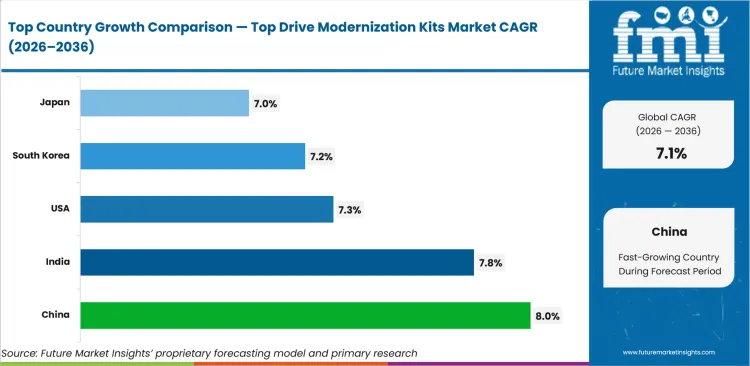
| Country | CAGR |
|---|---|
| China | 8.0% |
| India | 7.8% |
| United States | 7.3% |
| South Korea | 7.2% |
| Japan | 7.0% |
Source: Future Market Insights analysis.
How do country-level CAGRs compare?
- China (CAGR: 8.0%): Oil, gas, shale, and geothermal drilling create broad equipment demand.
- India (CAGR: 7.8%): Offshore exploration and frontier basins support deeper drilling needs.
- United States (CAGR: 7.3%): Lower 48 rig efficiency remains the key driver for top drive retrofit spending.
- South Korea (CAGR: 7.2%): Offshore exploration creates a small but high-profile demand route.
- Japan (CAGR: 7.0%): Geothermal and energy security drive niche drilling equipment demand.
The global Top Drive Modernization Kits Market is forecast to record a CAGR of 7.1% from 2026 to 2036. The study covers 30+ countries across the report regions.
How is the Top Drive Modernization Kits Market developing in China?
China is projected to record a CAGR of 8.0% through 2036. The country outlook identifies this demand signal: Oil, gas, shale, and geothermal drilling create broad equipment demand.
Country Market Snapshot
| Country | China |
|---|---|
| Forecast CAGR | 8.0% |
| Demand anchor | Oil, gas, shale, and geothermal drilling create broad equipment demand. |
| Local proof point | China produced 213 million tonnes of crude oil in 2024. |
| Supply base | Honghua offers top drive series for 2,000 m to 9,000 m drilling. |
| Application mix | Offshore, unconventional, and deep onshore wells support upgrades. |
| Restraint | Domestic suppliers create price pressure for foreign OEMs. |
| Channel signal | National oil companies shape specification and tender requirements. |
| Company context | Companies active in or serving this market include Honghua Group, BOMCO, NOV, Canrig (Nabors), and Jereh. |
Market Outlook
China is projected to record a CAGR of 8.0% through 2036 as domestic energy security pushes deeper and more complex drilling. China’s State Council reported 213 million tonnes of crude oil production and 246.4 billion cubic meters of natural gas output in 2024. It also stated that shale oil output reached 6 million tonnes in 2024. These figures explain why top drive modernization demand is tied to national supply goals and domestic drilling technology.
Key Growth Drivers
- Domestic oil and gas output policy supports drilling equipment investment.
- Unconventional wells raise demand for torque control and reliable drive systems.
- Local OEMs can package rigs, selected drives, controls, and field service together.
- Oil, gas, shale, and geothermal drilling create broad equipment demand.
Key Restraints
- Foreign suppliers face price pressure from domestic equipment groups.
- Complex state-owned procurement can lengthen qualification cycles.
- Market access depends on consistent execution across national oil company tenders and related local channels.
Country Market FAQs
What should C-suite teams prioritize in China?
C-suite teams should prioritize qualification requirements, procurement routes, local service coverage, and implementation economics before committing capital or supplier volume.
How should suppliers approach the China market?
Suppliers should align technical evidence, local channel support, and account-specific commercial terms with the buying process used by major customers in China.
What can weaken the business case in China?
Domestic suppliers create price pressure for foreign OEMs. Executives should test this exposure during supplier, investment, and rollout reviews.
How is the Top Drive Modernization Kits Market developing in India?
India is projected to record a CAGR of 7.8% through 2036. The country outlook identifies this demand signal: Offshore exploration and frontier basins support deeper drilling needs.
Country Market Snapshot
| Country | India |
|---|---|
| Forecast CAGR | 7.8% |
| Demand anchor | Offshore exploration and frontier basins support deeper drilling needs. |
| Local proof point | India opened nearly one million square kilometres of former no-go offshore areas. |
| Buyer structure | ONGC and Oil India influence exploration-related equipment demand. |
| Application mix | Offshore and deepwater campaigns are more relevant to modernization growth. |
| Restraint | Commercial discoveries must follow exploration before fleet upgrades scale. |
| Channel signal | Public-sector tenders shape qualification and pricing pressure. |
| Company context | Companies active in or serving this market include NOV, Canrig (Nabors), BENTEC, Drillmec, and HMH. |
Market Outlook
India is forecast to grow at a CAGR of 7.8% through 2036 as offshore exploration raises demand for reliable rig equipment. India’s petroleum ministry reported in July 2025 that nearly one million square kilometres of former no-go offshore areas had been opened in 2022. The ministry also reported 172 hydrocarbon discoveries since 2015, including 62 offshore discoveries. This supports demand for top drive upgrades tied to deeper and more complex drilling programs.
Key Growth Drivers
- Offshore frontier opening creates demand for high-reliability rig equipment.
- Deepwater wells raise the value of torque and load monitoring systems.
- Public-sector drilling campaigns create repeatable tender opportunities.
- Offshore exploration and frontier basins support deeper drilling needs.
Key Restraints
- Tender price pressure can favor lower-cost packages over full modernization.
- Exploration outcomes must justify broader rig upgrade programs.
- Commercial discoveries must follow exploration before fleet upgrades scale.
Country Market FAQs
What should C-suite teams prioritize in India?
C-suite teams should prioritize qualification requirements, procurement routes, local service coverage, and implementation economics before committing capital or supplier volume.
How should suppliers approach the India market?
Suppliers should align technical evidence, local channel support, and account-specific commercial terms with the buying process used by major customers in India.
What can weaken the business case in India?
Commercial discoveries must follow exploration before fleet upgrades scale. Executives should test this exposure during supplier, investment, and rollout reviews.
How is the Top Drive Modernization Kits Market developing in the United States?
The United States is projected to record a CAGR of 7.3% through 2036. The country outlook identifies this demand signal: Lower 48 rig efficiency remains the key driver for top drive retrofit spending.
Country Market Snapshot
| Country | United States |
|---|---|
| Forecast CAGR | 7.3% |
| Demand anchor | Lower 48 rig efficiency remains the key driver for top drive retrofit spending. |
| Buyer behavior | Shale contractors prioritize kits that protect uptime during longer lateral drilling. |
| Channel route | OEM direct sales and rig service contractors dominate high-spec retrofit work. |
| Application mix | Oil and gas drilling remains stronger than geothermal and mining demand. |
| Restraint | Lower oil prices can delay non-essential motor upgrades. |
| Supply signal | NOV and Canrig have visible top drive portfolios for US buyers. |
| Company context | Companies active in or serving this market include NOV, Canrig (Nabors), HMH, Drillmec, and Warrior Rig Technologies. |
Market Outlook
The United States is projected to record a CAGR of 7.3% through 2036 as drilling contractors focus on rig productivity rather than fleet expansion. EIA reported 517 Lower 48 oil and gas rigs in October 2025 and record output levels in 2025 despite fewer rigs. This supports modernization because every active rig has to deliver more output from tighter schedules. Buyers want top drive kits that reduce unplanned failures and improve torque control. US demand behaves like a productivity market.
Key Growth Drivers
- Permian and Appalachian drilling programs reward better torque control on high-utilization rigs.
- Shale operators prefer retrofit kits that fit existing rig floors and reduce service disruption.
- Automation platforms create pull-through demand for control and digital monitoring kits.
- Lower 48 rig efficiency remains the key driver for top drive retrofit spending.
Key Restraints
- Lower crude pricing can delay capital upgrades that are not tied to immediate uptime.
- Mixed rig fleets create compatibility problems for standardized kit programs.
- Lower oil prices can delay non-essential motor upgrades.
Country Market FAQs
What should C-suite teams prioritize in the United States?
C-suite teams should prioritize qualification requirements, procurement routes, local service coverage, and implementation economics before committing capital or supplier volume.
How should suppliers approach the United States market?
Suppliers should align technical evidence, local channel support, and account-specific commercial terms with the buying process used by major customers in the United States.
What can weaken the business case in the United States?
Lower oil prices can delay non-essential motor upgrades. Executives should test this exposure during supplier, investment, and rollout reviews.
How is the Top Drive Modernization Kits Market developing in South Korea?
South Korea is projected to record a CAGR of 7.2% through 2036. The country outlook identifies this demand signal: Offshore exploration creates a small but high-profile demand route.
Country Market Snapshot
| Country | South Korea |
|---|---|
| Forecast CAGR | 7.2% |
| Demand anchor | Offshore exploration creates a small but high-profile demand route. |
| Local proof point | South Korea approved East Sea exploratory drilling in June 2024. |
| Buyer structure | Korea National Oil Corporation is central to offshore exploration activity. |
| Application mix | Semi-sub and drillship work is more relevant than land rigs. |
| Restraint | Early drilling results can weaken follow-on investment. |
| Channel signal | Global offshore contractors influence top drive supplier choice. |
| Company context | Companies active in or serving this market include HD Hyundai Heavy Industries, NOV, HMH, Canrig (Nabors), and BENTEC. |
Market Outlook
South Korea is expected to record a CAGR of 7.2% through 2036 as offshore exploration creates selective demand for high-spec rig equipment. Reuters reported in June 2024 that South Korea approved exploratory drilling for potential East Sea oil and gas resources, with an estimated project cost above 500 billion won. The same report noted that up to 10 wells could be needed. This creates a possible demand route for top drive upgrades on offshore rigs.
Key Growth Drivers
- East Sea exploration creates demand for offshore-ready rotating and monitoring systems.
- LNG import dependence supports interest in domestic resource appraisal.
- Korean shipbuilding and offshore engineering capability supports project execution.
- Offshore exploration creates a small but high-profile demand route.
Key Restraints
- Exploration risk can stop upgrades after early appraisal wells.
- Operators may depend on imported top-drive components and specialist field-service support.
- Early drilling results can weaken follow-on investment.
Country Market FAQs
What should C-suite teams prioritize in South Korea?
C-suite teams should prioritize qualification requirements, procurement routes, local service coverage, and implementation economics before committing capital or supplier volume.
How should suppliers approach the South Korea market?
Suppliers should align technical evidence, local channel support, and account-specific commercial terms with the buying process used by major customers in South Korea.
What can weaken the business case in South Korea?
Early drilling results can weaken follow-on investment. Executives should test this exposure during supplier, investment, and rollout reviews.
How is the Top Drive Modernization Kits Market developing in Japan?
Japan is projected to record a CAGR of 7.0% through 2036. The country outlook identifies this demand signal: Geothermal and energy security drive niche drilling equipment demand.
Country Market Snapshot
| Country | Japan |
|---|---|
| Forecast CAGR | 7.0% |
| Demand anchor | Geothermal and energy security drive niche drilling equipment demand. |
| Local proof point | Japan added 22.5 MW of geothermal units in 2024. |
| Policy context | Japan’s 2025 energy plan keeps LNG and geothermal relevant. |
| Application mix | Geothermal drilling is more relevant than domestic oil drilling. |
| Restraint | Mountainous sites and social acceptance slow geothermal wells. |
| Channel signal | Engineering firms influence supplier choice on complex projects. |
| Company context | Companies active in or serving this market include NOV, HMH, Canrig (Nabors), BENTEC, and Drillmec. |
Market Outlook
Japan is projected to grow at a CAGR of 7.0% through 2036 as geothermal and energy security work support specialized drilling needs. REN21 reported that Japan added three geothermal power units in 2024 with 22.5 MW of capacity, while total geothermal nameplate capacity stayed near 0.5 GW. The slow addition rate shows why modernization demand is selective. Buyers value reliability and compact integration over volume buying. Japanese demand is shaped by difficult sites and long development cycles.
Key Growth Drivers
- Geothermal projects create demand for reliable drilling systems in mountainous terrain.
- Energy security policy keeps domestic renewable heat and power options visible.
- Engineering-led project delivery favors certified and documented equipment packages.
- Geothermal and energy security drive niche drilling equipment demand.
Key Restraints
- Long project timelines reduce annual order volume.
- Onsen concerns and local acceptance issues can slow geothermal drilling.
- Mountainous sites and social acceptance slow geothermal wells.
Country Market FAQs
What should C-suite teams prioritize in Japan?
C-suite teams should prioritize qualification requirements, procurement routes, local service coverage, and implementation economics before committing capital or supplier volume.
How should suppliers approach the Japan market?
Suppliers should align technical evidence, local channel support, and account-specific commercial terms with the buying process used by major customers in Japan.
What can weaken the business case in Japan?
Mountainous sites and social acceptance slow geothermal wells. Executives should test this exposure during supplier, investment, and rollout reviews.
Which companies are discussed in the Top Drive Modernization Kits Market?
The preview discusses NOV, Canrig, BENTEC, Drillmec, and Honghua Group among the companies active in this market.
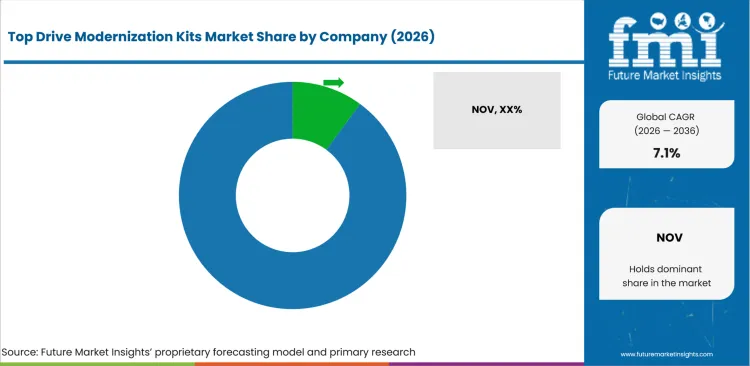
The market is moderately concentrated as OEMs control safety-critical upgrade design and legacy drawings. NOV and Canrig hold strong positions through broad top drive portfolios and control integration depth. BENTEC, Drillmec, Honghua, and HMH compete with integrated rig packages and regional service strength.
Specialist service firms win installation work when OEM engineering has already approved the upgrade. Entry barriers include load-path engineering, safety certification, software compatibility, and field service coverage. Competition in this market starts with the installed equipment history.
How is competition structured?
Competition reflects differences in specialization, portfolio scope, geographic reach, evidence, and customer access.
The competitive structure is best viewed by supplier role and retrofit capability.
- Integrated OEMs: NOV, Canrig, HMH, and Drillmec compete on top drive portfolios, controls integration, and offshore or land rig compatibility. NOV has the broadest visible tonnage range and NOVOS-enabled models. Canrig links top drive hardware with SmartROS controls and diagnostics.
- Rig Equipment Integrators: BENTEC and Honghua Group compete through broader rig equipment packages that include selected drives, controls, power systems, and field service. BENTEC adds digital drilling tools and top drive VFD containers.
- Legacy and Specialist Service Routes: Tesco equipment under Nabors remains relevant through legacy top drive fleets, parts needs, and service channels. Rig service contractors and distributors compete where buyers need installation, spare parts, and commissioning support after OEM engineering approval.
How do selected companies compare?
The selected companies differ in portfolio focus, geographic reach, evidence depth, and channel strength.
| Company | Competitive position |
|---|---|
| NOV | NOV is assessed for drilling-system compatibility, installed-base support, field service, and upgrade capability. |
| Canrig (Nabors) | Canrig (Nabors) is assessed for drilling-system compatibility, installed-base support, field service, and upgrade capability. |
| BENTEC | BENTEC is assessed for drilling-system compatibility, installed-base support, field service, and upgrade capability. |
| Drillmec | Drillmec is assessed for drilling-system compatibility, installed-base support, field service, and upgrade capability. |
| Honghua Group | Honghua Group is assessed for drilling-system compatibility, installed-base support, field service, and upgrade capability. |
What are the key developments in the Top Drive Modernization Kits Market?
- In August 2024, Canrig published its top-drive portfolio with SmartROS controls, the Advanced Diagnostics System, and hydraulic torque-boost options. These features support control, sensor, and performance upgrades for installed fleets.
- In December 2024, the Canrig Sigma Top Drive received a Special Meritorious Award for Engineering Innovation. The recognition reinforced demand for higher-capacity and lower-maintenance top-drive technology.
- In February 2025, Nabors reported that Canrig had secured a comprehensive U.S. rig-upgrade package from a third-party drilling contractor. The award directly supports modernization-kit and retrofit demand.
Selected Companies in the Top Drive Modernization Kits Market
Companies referenced in this preview
- NOV.
- Canrig (Nabors).
- BENTEC.
- Drillmec.
- Honghua Group.
- HMH.
- BOMCO.
- Warrior Rig Technologies.
Market Scope & Definition
| Metric | Value |
|---|---|
| Market definition | The Top Drive Modernization Kits Market covers upgrade kits used to improve existing Top Drive systems on drilling rigs. Included products are control system kits, motor and drive packages, torque and load monitoring kits, and safety interlock kits. |
| Functions covered | Control System Upgrade Kits, Motor / Drive Upgrade Kits, Torque / Load Monitoring Kits, Safety Interlock Kits |
| End-use industries | Oil & Gas Drilling, Geothermal Drilling, Mining / Other |
| Inclusions | Market scope covers commercially sold top drive upgrade kits across kit types, rig types, upgrade scopes, end uses, sales channels, and the selected country set from 2026 to 2036. |
| Exclusions | The scope excludes new complete top drive systems, full rig newbuild packages, non-selected-drive drawworks upgrades, drilling fluids, downhole tools, and general oilfield repair services. |
Research Methodology
| Metric | Value |
|---|---|
| Primary Research | FMI analysts reviewed buyer input from drilling contractors, rig service firms, oilfield equipment suppliers, and field maintenance teams. Interviews focused on retrofit triggers, downtime tolerance, safety interlock requirements, and channel choice. |
| Desk Research | reviewed company product literature, drilling automation references, rig equipment standards, national drilling activity data, and upstream energy policy signals. Product boundaries were checked against top drive equipment portfolios from verified suppliers. |
| Market Sizing and Forecasting | The model combined top drive retrofit volume, average kit value, service intensity, rig type mix, and country-level drilling activity. Forecasts were adjusted for partial upgrade cycles, full modernization timing, and digital monitoring attachment rates. |
| Data Validation | Forecasts were checked against adjacent rotary drilling rigs, digital oilfield spending, and drilling service activity. Company portfolios were cross-referenced to avoid including adjacent suppliers without direct top drive relevance. |
What does the report cover?
The report covers kit type, rig type, upgrade scope, end use, sales channel, and region across the 2026-2036 forecast period in 30+ countries.
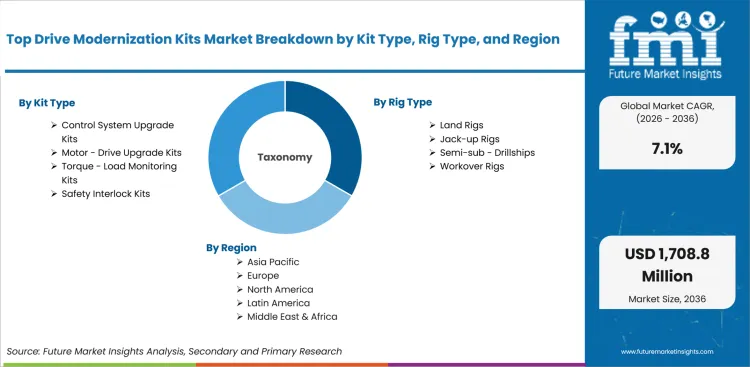
| Metric | Value |
|---|---|
| Periods | Base year 2025; estimated year 2026; forecast period 2026-2036 |
| Segment axes | kit type, rig type, upgrade scope, end use, sales channel, and region |
| Regions | North America, Western Europe, East Asia, South Asia and Pacific |
| Countries | United States, United Kingdom, Germany, France, Japan, China, South Korea, India and 30+ countries |
| Companies | NOV, Canrig (Nabors), BENTEC, Drillmec, Honghua Group, HMH, BOMCO, Warrior Rig Technologies, and others |
| Approach | Hybrid bottom-up and top-down methodology using rig retrofit demand, kit pricing, country activity, and supplier portfolio checks. |
Market Segmentation Analysis
Segmented by Kit Type
- Control System Upgrade Kits.
- Motor / Drive Upgrade Kits.
- Torque / Load Monitoring Kits.
- Safety Interlock Kits.
Segmented by Rig Type
- Land Rigs.
- Jack-up Rigs.
- Semi-sub / Drillships.
- Workover Rigs.
Segmented by Upgrade Scope
- Partial Upgrade.
- Full Modernization.
- Digital Monitoring Add-on.
Segmented by End Use
- Oil & Gas Drilling.
- Geothermal Drilling.
- Mining / Other.
Segmented by Sales Channel
- OEM Direct.
- Rig Service Contractors.
- Distributors.
By Region
- North America.
- United States.
- Western Europe.
- Germany.
- France.
- East Asia.
- China.
- Japan.
- South Korea.
- South Asia and Pacific.
- India.
Research Sources and Bibliography
- U.S. Energy Information Administration. (2025, November 17). U.S. rig counts remain low as production efficiencies improve. https://www.eia.gov/todayinenergy/detail.php?id=66645
- North Sea Transition Authority. (2026, April 3). Wells data and UK drilling activity. https://www.nstauthority.co.uk/data-and-insights/data/themes/wells/
- North Sea Transition Authority. (2025). Wells: Exploration and production. https://www.nstauthority.co.uk/regulatory-information/exploration-and-production/wells/
- Press Information Bureau of India. (2025, July 29). India witnesses renewed spurt in oil and gas exploration. https://www.pib.gov.in/PressReleasePage.aspx? PRID=2149686
- Federal Ministry for Economic Affairs and Climate Action. (2025, January). Deep geothermal energy. https://d-eiti.de/en/report/tiefe-geothermie/
- Bonte, D., Maragna, C., Hamm, V., Maurel, C., Stopin, A., Dezayes, C., & Sanjuan, B. (2026). Geothermal energy in France: A snapshot in 2025. EGU General Assembly 2026. https://doi.org/10.5194/egusphere-egu26-22050
- REN21. (2025). GSR 2025: Geothermal. https://www.ren21.net/gsr-2025/technologies/geothermal/
- State Council of the People’s Republic of China. (2025, January 28). China’s oil, gas output exceeds 400 million tonnes for first time. https://english.www.gov.cn/archive/statistics/202501/28/content_WS6798b145c6d0868f4e8ef3e6.html
- Reuters. (2024, June 3). South Korea’s Yoon says vast amount of oil, gas reserve possible off east coast. https://www.reuters.com/world/asia-pacific/skoreas-yoon-says-vast-amount-oil-gas-reserve-possible-off-east-coast-2024-06-03/
- NOV. (2024). Top Drive Technologies. https://assets.nov.com/NCP4N68N/at/r9c6wnqwhj3wtc8j24kpgwk/240776-EE-RE-Topdrive_Brochure-BRCH-WEB.pdf
- NOV. (2026). Top Drive Systems. https://www.nov.com/products/top-drive-systems
- Canrig. (2024). Top Drives. https://www.canrig.com/wp-content/uploads/2024/08/BRCHTopDrive2024_FINAL.pdf
- Nabors Industries. (2024, December 6). Predictive Drilling and Canrig Sigma Top Drive win 2024 engineering innovation awards. Nabors Industries.
- Nabors Industries. (2025, February 12). Nabors announces fourth-quarter 2024 results. Nabors Industries.
- BENTEC. (2026). Digital solutions for drilling performance. https://bentec.com/what-we-do/drilling-technologies/digital-solutions/
- HMH. (2026). MH Top Drives Offshore. https://hmhw.com/service/top-drives-offshore/
The bibliography is provided for reader reference and uses primary company, government, regulatory, trade body, or technical publications wherever available.
This Report Answers
- What is the projected value of the Top Drive Modernization Kits Market in 2026?
- What value is forecast for the Top Drive Modernization Kits Market by 2036?
- What CAGR is forecast for the Top Drive Modernization Kits Market from 2026 to 2036?
- What 2026 share is projected for Control System Upgrade Kits within the kit type category?
- What 2026 share is projected for Land Rigs within the rig type category?
- Which demand factors support the Top Drive Modernization Kits Market outlook?
- Which restraints and opportunities affect adoption in the Top Drive Modernization Kits Market?
- How are country CAGR outlooks, including China at 8.0%, compared?
- Which companies and product developments are covered in the competitive analysis?
- What is included in the market scope, and how is the forecast validated?
Frequently Asked Questions
Why should executives track the Top Drive Modernization Kits Market?
Executives should track this market because it can affect capital allocation, supplier strategy, operating risk, and competitive positioning across commercial planning cycles.
What business problem does the Top Drive Modernization Kits Market address?
It helps executive teams judge where customer pain, supplier capability, compliance exposure, and implementation economics justify investment, procurement, or portfolio action.
What should procurement leaders evaluate before selecting suppliers?
Procurement leaders should assess evidence quality, integration fit, service coverage, compliance readiness, total cost of ownership, and supplier execution capability.
What can limit return on investment for buyers?
Return on investment can be limited by low utilization, integration delays, training gaps, unclear ownership, pricing pressure, or weak fit with existing workflows.
How can suppliers build executive confidence?
Suppliers can build confidence by proving implementation speed, risk reduction, support depth, reference use cases, and measurable outcomes for budget owners.
Preview the report firsthand - request a free sample
Get SampleGet the brochure for pricing and purchase details.
Get PDFTable of Content
- Key Takeaways
- Market Size and CAGR
- Top Growth Driver
- Fastest Growing Segment
- Leading Region
- Key Companies
- Emerging Opportunities
- Executive Summary
- Global Market Outlook
- Demand-side Trends
- Supply-side Trends
- Technology Roadmap Analysis
- Analysis and Recommendations
- Analyst Perspective (What is happening? Why now? What should investors know?)
- Key Questions Answered
- How large is the market?
- What is the CAGR?
- What are key trends?
- Which region dominates?
- Who are the leaders?
- Market Overview
- Market Coverage / Taxonomy
- Market Definition / Scope / Limitations
- Research Methodology
- Chapter Orientation
- Analytical Lens and Working Hypotheses
- Market Structure, Signals, and Trend Drivers
- Benchmarking and Cross-market Comparability
- Market Sizing, Forecasting, and Opportunity Mapping
- Research Design and Evidence Framework
- Desk Research Programme (Secondary Evidence)
- Expert Input and Fieldwork (Primary Evidence)
- Tooling, Models, and Reference Databases
- Data Engineering and Model Build
- Quality Assurance and Audit Trail
- Market Background
- Market Dynamics (Drivers, Restraints, Opportunity, Trends)
- Scenario Forecast (Optimistic, Likely, Conservative)
- Impact Analysis
- AI Impact
- Sustainability Impact
- Regulatory Impact
- Technology Impact
- Consumer / Buyer Analysis
- Purchase Drivers
- Adoption Barriers
- Buyer Journey
- Opportunity Map Analysis
- Product Life Cycle Analysis
- Supply Chain Analysis
- Investment Feasibility Matrix
- Value Chain Analysis
- PESTLE and Porter's Analysis
- Regulatory Landscape
- Regional Parent Market Outlook
- Production and Consumption Statistics
- Import and Export Statistics
- Global Market Analysis and Forecast, 2021 to 2036
- Historical Market Size Value (USD Million) & Volume (Unit) Analysis, 2021 to 2025
- Current and Future Market Size Value (USD Million) & Volume (Unit) Projections, 2026 to 2036
- Y-o-Y Growth Trend Analysis
- Absolute $ Opportunity Analysis
- Global Market Pricing Analysis, 2021 to 2036
- Global Market Analysis and Forecast, By Kit Type, 2021 to 2036
- Introduction / Key Findings
- Historical Market Size Value (USD Million) & Volume (Unit) Analysis By Kit Type, 2021 to 2025
- Current and Future Market Size Value (USD Million) & Volume (Unit) Analysis and Forecast By Kit Type, 2026 to 2036
- Control System Upgrade Kits
- Motor - Drive Upgrade Kits
- Torque - Load Monitoring Kits
- Safety Interlock Kits
- Control System Upgrade Kits
- Y-o-Y Growth Trend Analysis By Kit Type, 2021 to 2025
- Absolute $ Opportunity Analysis By Kit Type, 2026 to 2036
- Global Market Analysis and Forecast, By Rig Type, 2021 to 2036
- Introduction / Key Findings
- Historical Market Size Value (USD Million) & Volume (Unit) Analysis By Rig Type, 2021 to 2025
- Current and Future Market Size Value (USD Million) & Volume (Unit) Analysis and Forecast By Rig Type, 2026 to 2036
- Land Rigs
- Jack-up Rigs
- Semi-sub - Drillships
- Workover Rigs
- Land Rigs
- Y-o-Y Growth Trend Analysis By Rig Type, 2021 to 2025
- Absolute $ Opportunity Analysis By Rig Type, 2026 to 2036
- Global Market Analysis and Forecast, By Upgrade Scope, 2021 to 2036
- Introduction / Key Findings
- Historical Market Size Value (USD Million) & Volume (Unit) Analysis By Upgrade Scope, 2021 to 2025
- Current and Future Market Size Value (USD Million) & Volume (Unit) Analysis and Forecast By Upgrade Scope, 2026 to 2036
- Partial Upgrade
- Full Modernization
- Digital Monitoring Add-on
- Partial Upgrade
- Y-o-Y Growth Trend Analysis By Upgrade Scope, 2021 to 2025
- Absolute $ Opportunity Analysis By Upgrade Scope, 2026 to 2036
- Global Market Analysis and Forecast, By End Use, 2021 to 2036
- Introduction / Key Findings
- Historical Market Size Value (USD Million) & Volume (Unit) Analysis By End Use, 2021 to 2025
- Current and Future Market Size Value (USD Million) & Volume (Unit) Analysis and Forecast By End Use, 2026 to 2036
- Oil & Gas Drilling
- Geothermal Drilling
- Mining - Other
- Oil & Gas Drilling
- Y-o-Y Growth Trend Analysis By End Use, 2021 to 2025
- Absolute $ Opportunity Analysis By End Use, 2026 to 2036
- Global Market Analysis and Forecast, By Sales Channel, 2021 to 2036
- Introduction / Key Findings
- Historical Market Size Value (USD Million) & Volume (Unit) Analysis By Sales Channel, 2021 to 2025
- Current and Future Market Size Value (USD Million) & Volume (Unit) Analysis and Forecast By Sales Channel, 2026 to 2036
- OEM Direct
- Rig Service Contractors
- Distributors
- OEM Direct
- Y-o-Y Growth Trend Analysis By Sales Channel, 2021 to 2025
- Absolute $ Opportunity Analysis By Sales Channel, 2026 to 2036
- Global Market Analysis and Forecast, By Region, 2021 to 2036
- Introduction
- Historical Market Size Value (USD Million) & Volume (Unit) Analysis By Region, 2021 to 2025
- Current Market Size Value (USD Million) & Volume (Unit) Analysis and Forecast By Region, 2026 to 2036
- North America
- Latin America
- Western Europe
- Eastern Europe
- East Asia
- South Asia and Pacific
- Middle East & Africa
- Market Attractiveness Analysis By Region
- North America Market Analysis and Forecast, By Country, 2021 to 2036
- Historical Market Size Value (USD Million) & Volume (Unit) Trend Analysis By Market Taxonomy, 2021 to 2025
- Market Size Value (USD Million) & Volume (Unit) Forecast By Market Taxonomy, 2026 to 2036
- By Country
- USA
- Canada
- Mexico
- By Kit Type
- By Rig Type
- By Upgrade Scope
- By End Use
- By Sales Channel
- By Country
- Market Attractiveness Analysis
- By Country
- By Kit Type
- By Rig Type
- By Upgrade Scope
- By End Use
- By Sales Channel
- Key Takeaways
- Latin America Market Analysis and Forecast, By Country
- Historical Market Size Value (USD Million) & Volume (Unit) Trend Analysis By Market Taxonomy, 2021 to 2025
- Market Size Value (USD Million) & Volume (Unit) Forecast By Market Taxonomy, 2026 to 2036
- By Country
- Brazil
- Chile
- Rest of Latin America
- By Kit Type
- By Rig Type
- By Upgrade Scope
- By End Use
- By Sales Channel
- By Country
- Market Attractiveness Analysis
- By Country
- By Kit Type
- By Rig Type
- By Upgrade Scope
- By End Use
- By Sales Channel
- Key Takeaways
- Western Europe Market Analysis and Forecast, By Country
- Historical Market Size Value (USD Million) & Volume (Unit) Trend Analysis By Market Taxonomy, 2021 to 2025
- Market Size Value (USD Million) & Volume (Unit) Forecast By Market Taxonomy, 2026 to 2036
- By Country
- Germany
- UK
- Italy
- Spain
- France
- Nordic
- BENELUX
- Rest of Western Europe
- By Kit Type
- By Rig Type
- By Upgrade Scope
- By End Use
- By Sales Channel
- By Country
- Market Attractiveness Analysis
- By Country
- By Kit Type
- By Rig Type
- By Upgrade Scope
- By End Use
- By Sales Channel
- Key Takeaways
- Eastern Europe Market Analysis and Forecast, By Country
- Historical Market Size Value (USD Million) & Volume (Unit) Trend Analysis By Market Taxonomy, 2021 to 2025
- Market Size Value (USD Million) & Volume (Unit) Forecast By Market Taxonomy, 2026 to 2036
- By Country
- Russia
- Poland
- Hungary
- Balkan & Baltic
- Rest of Eastern Europe
- By Kit Type
- By Rig Type
- By Upgrade Scope
- By End Use
- By Sales Channel
- By Country
- Market Attractiveness Analysis
- By Country
- By Kit Type
- By Rig Type
- By Upgrade Scope
- By End Use
- By Sales Channel
- Key Takeaways
- East Asia Market Analysis and Forecast, By Country
- Historical Market Size Value (USD Million) & Volume (Unit) Trend Analysis By Market Taxonomy, 2021 to 2025
- Market Size Value (USD Million) & Volume (Unit) Forecast By Market Taxonomy, 2026 to 2036
- By Country
- China
- Japan
- South Korea
- By Kit Type
- By Rig Type
- By Upgrade Scope
- By End Use
- By Sales Channel
- By Country
- Market Attractiveness Analysis
- By Country
- By Kit Type
- By Rig Type
- By Upgrade Scope
- By End Use
- By Sales Channel
- Key Takeaways
- South Asia and Pacific Market Analysis and Forecast, By Country
- Historical Market Size Value (USD Million) & Volume (Unit) Trend Analysis By Market Taxonomy, 2021 to 2025
- Market Size Value (USD Million) & Volume (Unit) Forecast By Market Taxonomy, 2026 to 2036
- By Country
- India
- ASEAN
- Australia & New Zealand
- Rest of South Asia and Pacific
- By Kit Type
- By Rig Type
- By Upgrade Scope
- By End Use
- By Sales Channel
- By Country
- Market Attractiveness Analysis
- By Country
- By Kit Type
- By Rig Type
- By Upgrade Scope
- By End Use
- By Sales Channel
- Key Takeaways
- Middle East & Africa Market Analysis and Forecast, By Country
- Historical Market Size Value (USD Million) & Volume (Unit) Trend Analysis By Market Taxonomy, 2021 to 2025
- Market Size Value (USD Million) & Volume (Unit) Forecast By Market Taxonomy, 2026 to 2036
- By Country
- Kingdom of Saudi Arabia
- Other GCC Countries
- Türkiye
- South Africa
- Other African Union
- Rest of Middle East & Africa
- By Kit Type
- By Rig Type
- By Upgrade Scope
- By End Use
- By Sales Channel
- By Country
- Market Attractiveness Analysis
- By Country
- By Kit Type
- By Rig Type
- By Upgrade Scope
- By End Use
- By Sales Channel
- Key Takeaways
- Key Countries Market Analysis
- USA
- Pricing Analysis
- Market Share Analysis, 2025
- By Kit Type
- By Rig Type
- By Upgrade Scope
- By End Use
- By Sales Channel
- Canada
- Pricing Analysis
- Market Share Analysis, 2025
- By Kit Type
- By Rig Type
- By Upgrade Scope
- By End Use
- By Sales Channel
- Mexico
- Pricing Analysis
- Market Share Analysis, 2025
- By Kit Type
- By Rig Type
- By Upgrade Scope
- By End Use
- By Sales Channel
- Brazil
- Pricing Analysis
- Market Share Analysis, 2025
- By Kit Type
- By Rig Type
- By Upgrade Scope
- By End Use
- By Sales Channel
- Chile
- Pricing Analysis
- Market Share Analysis, 2025
- By Kit Type
- By Rig Type
- By Upgrade Scope
- By End Use
- By Sales Channel
- Germany
- Pricing Analysis
- Market Share Analysis, 2025
- By Kit Type
- By Rig Type
- By Upgrade Scope
- By End Use
- By Sales Channel
- UK
- Pricing Analysis
- Market Share Analysis, 2025
- By Kit Type
- By Rig Type
- By Upgrade Scope
- By End Use
- By Sales Channel
- Italy
- Pricing Analysis
- Market Share Analysis, 2025
- By Kit Type
- By Rig Type
- By Upgrade Scope
- By End Use
- By Sales Channel
- Spain
- Pricing Analysis
- Market Share Analysis, 2025
- By Kit Type
- By Rig Type
- By Upgrade Scope
- By End Use
- By Sales Channel
- France
- Pricing Analysis
- Market Share Analysis, 2025
- By Kit Type
- By Rig Type
- By Upgrade Scope
- By End Use
- By Sales Channel
- India
- Pricing Analysis
- Market Share Analysis, 2025
- By Kit Type
- By Rig Type
- By Upgrade Scope
- By End Use
- By Sales Channel
- ASEAN
- Pricing Analysis
- Market Share Analysis, 2025
- By Kit Type
- By Rig Type
- By Upgrade Scope
- By End Use
- By Sales Channel
- Australia & New Zealand
- Pricing Analysis
- Market Share Analysis, 2025
- By Kit Type
- By Rig Type
- By Upgrade Scope
- By End Use
- By Sales Channel
- China
- Pricing Analysis
- Market Share Analysis, 2025
- By Kit Type
- By Rig Type
- By Upgrade Scope
- By End Use
- By Sales Channel
- Japan
- Pricing Analysis
- Market Share Analysis, 2025
- By Kit Type
- By Rig Type
- By Upgrade Scope
- By End Use
- By Sales Channel
- South Korea
- Pricing Analysis
- Market Share Analysis, 2025
- By Kit Type
- By Rig Type
- By Upgrade Scope
- By End Use
- By Sales Channel
- Russia
- Pricing Analysis
- Market Share Analysis, 2025
- By Kit Type
- By Rig Type
- By Upgrade Scope
- By End Use
- By Sales Channel
- Poland
- Pricing Analysis
- Market Share Analysis, 2025
- By Kit Type
- By Rig Type
- By Upgrade Scope
- By End Use
- By Sales Channel
- Hungary
- Pricing Analysis
- Market Share Analysis, 2025
- By Kit Type
- By Rig Type
- By Upgrade Scope
- By End Use
- By Sales Channel
- Kingdom of Saudi Arabia
- Pricing Analysis
- Market Share Analysis, 2025
- By Kit Type
- By Rig Type
- By Upgrade Scope
- By End Use
- By Sales Channel
- Türkiye
- Pricing Analysis
- Market Share Analysis, 2025
- By Kit Type
- By Rig Type
- By Upgrade Scope
- By End Use
- By Sales Channel
- South Africa
- Pricing Analysis
- Market Share Analysis, 2025
- By Kit Type
- By Rig Type
- By Upgrade Scope
- By End Use
- By Sales Channel
- USA
- Market Structure Analysis
- Competition Dashboard
- Competition Benchmarking
- Market Share Analysis of Top Players
- By Regional
- By Kit Type
- By Rig Type
- By Upgrade Scope
- By End Use
- By Sales Channel
- Emerging Startups
- Innovation Benchmarking
- Competition Analysis
- Competition Deep Dive
- NOV
- Overview
- Product Portfolio
- Profitability by Market Segments (Product/Region/Sales Channel)
- Sales Footprint
- Strategy Overview
- Marketing Strategy
- Product Strategy
- Channel Strategy
- Canrig (Nabors)
- BENTEC
- Drillmec
- Honghua Group
- HMH
- BOMCO
- Warrior Rig Technologies
- NOV
- Case Studies
- Success Stories
- Recent Developments
- Competition Deep Dive
- Assumptions & Acronyms Used


