

- Market Size (2026)
- USD 1470.4 Mn
- Forecast (2036)
- USD 2374.1 Mn
- CAGR (2026 to 2036)
- 4.9%
How big is Paraffin Control Additives Market in 2026?
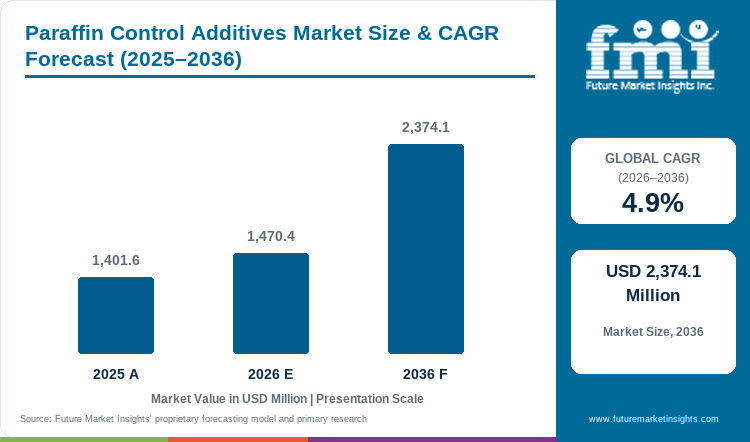
USD 1,470.4 million in 2026 and USD 2,374.1 million by 2036, expanding at 4.9% CAGR.
Sales of paraffin control additives are estimated to rise at 4.9% CAGR through 2036. Valuation increases from USD 1,401.6 million in 2025 to USD 1,470.4 million in 2026 and reaches USD 2,374.1 million by 2036. Crude oils do not all form wax in the same way. Wax distribution and thermal history can change how crude moves. A March 2026 Energy & Fuels study tested an EVA-based nanocomposite pour point depressant in waxy crude. The study found a lower pour point and a lower pressure-drop gradient. Operators use representative samples to set a field dose. They then ask whether fewer flow limits and interventions can offset the recurring chemical cost.
Countries face different wax risks because they use crude in different ways. The Canada Energy Regulator reported 5.35 million barrels per day of crude oil and equivalents in 2025. Cold weather and long routes test wax-control products across Canada. South Korea relies more on imported crude than on local oil output. Much of that crude moves through storage and refinery-feed transfer systems. Korea National Oil Corporation manages stockpiling bases for crude reserves. In both countries, teams must match the treatment to the crude and the minimum operating temperature.
Key Takeaways
- Wax-control demand comes from the need to avoid pressure loss and costly intervention as crude cools.
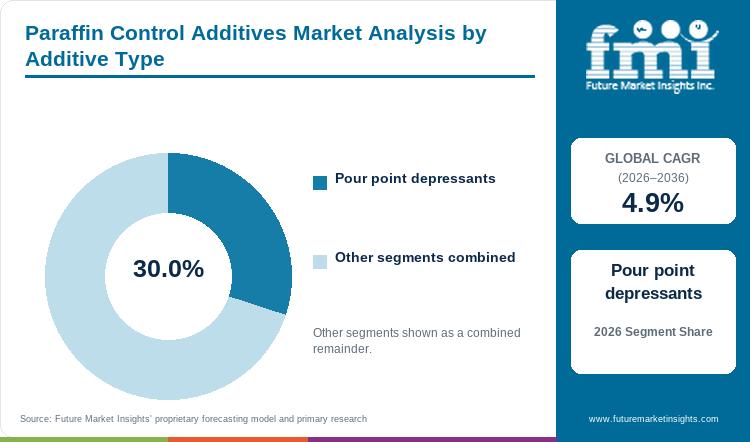
- Pour point depressants are expected to hold 30.0% of additive-type revenue in 2026 because they help crude stay pumpable at low temperature.
- EVA copolymers are expected to hold 29.0% of chemistry revenue in 2026 because their structure can change wax-crystal growth.
- Production wells are expected to hold 31.0% of application revenue in 2026 because early dosing can limit wax before shared flowlines.
- Crude-specific wax behavior slows switching because teams must test each formula against the actual fluid and operating temperature.
- Some of the key players in this market include Baker Hughes, SLB, Halliburton, Clariant, Innospec, Dorf Ketal, BASF, Evonik, TotalEnergies Additives & Fuels Solutions, and Beta Pramesti Asia.
Analyst Perspective
“The binding question is whether one formulation can control wax after the crude composition or minimum operating temperature changes. Programs scale more reliably when laboratory screening defines the mechanism and field monitoring confirms that the chosen dose reduces restrictions without destabilizing other production chemistry.”
- Nikhil Kaitwade, Principal Consultant, Future Market Insights.
How is the Paraffin Control Additives Market segmented?
The paraffin control additives market is segmented by Additive Type, Chemistry, Application, End Use, Sales Channel and Region.
The 2026 to 2036 assessment uses additive type, chemistry, application, end use, sales channel and region. Additive type separates flow control from deposit control while chemistry identifies the polymer or surfactant-solvent route. Application shows the treatment point and end use separates production from transport or refinery handling. Sales channel shows how buyers qualify and receive the chemistry.
What makes pour point depressants central to the Additive Type category?
Pour point depressants change the wax crystals that can thicken crude as it cools. A 2024 Energy & Fuels review says these polymers can change how waxy crude flows at low temperature. Engineers call this flow behavior rheology. Wax crystals can join into a network before a hard deposit forms. That network can raise the pressure needed to restart flow. Performance changes with wax distribution and dose. Operators test a real fluid sample before they choose continuous or batch treatment. They use pour point depressants when pumpability and restart control are key goals.
- Pour point depressants are expected to account for 30.0% of additive-type revenue in 2026 because they help preserve pumpability as crude cools.
- Crude oil flow improvers can also reduce viscosity and restart pressure when a program must manage more than wax deposits.
Why do EVA copolymers lead the Chemistry category?
EVA copolymers give formulators a flexible way to change how paraffin crystals form and join together. A March 2026 Energy & Fuels study tested an EVA/SiO2 nanocomposite in Indian waxy crude. The test found a lower pour point and a lower pressure-drop gradient in a flow loop. The result supports EVA as a useful base chemistry. It does not mean one formula works for every crude. Vinyl acetate content and polymer design change how EVA interacts with the oil phase. Dose also changes the result. Formulators can tune EVA chemistry for different crude types and operating temperatures.
- EVA copolymers are expected to hold 29.0% of chemistry revenue in 2026 because formulators can tune their interaction with wax crystals.
- Paraffin programs can share injection equipment with oilfield chemicals used for scale and corrosion control in broader production-chemistry programs.
How do production wells shape the Application category?
Production wells let operators treat crude near the point where cooling and pressure changes can disturb wax. SLB says its flow assurance range includes paraffin inhibitors and dissolvers. Teams select these products with field data and fluid samples plus lab tests and performance checks. Well treatment depends on representative sampling instead of a catalog choice. Operators can track pressure and cleanout frequency once dosing starts. Early treatment can keep wax solids out of shared flowlines and equipment. Treating near the well can avoid a larger shutdown or more costly cleaning farther downstream.
- Production wells are expected to hold 31.0% of application revenue in 2026. Early treatment can stop wax before it restricts the wider network.
- Flow assurance in oil and gas connects well treatment with downstream protection as the same crude moves through gathering and transfer lines.
What supports onshore oil production leadership in the End Use category?
Onshore sites give teams easy access to dosing points and fluid samples. In August 2026, the U.S. Energy Information Administration linked longer laterals with more Permian output. The Permian produced 11.2 million barrels of oil equivalent per day in 2025. Annual well completions stayed near recent levels. Fewer high-output wells can make each shutdown more costly. Onshore teams can change dose rates without subsea testing through an umbilical. Easy access lets teams check fluids and dose response often. Large well groups need repeat chemical service across onshore assets.
- Onshore oil production is expected to hold 36.0% of end-use revenue in 2026 because teams can reach dosing points and treat many wells.
- Corrosion inhibitors manage a separate integrity risk but can share dosing equipment and monitoring with wax-control programs.
Why do oilfield chemical suppliers lead the Sales Channel category?
Oilfield chemical suppliers do more than deliver a product. They help teams test crude and build a treatment plan. Innospec reported USD 115.4 million in Oilfield Services revenue for the second quarter of 2026. It also reported ongoing work in completions and production. The business model brings lab support and field work into one sales route. Suppliers need a real fluid sample before they choose a formula and set the dose. Local stock matters when field conditions change. Buyers choose this route when product supply must come with field support and steady replenishment.
- Oilfield chemical suppliers are likely to hold 38.0% share in 2026 because they pair lab screening with field dose work.
- Demulsifiers manage phase separation and can share service teams and injection planning with paraffin-control programs.
What are the drivers, restraints and opportunities in the Paraffin Control Additives Market?
High wax exposure sustains treatment demand, crude-specific qualification slows switching, and winterized formulations create a practical route to wider cold-service use.
- Driver: Wax can raise pressure loss and force costly field work. Operators use treatment before deposits cut flow.
- Restraint: The same inhibitor does not work the same way in every crude. Operators need lab tests and field checks before they change an established program.
- Opportunity: Local teams can respond faster when crude or site conditions change. Production-chemistry teams can support that response.
Wax-related flow pressure keeps prevention tied to asset economics
Wax restrictions can turn prevention into a direct operating-cost decision. In September 2026, the U.S. Energy Information Administration said U.S. crude output is expected to average 13.8 million barrels per day in 2026. Production reached a record 13.7 million barrels per day in 2025. More barrels do not create additive sales by themselves. They do create more wells and lines that may cool enough for wax to restrict flow. Operators compare chemical cost with the value of steady pressure and fewer interventions. Wax-control demand stays tied to exposed assets and the cost of an interruption.
Crude-specific site testing slows switching between inhibitor programs
Crude-specific response makes switching harder than a simple price check. A 2024 Energy & Fuels review found that wax-control results change with crude type and temperature. Site conditions can change the result too. A formula that works in one sample may need new tests before use at another site. Operators also check the dose against corrosion and separation chemicals already in service. A poor change can raise pressure before a visible wax deposit forms. Testing risk can favor the current program even when another product costs less.
Winterized dispersions widen the practical cold-service treatment window
Local supply can speed field tests in places that do not keep specialist chemicals nearby. In July 2026, Clariant appointed Gapuma Group to distribute well service additives in Nigeria and Côte d’Ivoire plus Ghana. The deal gives service teams a regional source for these products. It also reduces reliance on direct sales to operators. Paraffin-control suppliers can use the same model with local stock and lab support. Local teams can pair paraffin treatment with oilfield scale inhibitors when one asset has more than one deposit problem. Faster supply and sound testing can reduce the cost and delay of a treatment change.
Which country CAGRs are profiled in the Paraffin Control Additives Market?
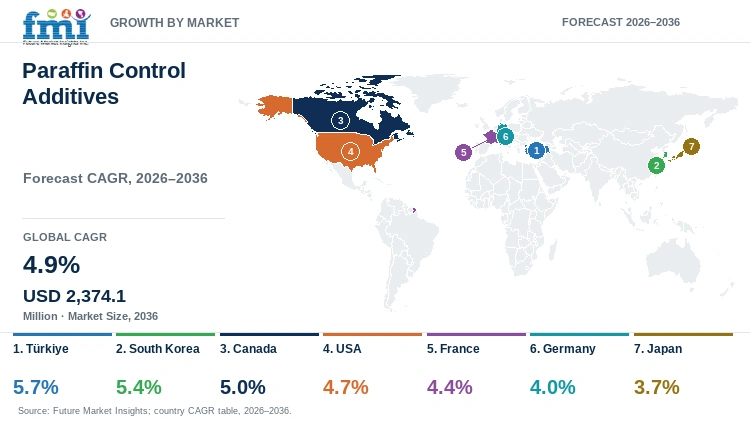
| Country | CAGR |
|---|---|
| Türkiye | 5.7% |
| South Korea | 5.4% |
| Canada | 5.0% |
| USA | 4.7% |
| France | 4.4% |
| Germany | 4.0% |
| Japan | 3.7% |
How do country-level CAGRs compare in the Paraffin Control Additives Market?
Türkiye and South Korea have faster forecast rates within the profiled country set. Germany and Japan have slower rates, while Canada and the USA form the middle group. France falls between the North American rates and the mature European rates. These gaps describe forecast speed rather than current revenue. Each country has a different operating mix that can include production and storage. Transport and refinery work can also shape the mix.
- Türkiye: New oil fields need testing while imported crude still moves through terminals.
- South Korea: Large crude stockpiles make storage reliability important.
- Canada: Cold routes increase the need for winter-ready chemistry.
- USA: Large mature well populations need flexible dosing and field service.
- France: Refinery-feed handling keeps treatment focused on transfer reliability.
- Germany: Mature crude systems support targeted treatment programs.
- Japan: Changing crude grades require fresh screening before tank transfer.
Similar CAGRs can still create different entry conditions because each country uses a different testing route. The full report covers country CAGR analysis across North America and Latin America. It also covers Europe and East Asia plus South Asia. The report covers Oceania with the Middle East and Africa.
Country-wise Analysis
- Türkiye combines more domestic oil output with continued use of imported crude at terminals and refineries. Sales of paraffin control additives in Türkiye are expected to grow at 5.7% CAGR through 2036. The Ministry of Energy and Natural Resources reported in January 2026 that domestic oil output reached 47.9 million barrels in 2025. Output rose 26% from 2024. New fields can have different crude properties and equipment. Those differences can change how wax forms and how a dose works. Local teams need fresh samples before they set treatment. They must also separate pour-point control from deposit removal. These checks help operators choose a program before wider use across new assets.
- South Korea depends on imported crude and uses large storage sites. Sales of paraffin control additives in South Korea are expected to grow at 5.4% CAGR through 2036. Korea National Oil Corporation reported in August 2026 that it operates nine stockpiling bases. The bases have 146 million barrels of capacity. The corporation also holds 100 million barrels of reserves outside international joint stockpiles. Large tank systems face changes in crude grade and temperature. Both can change wax behavior during storage and transfer. Local tests help teams set the right dose before problems spread. Ready local stock can also cut response time when a new crude grade creates a handling issue.
- Cold weather and long transport routes make wax control harder in Canada. Sales of paraffin control additives in Canada are expected to grow at 5.0% CAGR through 2036. The Canada Energy Regulator reported average crude oil and equivalents output of 5.35 million barrels per day in 2025. Alberta supplied 83.8% of that total. High output creates many wells and lines that can cool. Winter conditions can also make the treatment harder to pump. Teams need to check fluid samples and dose rates for each site. Enhanced oil recovery can change the fluid that comes from mature wells. That change can affect how paraffin chemistry works with other field treatments.
- Large onshore well populations keep wax control tied to field service across mature U.S. assets. Sales of paraffin control additives in the USA are expected to grow at 4.7% CAGR through 2036. In September 2026, the U.S. Energy Information Administration said crude output is expected to average 13.8 million barrels per day in 2026. Production averaged a record 13.7 million barrels per day in 2025. High output creates more systems that can cool and form wax. Teams must turn lab results into dose changes across many sites. Oil and gas field services can help operators make those changes across dispersed assets.
- France uses paraffin-control chemistry mainly in crude logistics and refinery work rather than a large domestic upstream base. Sales of paraffin control additives in France are expected to grow at 4.4% CAGR through 2036. France's statistical service reported in July 2026 that petroleum traffic reached 98.4 million tonnes in 2025. Crude oil traffic rose 4.0% to 49.9 million tonnes. Those flows keep wax control relevant across the refinery system. A small number of exposed sites keeps technical service focused. Treatment programs must reduce handling problems as tanks and transfer lines receive changing crude grades.
- Germany has a small domestic oil base and mature crude transport systems. Sales of paraffin control additives in Germany are expected to grow at 4.0% CAGR through 2036. BVEG reports that Germany produced 1.55 million tonnes of crude in 2025. Domestic output covered about 1.75% of national demand. The mix keeps chemical programs focused on mature fields and downstream systems. Each site must compare treatment cost with maintenance options. Fast service matters when conditions change. Pipeline integrity work can pair wax control with other asset-condition checks across established transport networks.
- Japan depends on imported crude storage and refinery-feed transfer more than on domestic oil output. Sales of paraffin control additives in Japan are expected to grow at 3.7% CAGR through 2036. In November 2025, JOGMEC renewed its Okinawa crude storage agreement with Aramco. The deal covers 13 national tanks with about 1.3 million kiloliters of capacity. New cargoes can bring different wax profiles into the same storage network. Teams need fresh screening before they reuse one treatment across several tanks. Drag reducing agents manage friction instead of wax. Both chemical routes can affect throughput and pipeline dosing plans.
Who are the notable companies in the Paraffin Control Additives Market?
Baker Hughes, SLB, Halliburton, Clariant, Innospec, Dorf Ketal, BASF, Evonik, TotalEnergies Additives & Fuels Solutions, and Beta Pramesti Asia are active within the defined competitive boundary.
The field has integrated production-chemistry platforms, specialist formulators and direct wax-control suppliers. Baker Hughes, SLB and Halliburton pair chemistry with field work. Clariant, Innospec and Dorf Ketal use specialist oilfield routes. BASF and Evonik supply formulation chemicals for flow assurance. TotalEnergies Additives & Fuels Solutions supplies wax-control additives for upstream use. Beta Pramesti Asia documents treatment in crude pipelines.
- Baker Hughes, SLB and Halliburton combine oilfield chemicals with field service across global operations.
- Clariant, Innospec and Dorf Ketal use specialist oilfield routes with formulation and application support.
- BASF and Evonik supply formulation chemicals. TotalEnergies Additives & Fuels Solutions and Beta Pramesti Asia supply direct wax-control products.
Competitive Benchmarking: Paraffin Control Additives Market
| Company | Production-Chemistry Integration | Field-Service Support | 2026 Public Oilfield Activity | Geographic Reach |
|---|---|---|---|---|
| Baker Hughes | High | High | High | Global oilfield network |
| SLB | High | High | High | Global production and recovery network |
| Halliburton | High | High | Medium | Global oilfield service network |
| Clariant | High | High | High | Global oil-services network |
| Innospec | High | High | High | North America and international oilfield regions |
| Dorf Ketal | High | High | Low | Multi-region oilfield and refinery network |
| BASF | Medium | Medium | Medium | Global specialty-chemical network |
| Evonik | Medium | Medium | Low | Global specialty-chemical network |
| TotalEnergies Additives & Fuels Solutions | Medium | Medium | Medium | International additive-supply network |
| Beta Pramesti Asia | Medium | Medium | High | Indonesia and Southeast Asian field applications |
The benchmark checks three areas. The first test checks how much of the company focuses on chemicals used during oil and gas production. High means a dedicated business for production chemicals or oilfield services. Medium means oilfield additives form part of a wider chemical range. Low means the company uses a narrower formula route. The second test checks how much field help the supplier provides. High requires field work or lab-to-field service, while Medium requires help with product use. Low means the company mainly supplies material. The third test checks what the company publicly did in 2026. High requires a dated action in this market or a dated operating result. Medium requires a dated update on production chemicals for the same buyers and service route. Low means the company has current products or services in this market but no separate qualifying 2026 action.
Key Developments in the Paraffin Control Additives Market
- In July 2026, SLB reported that ChampionX production chemicals supported Production Systems activity. The acquired business also strengthened SLB's production-chemistry position.
- In July 2026, Beta Pramesti Asia documented a BETAFLOW 9500 crude-pipeline treatment. The treatment restored flow and controlled paraffin deposits.
- In July 2026, Baker Hughes documented a winterized FORSA paraffin-inhibitor application. The treatment reduced flow-line pressure and improved annual operating economics.
Key Players in the Paraffin Control Additives Market
Integrated production-chemistry platforms
- Baker Hughes
- SLB
- Halliburton
Specialty oilfield formulators
- Clariant
- Innospec
- Dorf Ketal
Paraffin-control and formulation suppliers
- BASF
- Evonik
- TotalEnergies Additives & Fuels Solutions
- Beta Pramesti Asia
Paraffin Control Additives Market - Report Scope
| Coverage field | Report scope |
|---|---|
| Market breakdown | By additive type, chemistry, application, end use, sales channel and region. |
| Quantitative Units | USD million. |
| Market Definition | Revenue includes paraffin control additives used to prevent or remediate wax-related flow problems in production wells, flowlines, pipelines, storage tanks and refinery-feed handling. Finished petroleum products and unrelated production chemicals are excluded. |
| Regions Covered | North America, Latin America, Western Europe, Eastern Europe, East Asia, South Asia and Pacific, and Middle East and Africa. |
| Countries Covered | Türkiye, South Korea, Canada, USA, France, Germany, Japan, and more than twenty-five additional countries in the full report. |
| Key Companies Profiled | Baker Hughes, SLB, Halliburton, Clariant, Innospec, Dorf Ketal, BASF, Evonik, TotalEnergies Additives & Fuels Solutions, Beta Pramesti Asia. |
| Forecast Period | 2026 to 2036. |
| Approach | Primary and secondary research with market triangulation. |
Paraffin Control Additives Market - Research Methodology
| Method | Approach |
|---|---|
| Primary Research | FMI analysts gathered input from manufacturers, service providers, technology developers, distributors, end users, procurement teams, and subject-matter experts. Interviews examined purchasing decisions, product or service evaluation, adoption barriers, approval requirements, pricing considerations, and expectations for technical or commercial support. Respondents were also asked what evidence is required before a trial, pilot, or initial order develops into regular purchasing. |
| Desk Research | Desk research covered government statistics, regulatory publications, trade data, industry associations, technical literature, standards, company filings, product information, and official corporate announcements. Sources were reviewed for relevance, publication date, geographic coverage, and consistency with the defined market scope. Claims relating to performance, applications, approvals, capacity, investment, and commercial activity were retained only when supported by credible public evidence. |
| Market Sizing and Forecasting | The market model combined the baseline value with historical performance, segment structure, pricing and volume indicators, adoption levels, company participation, and country-level demand conditions. Forecast assumptions considered economic activity, investment trends, regulatory developments, technology adoption, purchasing cycles, supply availability, and barriers to wider market use. Segment and regional estimates were reconciled before the final market total was calculated. |
| Data Validation | Estimates were checked against multiple independent indicators, including public data, company activity, trade patterns, industry developments, and findings from primary interviews. Validation also tested whether products, services, applications, and company revenues fell within the defined market boundaries. Adjacent categories, unsupported claims, overlapping revenues, and activities without direct market relevance were excluded to reduce double counting and maintain consistency across segments and countries. |
Paraffin Control Additives Market by Segments
Paraffin Control Additives Market segmented by Additive Type:
- Pour point depressants
- Wax dispersants
- Crystal modifiers
- Solvent-based inhibitors
- Combination treatment packages
Paraffin Control Additives Market segmented by Chemistry:
- EVA copolymers
- Acrylate polymers
- Maleic anhydride copolymers
- Surfactant blends
- Aromatic solvent blends
Paraffin Control Additives Market segmented by Application:
- Production wells
- Flowlines
- Pipelines
- Storage tanks
- Refinery feed handling
Paraffin Control Additives Market segmented by End Use:
- Onshore oil production
- Offshore oil production
- Pipeline operators
- Heavy and waxy crude fields
- Refineries
Paraffin Control Additives Market segmented by Sales Channel:
- Oilfield chemical suppliers
- Integrated service companies
- Direct operator contracts
- Chemical distributors
Paraffin Control Additives Market by Region:
- North America
- United States
- Canada
- Latin America
- Brazil
- Mexico
- Argentina
- Rest of Latin America
- Western Europe
- Germany
- United Kingdom
- France
- Italy
- Spain
- Nordics
- Benelux
- Rest of Western Europe
- Eastern Europe
- Russia
- Poland
- Hungary
- Balkan and Baltic States
- Rest of Eastern Europe
- East Asia
- China
- Japan
- South Korea
- South Asia and Pacific
- India
- ASEAN
- Australia and New Zealand
- Rest of South Asia and Pacific
- Middle East and Africa
- Kingdom of Saudi Arabia
- Other GCC Countries
- Türkiye
- South Africa
- Other African Union Countries
- Rest of Middle East and Africa
Research Sources and Bibliography
- Singh, S., Choudhary, R., Kumar, S., Gautam, S., & Prasad, S. K. (2026). EVA/SiO2 nanocomposite pour point depressant for enhancing flow properties of Indian waxy crude oil. Energy & Fuels, 40(11), 5463-5479.
- Canada Energy Regulator. (2026, June 17). Market Snapshot: Canada sets new record in crude oil production in 2025.
- Korea National Oil Corporation. (2026, August 31). Operation of Stockpiling Facilities.
- Ala, B. S. K., & Daraboina, N. (2024). Chemical management for wax deposition: Recent developments and future prospects. Energy & Fuels, 38(13), 11437-11454.
- SLB. (n.d.). Flow assurance. Retrieved September 21, 2026.
- U.S. Energy Information Administration. (2026, August 19). Longer wells boost Permian crude oil and natural gas production.
- Innospec Inc. (2026, August 4). Innospec reports second quarter 2026 financial results.
- U.S. Energy Information Administration. (2026, September 10). United States on track for record crude oil production in 2026.
- Clariant. (2026, July 29). Clariant appoints Gapuma Group as Well Service Additives distributor across West Africa.
- Bundesverband Erdgas, Erdöl und Geoenergie e.V. (2026). Oil production: Annual report 2025.
- Japan Organization for Metals and Energy Security. (2025, November 19). JOGMEC and Aramco renew crude oil storage, throughput, and tank lease agreement in Okinawa.
- Service des données et études statistiques. (2026, July 24). Freight maritime traffic rebounds in France in 2025.
- Republic of Türkiye Ministry of Energy and Natural Resources. (2026, January 7). Oil Production Increased by 26 Percent, Natural Gas Production Increased by 39 Percent.
- SLB. (2026, July 24). SLB announces second-quarter 2026 results.
- Beta Pramesti Asia. (2026, July 21). Pour Point Depressant for Crude Oil Pipelines | BETAFLOW.
- Baker Hughes. (2026, July 13). Winterized FORSA paraffin inhibitor cuts flow-line pressures, adding $140k/year to customer’s bottom line.
- Halliburton. (2026, July 21). Halliburton announces second quarter 2026 results.
- Halliburton. (n.d.). Flow assurance. Retrieved September 21, 2026.
- Innospec. (n.d.). Paraffin Control & Wax Inhibitor Solutions. Retrieved September 21, 2026.
- BASF. (2026, May 28). Performance Chemicals. BASF Factbook.
- BASF. (n.d.). Paraffin Inhibitors. Retrieved September 21, 2026.
- Evonik Industries. (2026, August 4). Evonik reports strong second quarter.
- Evonik Industries. (n.d.). Production Chemicals. Retrieved September 21, 2026.
- Dorf Ketal. (n.d.). Energy. Retrieved September 21, 2026.
- TotalEnergies Additives & Fuels Solutions. (n.d.). Wax Inhibitor Additives. Retrieved September 21, 2026.
- Baker Hughes. (2026, July 30). FORSA treatment reduces operator’s trucking and disposal costs by minimizing iron accumulation in treater pad.
- SLB. (2025, July 16). SLB completes acquisition of ChampionX.
This bibliography gives readers a reference list. The full report contains the complete source list and detailed citations.
This Report Answers
- How large is the Paraffin Control Additives Market in 2026 and 2036?
- Which additive type leads paraffin-control revenue during the 2026 base year?
- Why do EVA copolymers remain important for paraffin-control wax-crystal modification?
- Which applications create recurring paraffin-control treatment requirements across production and transport systems?
- How do national site conditions change paraffin-control site testing across profiled countries?
- Which suppliers combine production chemistry with field execution and technical support?
- What technical condition often slows a switch between established inhibitor programs?
- How does low-temperature handling change paraffin-control formulation and field-service requirements?
- How do sales channels differ between integrated service platforms and expert chemical providers?
Frequently Asked Questions
How big is the Paraffin Control Additives Market in 2026?
The 2026 market value is USD 1,470.4 million. The 2036 value is expected to reach USD 2,374.1 million. The forecast equals a 4.9% CAGR over ten intervals.
Which additive type is expected to hold 30.0% in 2026?
Pour point depressants are expected to hold 30.0% of additive-type revenue in 2026. They help crude stay pumpable and restart before wax forms a wider flow restriction.
Which chemistry is expected to hold 29.0% in 2026?
EVA copolymers are expected to hold 29.0% of chemistry revenue in 2026. Formulators can tune EVA polymer structure to change wax crystals across different crude types and temperatures.
What slows paraffin-control switching?
Crude-specific site testing is the main switching restraint because wax distribution and operating temperature change inhibitor response. Operators test representative fluids before they use the same formula across more wells or transfer systems.
Which companies are active in the Paraffin Control Additives Market?
Baker Hughes, SLB and Halliburton combine chemistry with field work. Clariant and Innospec add specialist oilfield routes. BASF and Evonik supply formulation chemistry. Dorf Ketal and TotalEnergies Additives & Fuels Solutions also serve paraffin-control needs. Beta Pramesti Asia supplies direct wax-control routes.
Preview the report firsthand - request a free sample
Get SampleGet the brochure for pricing and purchase details.
Get PDFTable of Content
- Key Takeaways
- Market Size and CAGR
- Top Growth Driver
- Fastest Growing Segment
- Leading Region
- Key Companies
- Emerging Opportunities
- Executive Summary
- Global Market Outlook
- Demand-side Trends
- Supply-side Trends
- Technology Roadmap Analysis
- Analysis and Recommendations
- Analyst Perspective (What is happening? Why now? What should investors know?)
- Key Questions Answered
- How large is the market?
- What is the CAGR?
- What are key trends?
- Which region dominates?
- Who are the leaders?
- Market Overview
- Market Coverage / Taxonomy
- Market Definition / Scope / Limitations
- Research Methodology
- Chapter Orientation
- Analytical Lens and Working Hypotheses
- Market Structure, Signals, and Trend Drivers
- Benchmarking and Cross-market Comparability
- Market Sizing, Forecasting, and Opportunity Mapping
- Research Design and Evidence Framework
- Desk Research Programme (Secondary Evidence)
- Expert Input and Fieldwork (Primary Evidence)
- Tooling, Models, and Reference Databases
- Data Engineering and Model Build
- Quality Assurance and Audit Trail
- Market Background
- Market Dynamics (Drivers, Restraints, Opportunity, Trends)
- Scenario Forecast (Optimistic, Likely, Conservative)
- Impact Analysis
- AI Impact
- Sustainability Impact
- Regulatory Impact
- Technology Impact
- Consumer / Buyer Analysis
- Purchase Drivers
- Adoption Barriers
- Buyer Journey
- Opportunity Map Analysis
- Product Life Cycle Analysis
- Supply Chain Analysis
- Investment Feasibility Matrix
- Value Chain Analysis
- PESTLE and Porter's Analysis
- Regulatory Landscape
- Regional Parent Market Outlook
- Production and Consumption Statistics
- Import and Export Statistics
- Global Market Analysis and Forecast, 2021 to 2036
- Historical Market Size Value (USD Million) Analysis, 2021 to 2025
- Current and Future Market Size Value (USD Million) Projections, 2026 to 2036
- Y-o-Y Growth Trend Analysis
- Absolute $ Opportunity Analysis
- Global Market Pricing Analysis, 2021 to 2036
- Global Market Analysis and Forecast, By Additive Type, 2021 to 2036
- Introduction / Key Findings
- Historical Market Size Value (USD Million) Analysis By Additive Type, 2021 to 2025
- Current and Future Market Size Value (USD Million) Analysis and Forecast By Additive Type, 2026 to 2036
- Pour point depressants
- Wax dispersants
- Crystal modifiers
- Solvent-based inhibitors
- Combination treatment packages
- Y-o-Y Growth Trend Analysis By Additive Type, 2021 to 2025
- Absolute $ Opportunity Analysis By Additive Type, 2026 to 2036
- Global Market Analysis and Forecast, By Chemistry, 2021 to 2036
- Introduction / Key Findings
- Historical Market Size Value (USD Million) Analysis By Chemistry, 2021 to 2025
- Current and Future Market Size Value (USD Million) Analysis and Forecast By Chemistry, 2026 to 2036
- EVA copolymers
- Acrylate polymers
- Maleic anhydride copolymers
- Surfactant blends
- Aromatic solvent blends
- Y-o-Y Growth Trend Analysis By Chemistry, 2021 to 2025
- Absolute $ Opportunity Analysis By Chemistry, 2026 to 2036
- Global Market Analysis and Forecast, By Application, 2021 to 2036
- Introduction / Key Findings
- Historical Market Size Value (USD Million) Analysis By Application, 2021 to 2025
- Current and Future Market Size Value (USD Million) Analysis and Forecast By Application, 2026 to 2036
- Production wells
- Flowlines
- Pipelines
- Storage tanks
- Refinery feed handling
- Y-o-Y Growth Trend Analysis By Application, 2021 to 2025
- Absolute $ Opportunity Analysis By Application, 2026 to 2036
- Global Market Analysis and Forecast, By End Use, 2021 to 2036
- Introduction / Key Findings
- Historical Market Size Value (USD Million) Analysis By End Use, 2021 to 2025
- Current and Future Market Size Value (USD Million) Analysis and Forecast By End Use, 2026 to 2036
- Onshore oil production
- Offshore oil production
- Pipeline operators
- Heavy and waxy crude fields
- Refineries
- Y-o-Y Growth Trend Analysis By End Use, 2021 to 2025
- Absolute $ Opportunity Analysis By End Use, 2026 to 2036
- Global Market Analysis and Forecast, By Sales Channel, 2021 to 2036
- Introduction / Key Findings
- Historical Market Size Value (USD Million) Analysis By Sales Channel, 2021 to 2025
- Current and Future Market Size Value (USD Million) Analysis and Forecast By Sales Channel, 2026 to 2036
- Oilfield chemical suppliers
- Integrated service companies
- Direct operator contracts
- Chemical distributors
- Y-o-Y Growth Trend Analysis By Sales Channel, 2021 to 2025
- Absolute $ Opportunity Analysis By Sales Channel, 2026 to 2036
- Global Market Analysis and Forecast, By Region, 2021 to 2036
- Introduction
- Historical Market Size Value (USD Million) Analysis By Region, 2021 to 2025
- Current Market Size Value (USD Million) Analysis and Forecast By Region, 2026 to 2036
- North America
- Latin America
- Western Europe
- Eastern Europe
- East Asia
- South Asia and Pacific
- Middle East and Africa
- Market Attractiveness Analysis By Region
- North America Market Analysis and Forecast, By Country, 2021 to 2036
- Historical Market Size Value (USD Million) Trend Analysis By Market Taxonomy, 2021 to 2025
- Market Size Value (USD Million) Forecast By Market Taxonomy, 2026 to 2036
- By Country
- United States
- Canada
- By Additive Type
- By Chemistry
- By Application
- By End Use
- By Sales Channel
- By Country
- Market Attractiveness Analysis
- By Country
- By Additive Type
- By Chemistry
- By Application
- By End Use
- By Sales Channel
- Key Takeaways
- Latin America Market Analysis and Forecast, By Country
- Historical Market Size Value (USD Million) Trend Analysis By Market Taxonomy, 2021 to 2025
- Market Size Value (USD Million) Forecast By Market Taxonomy, 2026 to 2036
- By Country
- Brazil
- Mexico
- Argentina
- Rest of Latin America
- By Additive Type
- By Chemistry
- By Application
- By End Use
- By Sales Channel
- By Country
- Market Attractiveness Analysis
- By Country
- By Additive Type
- By Chemistry
- By Application
- By End Use
- By Sales Channel
- Key Takeaways
- Western Europe Market Analysis and Forecast, By Country
- Historical Market Size Value (USD Million) Trend Analysis By Market Taxonomy, 2021 to 2025
- Market Size Value (USD Million) Forecast By Market Taxonomy, 2026 to 2036
- By Country
- Germany
- United Kingdom
- France
- Italy
- Spain
- Nordics
- Benelux
- Rest of Western Europe
- By Additive Type
- By Chemistry
- By Application
- By End Use
- By Sales Channel
- By Country
- Market Attractiveness Analysis
- By Country
- By Additive Type
- By Chemistry
- By Application
- By End Use
- By Sales Channel
- Key Takeaways
- Eastern Europe Market Analysis and Forecast, By Country
- Historical Market Size Value (USD Million) Trend Analysis By Market Taxonomy, 2021 to 2025
- Market Size Value (USD Million) Forecast By Market Taxonomy, 2026 to 2036
- By Country
- Russia
- Poland
- Hungary
- Balkan and Baltic States
- Rest of Eastern Europe
- By Additive Type
- By Chemistry
- By Application
- By End Use
- By Sales Channel
- By Country
- Market Attractiveness Analysis
- By Country
- By Additive Type
- By Chemistry
- By Application
- By End Use
- By Sales Channel
- Key Takeaways
- East Asia Market Analysis and Forecast, By Country
- Historical Market Size Value (USD Million) Trend Analysis By Market Taxonomy, 2021 to 2025
- Market Size Value (USD Million) Forecast By Market Taxonomy, 2026 to 2036
- By Country
- China
- Japan
- South Korea
- By Additive Type
- By Chemistry
- By Application
- By End Use
- By Sales Channel
- By Country
- Market Attractiveness Analysis
- By Country
- By Additive Type
- By Chemistry
- By Application
- By End Use
- By Sales Channel
- Key Takeaways
- South Asia and Pacific Market Analysis and Forecast, By Country
- Historical Market Size Value (USD Million) Trend Analysis By Market Taxonomy, 2021 to 2025
- Market Size Value (USD Million) Forecast By Market Taxonomy, 2026 to 2036
- By Country
- India
- ASEAN
- Australia and New Zealand
- Rest of South Asia and Pacific
- By Additive Type
- By Chemistry
- By Application
- By End Use
- By Sales Channel
- By Country
- Market Attractiveness Analysis
- By Country
- By Additive Type
- By Chemistry
- By Application
- By End Use
- By Sales Channel
- Key Takeaways
- Middle East and Africa Market Analysis and Forecast, By Country
- Historical Market Size Value (USD Million) Trend Analysis By Market Taxonomy, 2021 to 2025
- Market Size Value (USD Million) Forecast By Market Taxonomy, 2026 to 2036
- By Country
- Kingdom of Saudi Arabia
- Other GCC Countries
- Türkiye
- South Africa
- Other African Union Countries
- Rest of Middle East and Africa
- By Additive Type
- By Chemistry
- By Application
- By End Use
- By Sales Channel
- By Country
- Market Attractiveness Analysis
- By Country
- By Additive Type
- By Chemistry
- By Application
- By End Use
- By Sales Channel
- Key Takeaways
- Key Countries Market Analysis
- United States
- Pricing Analysis
- Market Share Analysis, 2025
- By Additive Type
- By Chemistry
- By Application
- By End Use
- By Sales Channel
- Canada
- Pricing Analysis
- Market Share Analysis, 2025
- By Additive Type
- By Chemistry
- By Application
- By End Use
- By Sales Channel
- Mexico
- Pricing Analysis
- Market Share Analysis, 2025
- By Additive Type
- By Chemistry
- By Application
- By End Use
- By Sales Channel
- Brazil
- Pricing Analysis
- Market Share Analysis, 2025
- By Additive Type
- By Chemistry
- By Application
- By End Use
- By Sales Channel
- Germany
- Pricing Analysis
- Market Share Analysis, 2025
- By Additive Type
- By Chemistry
- By Application
- By End Use
- By Sales Channel
- United Kingdom
- Pricing Analysis
- Market Share Analysis, 2025
- By Additive Type
- By Chemistry
- By Application
- By End Use
- By Sales Channel
- Italy
- Pricing Analysis
- Market Share Analysis, 2025
- By Additive Type
- By Chemistry
- By Application
- By End Use
- By Sales Channel
- Spain
- Pricing Analysis
- Market Share Analysis, 2025
- By Additive Type
- By Chemistry
- By Application
- By End Use
- By Sales Channel
- France
- Pricing Analysis
- Market Share Analysis, 2025
- By Additive Type
- By Chemistry
- By Application
- By End Use
- By Sales Channel
- India
- Pricing Analysis
- Market Share Analysis, 2025
- By Additive Type
- By Chemistry
- By Application
- By End Use
- By Sales Channel
- ASEAN
- Pricing Analysis
- Market Share Analysis, 2025
- By Additive Type
- By Chemistry
- By Application
- By End Use
- By Sales Channel
- Australia and New Zealand
- Pricing Analysis
- Market Share Analysis, 2025
- By Additive Type
- By Chemistry
- By Application
- By End Use
- By Sales Channel
- China
- Pricing Analysis
- Market Share Analysis, 2025
- By Additive Type
- By Chemistry
- By Application
- By End Use
- By Sales Channel
- Japan
- Pricing Analysis
- Market Share Analysis, 2025
- By Additive Type
- By Chemistry
- By Application
- By End Use
- By Sales Channel
- South Korea
- Pricing Analysis
- Market Share Analysis, 2025
- By Additive Type
- By Chemistry
- By Application
- By End Use
- By Sales Channel
- Russia
- Pricing Analysis
- Market Share Analysis, 2025
- By Additive Type
- By Chemistry
- By Application
- By End Use
- By Sales Channel
- Poland
- Pricing Analysis
- Market Share Analysis, 2025
- By Additive Type
- By Chemistry
- By Application
- By End Use
- By Sales Channel
- Hungary
- Pricing Analysis
- Market Share Analysis, 2025
- By Additive Type
- By Chemistry
- By Application
- By End Use
- By Sales Channel
- Kingdom of Saudi Arabia
- Pricing Analysis
- Market Share Analysis, 2025
- By Additive Type
- By Chemistry
- By Application
- By End Use
- By Sales Channel
- Türkiye
- Pricing Analysis
- Market Share Analysis, 2025
- By Additive Type
- By Chemistry
- By Application
- By End Use
- By Sales Channel
- South Africa
- Pricing Analysis
- Market Share Analysis, 2025
- By Additive Type
- By Chemistry
- By Application
- By End Use
- By Sales Channel
- United States
- Market Structure Analysis
- Competition Dashboard
- Competition Benchmarking
- Market Share Analysis of Top Players
- By Regional
- By Additive Type
- By Chemistry
- By Application
- By End Use
- By Sales Channel
- Emerging Startups
- Innovation Benchmarking
- Competition Analysis
- Competition Deep Dive
- Baker Hughes
- Overview
- Product Portfolio
- Profitability by Market Segments
- Sales Footprint
- Strategy Overview
- Marketing Strategy
- Product Strategy
- Channel Strategy
- SLB
- Halliburton
- Clariant
- Innospec
- Dorf Ketal
- BASF
- Evonik
- TotalEnergies Additives & Fuels Solutions
- Beta Pramesti Asia
- Baker Hughes
- Case Studies
- Success Stories
- Recent Developments
- Competition Deep Dive
- Assumptions & Acronyms Used


