

- Market Size (2026)
- USD 980.6 Mn
- Forecast (2036)
- USD 1659.2 Mn
- CAGR (2026 to 2036)
- 5.4%
How big is Cement Loss Control Additives Market in 2026?
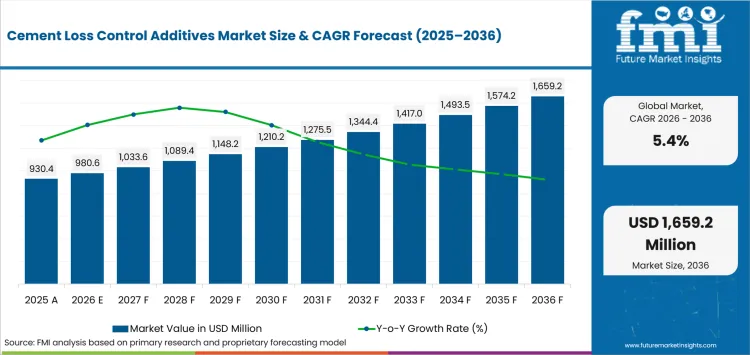
USD 980.6 million in 2026 and USD 1,659.2 million by 2036 at a 5.4% CAGR.
Demand for cement loss control additives is projected to rise at a 5.4% CAGR between 2026 and 2036, increasing valuation from USD 980.6 million to USD 1,659.2 million. Longer laterals extend the cemented interval and raise the cost of filtration loss during placement. The USA Energy Information Administration found in August 2026 that super-laterals exceeded 15,000 feet in 15% of new Permian completions during 2025. Longer cemented intervals raise the value of qualified oilfield chemicals that preserve slurry properties through extended pumping schedules.
Country demand separates mature shale programs from newer offshore and unconventional gas projects. USA Energy Information Administration data published in July 2026 placed the Permian at 48% of national crude output during 2025. A basin producing nearly half of national crude requires fast qualification and local inventory for onshore drilling fluids and cement additives. Australia follows a slower qualification route because new offshore acreage carries longer planning schedules before cementing formulations enter field programs.
Key Takeaways of Cement Loss Control Additives Market
- Demand rises where longer laterals and gas-prone intervals increase the economic consequence of uncontrolled filtrate during primary cement placement.
- In 2026, fluid loss polymers are projected to account for 30.0% of additive type demand because formulators require adjustable filtration control.
- Portland cement is estimated at 42.0% of cement system demand in 2026 owing to its broad compatibility with qualified well-cement formulations.
- Primary cementing is anticipated to represent 38.0% of operation demand in 2026 due to its role in first-barrier placement for new casing.
- Qualification cycles restrain switching because an additive must preserve thickening time and rheology inside the complete slurry under representative well conditions.
- Some of the key players in this market include SLB, Halliburton, Baker Hughes, Weatherford International, National Energy Services Reunited Corp., BASF SE, Clariant, and Nouryon.
Analyst Perspective
"Cement loss-control chemistry earns its margin during qualification because a cheaper polymer has little value if it changes pumping behavior or barrier development. Regional laboratories and service-company acceptance shorten the path from a successful slurry test to repeat field consumption."
- Nikhil Kaitwade, Principal Consultant, Future Market Insights
How is the Cement Loss Control Additives Market segmented?
The cement loss control additives market is segmented by Additive Type, Cement System, Operation, Well Environment and Sales Channel.
Additive type covers fluid loss polymers, latex additives, cellulosic additives, AMPS copolymers and gas-blocking loss additives. Cement system includes Portland cement, lightweight cement, HPHT cement, deepwater cement and gas well cement. Operation covers primary cementing, liner cementing, squeeze cementing and gas migration control. Well environment includes onshore, offshore, HPHT, deepwater and sour gas. Sales channel includes cementing service companies, polymer suppliers, direct operator contracts and regional distributors.
What makes Fluid loss polymers central to the Additive type category?
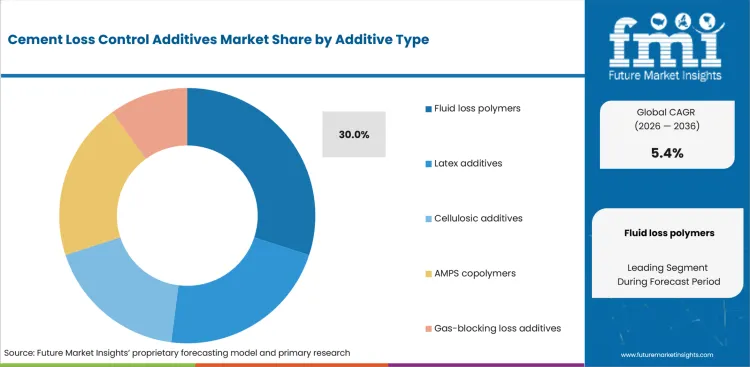
Fluid loss polymers let formulators control filtrate without changing the base cement platform. Gas exposure and longer laterals increase sensitivity to water loss during placement. Related drilling and completion fluids also require predictable behavior under changing temperature and salinity.
- Fluid loss polymers hold a 30.0% share in 2026 because polymer dosage gives laboratories a practical route to tune filtration performance within qualified slurry designs.
- Gas exposure raises the penalty for uncontrolled filtration before the cement barrier develops sufficient strength. EIA data published in June 2026 placed Permian marketed natural gas production at 27.6 Bcf/d in 2025, linking polymer qualification to a major gas-producing basin.
Why does Portland cement anchor the Cement system category?
Portland cement retains a broad compatibility base because service companies already qualify retarders and dispersants against familiar well-cement chemistry. Completion designs using inflow control devices require a competent cement barrier before production hardware enters service. Reduced-cement systems must preserve additive compatibility with their retained Portland fraction.
- Portland cement holds a 42.0% share in 2026 owing to standardized well-cement use that gives additive formulators a broad starting point for routine and engineered designs.
- Reduced-cement systems require laboratories to test the retained Portland fraction with the selected additive package. Halliburton documented in June 2026 that NeoCem E+ exceeded 135 North Sea jobs after a yearlong qualification process.
How does Primary cementing shape the Operation category?
Primary cementing places the first annular barrier around new casing before later completion work proceeds. Barrier quality must be established before perforating guns expose the well to production-stage pressure changes. Filtrate loss during placement therefore carries a direct zonal-isolation consequence.
- Primary cementing holds a 38.0% share in 2026 due to repeated first-barrier placement requirements on new casing programs with defined slurry-performance targets.
- Primary cementing demand depends on new casing jobs scheduled in active producing basins with repeat completion activity. EIA analysis published in August 2026 found Permian horizontal completions had stayed near 6,000 wells annually since 2022, sustaining repeated qualification demand despite higher drilling efficiency.
What drives Cementing service companies in the Sales channel category?
Cementing service companies translate well data into slurry design and control blending and placement. Their responsibility keeps additive purchasing close to laboratory approval and field execution. Related oilwell completion tools enter after cement placement but depend on barrier acceptance first.
- Cementing service companies hold a 44.0% share in 2026 as technical responsibility and additive purchasing converge inside the same job-design workflow.
- Service companies define the acceptance route for chemical packages entering automated cementing workflows. SLB reported in July 2026 that its technology surpassed 100 remote and automated cementing jobs after first-quarter commercialization, linking execution data with qualification decisions.
What are the drivers, restraints and opportunities in the Cement Loss Control Additives Market?
Gas-prone and longer well sections raise barrier risk, qualification slows additive switching and local testing expands the commercial reach of broader-condition formulations.
- Driver: Longer laterals and unconventional gas programs increase the cost of filtration loss before cement develops a competent annular barrier.
- Restraint: Laboratory qualification slows formulation changes because thickening time and rheology must remain acceptable with every interacting cement additive.
- Opportunity: Regional testing centers shorten troubleshooting cycles for formulations intended for higher temperature, salinity and offshore logistics constraints.
Unconventional gas programs increase cement jobs where early fluid movement can weaken barrier development under variable pressure. Aramco confirmed in February 2026 that Jafurah began unconventional shale-gas production in December 2025 and targets higher gas capacity by 2030. Gas-focused construction raises demand for cement packages that control filtration before later oilfield stimulation chemicals enter the completion program.
Qualification slows switching because operators approve a complete slurry system instead of an isolated polymer. Trican filed its 2025 Annual Information Form in February 2026 and documented dedicated cement laboratories at its Calgary research center. Dedicated laboratory capacity keeps formulation changes tied to evidence on thickening time and placement behavior before a contractor replaces a qualified recipe.
Longer service contracts can convert one qualified formulation into repeat cementing work without restarting commercial approval for every job. Weatherford disclosed Cementation Products awards in July 2025 covering Canada and several offshore programs. Related fracking fluids and chemicals follow separate technical workflows, so approval in cementation does not automatically transfer to stimulation programs.
Which country CAGRs are profiled in the Cement Loss Control Additives Market?
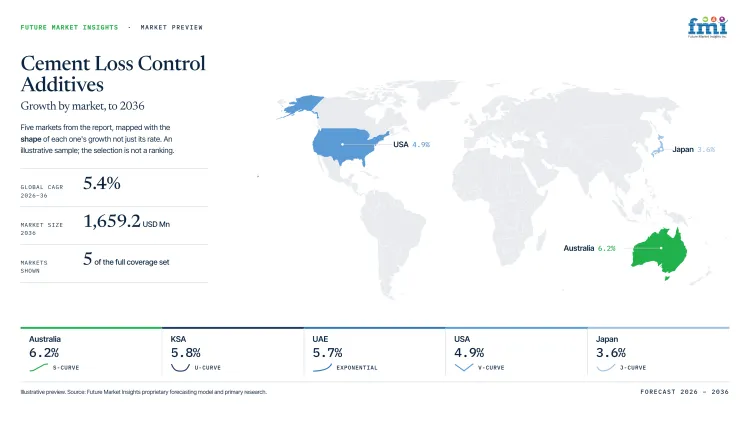
| Country | CAGR |
|---|---|
| Australia | 6.2% |
| KSA | 5.8% |
| UAE | 5.7% |
| USA | 4.9% |
| Japan | 3.6% |
How do country-level CAGRs compare in the Cement Loss Control Additives Market?
Forecasts span 2.6 percentage points, from Australia at 6.2% to Japan at 3.6%. Australia, KSA, and UAE form the upper-growth group, supported by offshore developments, gas programs, and new-well activity, while the USA records 4.9% growth, reflecting continued deepwater and pre-salt project activity. Japan grows at 3.6%, with its mature shale base placing greater emphasis on service efficiency and optimization than greenfield expansion.
- Australia concentrates additive intensity in technically demanding offshore campaigns with fewer wells.
- KSA concentrates purchasing in operator programs after service-company qualification of repeat batches.
- UAE places specification authority with integrated contractors serving scheduled offshore gas assets.
- USA competition centers on response time inside a mature shale service network.
- Japan’s competition centers on response time and service efficiency within a mature shale service network.
Similar CAGRs mask different revenue pools as well depth and concentration vary. The full report provides country-level CAGR analysis across North America, Latin America, Europe, East Asia, South Asia, Oceania and the Middle East and Africa.
Country-wise Analysis
- Offshore campaigns in the Otway Basin require cementing chemistry to tolerate long vessel schedules and low seabed temperatures before field placement. Adoption of cement loss control additives in Australia is estimated to expand at 6.2% CAGR through 2036, because offshore exploration is reopening southern acreage. The Australian Government opened five Otway Basin exploration areas in December 2025 and accepted bids through June 2026. Local laboratories shorten retesting for each program, but formal operating approvals increase documentation before contractors mobilize chemistry. Chemistry firms holding stock near southern service bases can answer qualification requests faster than import-only entrants serving from distant warehouses.
- Jafurah is shifting cementing work toward deeper unconventional gas wells that require repeated qualification of slurry designs for large development programs. Aramco stated in August 2025 that Jafurah contains an estimated 229 trillion standard cubic feet of raw gas. KSA's cement loss control additives outlook is anticipated to advance at 5.8% CAGR over the assessment period, supported by in-country blending and regional service capacity. In-country blending shortens resupply cycles for approved formulations, but operator-specific testing makes recipe changes expensive during active programs. New chemistry firms must rely on local laboratories and experienced cementing contractors before their recipes enter repeat field use.
- Offshore gas development concentrates cementing decisions among integrated contractors serving high-cost assets with tight rig schedules and marine logistics. The UAE cement loss control additives sector is projected to record 5.7% CAGR during the assessment period, given active offshore expansion. ADNOC approved a 14-well drilling program for the Umm Shaif Gas Cap in July 2026. Qualified contractors provide laboratory access near Abu Dhabi service bases, which shortens troubleshooting after a slurry test fails. Rig schedules leave little room for emergency substitution after materials move offshore. Marine mobilization and operator acceptance narrow entry for chemistry companies without local stock or direct cementing relationships.
- Permian service corridors demand rapid laboratory turnaround because cement jobs move on compressed shale schedules with little tolerance for delayed blending or redesign. USA is estimated to post 4.9% CAGR over the forecast period, attributable to a mature well base. EIA recorded USA crude production at 13.6 million barrels per day in 2025. Dense service infrastructure makes additives easier to source and retest near active basins, reducing the logistics penalty for repeat jobs. Fast shale schedules compress the time available for field trials before the next casing program begins. New formulations must displace validated chemistry on performance and turnaround against incumbent service-company recipes.
- Japan’s mature oil and gas fields demand reliable laboratory turnaround as cementing programs prioritize consistency, service efficiency, and precise slurry design across established well operations. Japan is estimated to post 3.6% CAGR over the forecast period, supported by a mature well base and ongoing maintenance and redevelopment activity. The country’s established energy infrastructure enables cement additives to be sourced through existing service networks, reducing supply disruptions for repeat well programs. Mature field conditions increase the importance of optimizing cement formulations for changing downhole requirements rather than pursuing large-scale greenfield applications. Service providers therefore compete through faster testing, formulation accuracy, and technical support to minimize delays between laboratory validation and field execution.
Who are the notable companies in the Cement Loss Control Additives Market?
SLB, Halliburton, Baker Hughes, Weatherford International, National Energy Services Reunited Corp., BASF SE, Clariant and Nouryon are the notable companies serving this market.
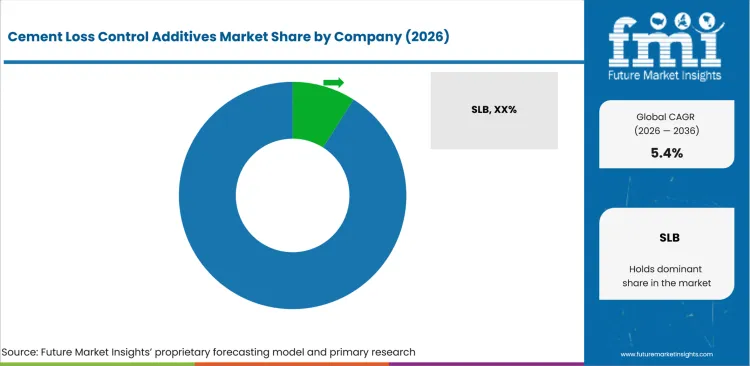
Integrated cementing firms hold the strongest route to field qualification because they control slurry design and placement on active well programs. SLB, Halliburton and Baker Hughes pair laboratory work with field execution under broader well-construction contracts. Weatherford International and National Energy Services Reunited Corp. participate through cementation products and regional operator agreements. BASF SE, Clariant and Nouryon enter the same qualification chain through cementing chemistry and application support, with adjacent oilfield production chemicals handled by separate technical teams.
- SLB, Halliburton and Baker Hughes integrate cementing laboratories, placement equipment and field execution within broader well-construction contracts.
- Weatherford International and National Energy Services Reunited Corp. participate through cementation products and regional contracts close to operator qualification decisions.
- BASF SE, Clariant and Nouryon supply specialty polymers and cementing chemistry with formulation support from regional technical teams.
Competitive Benchmarking: Cement Loss Control Additives Market
| Company | Integrated Cementing Scope | Loss-Control Chemistry Breadth | Qualification Support Depth | Geographic Reach |
|---|---|---|---|---|
| SLB | High | Medium | High | Global |
| Halliburton | High | High | High | Global |
| Baker Hughes | High | Medium | High | Global |
| Weatherford International | Medium | Low | High | Global |
| National Energy Services Reunited Corp. | High | Medium | High | Middle East, North Africa and Asia |
| BASF SE | Low | High | Medium | Global |
| Clariant | Low | High | Medium | Global with West Africa distribution |
| Nouryon | Low | Medium | High | Global |
Scoring basis: High integrated scope requires documented slurry design plus field cementing execution. Medium covers cementation equipment or regional execution, whereas Low identifies chemistry-only participation. High chemistry breadth requires several documented cementing functions including fluid-loss or gas-control roles. Medium covers two functions, whereas Low reflects narrower public evidence for cement-specific chemistry. High qualification support requires dedicated cementing laboratories or other documented testing infrastructure. Medium reflects regional technical support, whereas Low indicates narrower public qualification evidence. Geographic Reach records verified operating coverage and does not affect the three capability ratings.
Key Developments in the Cement Loss Control Additives Market
- In July 2026, Clariant appointed Gapuma Group to distribute its Well Service Additives portfolio for drilling, cementing and stimulation in Nigeria, Côte d’Ivoire and Ghana.
- In November 2025, Halliburton released LOGIX unit vitality for cementing equipment with monitoring of more than 400 real-time equipment parameters before and during field jobs.
- In March 2025, SLB received Woodside Energy's integrated Trion contract covering eighteen ultra-deepwater wells with cementing included in the three-year service scope.
Key Players in the Cement Loss Control Additives Market
Integrated Cementing and Well-Construction Providers
- SLB
- Halliburton
- Baker Hughes
- Weatherford International
- National Energy Services Reunited Corp.
Specialty Cementing Chemistry Providers
- BASF SE
- Clariant
- Nouryon
Cement Loss Control Additives Market - Report Scope
| Coverage field | Report scope |
|---|---|
| Market breakdown | By additive type, cement system, operation, well environment, sales channel and region. |
| Quantitative Units | USD Million. |
| Market Definition | Commercial chemical and polymeric additives used to reduce filtrate or water loss from oil and gas well-cement slurries within defined cement systems and operations. |
| Regions Covered | North America, Latin America, Europe, East Asia, South Asia and Pacific and Middle East and Africa. |
| Countries Covered | Australia, KSA, UAE, Brazil, USA, and 20+ countries included in the full report. |
| Key Companies Profiled | SLB, Halliburton, Baker Hughes, Weatherford International, National Energy Services Reunited Corp., BASF SE, Clariant, Nouryon. |
| Forecast Period | 2026 to 2036. |
| Approach | Primary and secondary research with market triangulation. |
Cement Loss Control Additives Market - Research Methodology
| Method | Approach |
|---|---|
| Primary Research | FMI analysts gathered input from manufacturers, service providers, technology developers, distributors, end users, procurement teams, and subject-matter experts. Interviews examined purchasing decisions, product or service evaluation, adoption barriers, approval requirements, pricing considerations, and expectations for technical or commercial support. Respondents were also asked what evidence is required before a trial, pilot, or initial order develops into regular purchasing. |
| Desk Research | Desk research covered government statistics, regulatory publications, trade data, industry associations, technical literature, standards, company filings, product information, and official corporate announcements. Sources were reviewed for relevance, publication date, geographic coverage, and consistency with the defined market scope. Claims relating to performance, applications, approvals, capacity, investment, and commercial activity were retained only when supported by credible public evidence. |
| Market Sizing and Forecasting | The market model combined the baseline value with historical performance, segment structure, pricing and volume indicators, adoption levels, company participation, and country-level demand conditions. Forecast assumptions considered economic activity, investment trends, regulatory developments, technology adoption, purchasing cycles, supply availability, and barriers to wider market use. Segment and regional estimates were reconciled before the final market total was calculated. |
| Data Validation | Estimates were checked against multiple independent indicators, including public data, company activity, trade patterns, industry developments, and findings from primary interviews. Validation also tested whether products, services, applications, and company revenues fell within the defined market boundaries. Adjacent categories, unsupported claims, overlapping revenues, and activities without direct market relevance were excluded to reduce double counting and maintain consistency across segments and countries. |
Cement Loss Control Additives Market by Segments
Cement Loss Control Additives Market segmented by Additive Type:
- Fluid loss polymers
- Latex additives
- Cellulosic additives
- AMPS copolymers
- Gas-blocking loss additives
Cement Loss Control Additives Market segmented by Cement System:
- Portland cement
- Lightweight cement
- HPHT cement
- Deepwater cement
- Gas well cement
Cement Loss Control Additives Market segmented by Operation:
- Primary cementing
- Liner cementing
- Squeeze cementing
- Gas migration control
Cement Loss Control Additives Market segmented by Well Environment:
- Onshore
- Offshore
- HPHT
- Deepwater
- Sour gas
Cement Loss Control Additives Market segmented by Sales Channel:
- Cementing service companies
- Polymer suppliers
- Direct operator contracts
- Regional distributors
Cement Loss Control Additives Market by Region:
- North America
- United States
- Canada
- Latin America
- Brazil
- Mexico
- Chile
- Rest of Latin America
- Western Europe
- Germany
- United Kingdom
- Italy
- Spain
- France
- Nordics
- Benelux
- Rest of Western Europe
- Eastern Europe
- Russia
- Poland
- Hungary
- Balkan and Baltic States
- Rest of Eastern Europe
- East Asia
- China
- Japan
- South Korea
- South Asia and Pacific
- India
- ASEAN
- Australia and New Zealand
- Rest of South Asia and Pacific
- Middle East and Africa
- Kingdom of Saudi Arabia
- Other GCC Countries
- Türkiye
- South Africa
- Other African Union Countries
- Rest of Middle East and Africa
Research Sources and Bibliography
- USA Energy Information Administration. (2026, August 19). Longer wells boost Permian crude oil and natural gas production.
- USA Energy Information Administration. (2026, July 9). The United States produced more crude oil than any other country in 2025.
- USA Energy Information Administration. (2026, June 18). Permian natural gas production increased faster than crude oil.
- Australian Government Department of Industry, Science and Resources. (2025, December 11). Otway Basin acreage areas opened to petroleum exploration.
- Aramco. (2026, February 26). Aramco’s gas strategy builds momentum with major progress towards growth target.
- Aramco. (2025, August 14). Aramco signs Jafurah midstream deal with international consortium led by Global Infrastructure Partners.
- ADNOC. (2026, July 21). ADNOC accelerates gas growth strategy with FID for Umm Shaif Gas Cap.
- Petrobras. (2026, January 13). Tupi/Iracema Field Returns to Reaching Production of 1 Million Barrels per Day.
- Halliburton. (2026, June 17). A pioneer of lower-carbon well cementing: NeoCem E+ system proves value in the North Sea.
- Halliburton. (2025, November 4). Halliburton launches LOGIX unit vitality to advance cementing operations.
- Halliburton. (2026, February 22). Pertamina and Halliburton sign an integrated unconventional fracturing MOU in Indonesia.
- SLB. (2026, July 24). SLB Announces Second-Quarter 2026 Results.
- SLB. (2025, March 31). SLB Awarded Major Drilling Contract by Woodside Energy for Ultra-deepwater Trion Development.
- National Energy Services Reunited Corp. (2026, March 16). NESR Awarded $300 Million in Cementing Contracts.
- Weatherford International plc. (2025, July). Second-quarter 2025 results and operational highlights.
- Baker Hughes. (2026, May 26). Baker Hughes Extends and Expands Integrated Well Construction Contract with Petrobras.
- Nouryon. (2025, June 18). Nouryon launches Innovation Center for oilfield solutions in Texas, US.
- Clariant. (2026, July 29). Clariant appoints Gapuma Group as Well Service Additives distributor across West Africa.
- BASF SE. (2026, May 28). Performance Chemicals: Oilfield chemicals.
- Baker Hughes. (2026, February). 2025 Form 10-K.
- Sanjel Energy Services. (2026, March 9). Sanjel Energy and STEP Complete Transaction.
- Trican Well Service Ltd. (2026, February 18). 2025 Annual Information Form.
- Weatherford International plc. (2025, April 22). Weatherford Announces First Quarter 2025 Results.
- Sinopec ZPEB International. (2025, August 21). Sinopec's Kuwait Drilling Turnkey Project Commences Spud in.
- ADNOC Drilling Company P.J.S.C. (2026, February 12). Consolidated financial statements for the year ended 31 December 2025.
- SLB. (2025, July 22). SLB Awarded Carbon Storage Contract for Northern Endurance Partnership Project in UK.
This Report Answers
- How large is the cement loss control additives market in 2026 and 2036?
- Which well-construction conditions increase demand for cement fluid-loss control chemistry?
- Why do fluid loss polymers account for 30.0% of additive type demand in 2026?
- Why does Portland cement retain a 42.0% share of cement system demand in 2026?
- How does primary cementing account for 38.0% of operation demand in 2026?
- Why do cementing service companies account for 44.0% of sales channel demand in 2026?
- How do the five profiled country growth rates differ through 2036?
- Which companies compete through integrated cementing services and specialty chemistry?
- What qualification and field-support conditions limit additive switching?
Frequently Asked Questions
How big is the cement loss control additives market in 2026?
The cement loss control additives market is valued at USD 980.6 million in 2026 and is projected to reach USD 1,659.2 million by 2036. Growth follows longer well sections and gas-prone cementing programs that require tighter filtration control.
What is the CAGR of the cement loss control additives market from 2026 to 2036?
The cement loss control additives market is projected to grow at a CAGR of 5.4% between 2026 and 2036. Expansion is supported by unconventional gas development and technically demanding offshore wells that raise barrier-performance requirements.
Which additive type leads the cement loss control additives market?
The fluid loss polymers segment is expected to hold 30.0% of the cement loss control additives market in 2026, driven by adjustable polymer dosage for filtration control. Its compatibility with varied slurry designs supports use in routine and demanding well conditions.
Which cement system leads the cement loss control additives market?
The Portland cement segment is expected to hold 42.0% of the cement loss control additives market in 2026, attributable to its broad installed compatibility base. Formulators already qualify retarders and dispersants against familiar Portland-based well-cement chemistry.
Which companies are active in the cement loss control additives market?
Key companies operating in the market include SLB, Halliburton, Baker Hughes, Weatherford International, National Energy Services Reunited Corp., BASF SE, Clariant, and Nouryon. Integrated service firms control field execution, whereas chemistry producers depend on formulation support and regional channel reach.
Preview the report firsthand - request a free sample
Get SampleGet the brochure for pricing and purchase details.
Get PDFTable of Content
- Key Takeaways
- Market Size and CAGR
- Top Growth Driver
- Fastest Growing Segment
- Leading Region
- Key Companies
- Emerging Opportunities
- Executive Summary
- Global Market Outlook
- Demand-side Trends
- Supply-side Trends
- Technology Roadmap Analysis
- Analysis and Recommendations
- Analyst Perspective (What is happening? Why now? What should investors know?)
- Key Questions Answered
- How large is the market?
- What is the CAGR?
- What are key trends?
- Which region dominates?
- Who are the leaders?
- Market Overview
- Market Coverage / Taxonomy
- Market Definition / Scope / Limitations
- Research Methodology
- Chapter Orientation
- Analytical Lens and Working Hypotheses
- Market Structure, Signals, and Trend Drivers
- Benchmarking and Cross-market Comparability
- Market Sizing, Forecasting, and Opportunity Mapping
- Research Design and Evidence Framework
- Desk Research Programme (Secondary Evidence)
- Expert Input and Fieldwork (Primary Evidence)
- Tooling, Models, and Reference Databases
- Data Engineering and Model Build
- Quality Assurance and Audit Trail
- Market Background
- Market Dynamics (Drivers, Restraints, Opportunity, Trends)
- Scenario Forecast (Optimistic, Likely, Conservative)
- Impact Analysis
- AI Impact
- Sustainability Impact
- Regulatory Impact
- Technology Impact
- Consumer / Buyer Analysis
- Purchase Drivers
- Adoption Barriers
- Buyer Journey
- Opportunity Map Analysis
- Product Life Cycle Analysis
- Supply Chain Analysis
- Investment Feasibility Matrix
- Value Chain Analysis
- PESTLE and Porter's Analysis
- Regulatory Landscape
- Regional Parent Market Outlook
- Production and Consumption Statistics
- Import and Export Statistics
- Global Market Analysis and Forecast, 2021 to 2036
- Historical Market Size Value (USD Million) Analysis, 2021 to 2025
- Current and Future Market Size Value (USD Million) Projections, 2026 to 2036
- Y-o-Y Growth Trend Analysis
- Absolute $ Opportunity Analysis
- Global Market Pricing Analysis, 2021 to 2036
- Global Market Analysis and Forecast, By Additive Type, 2021 to 2036
- Introduction / Key Findings
- Historical Market Size Value (USD Million) Analysis By Additive Type, 2021 to 2025
- Current and Future Market Size Value (USD Million) Analysis and Forecast By Additive Type, 2026 to 2036
- Fluid loss polymers
- Latex additives
- Cellulosic additives
- AMPS copolymers
- Gas-blocking loss additives
- Fluid loss polymers
- Y-o-Y Growth Trend Analysis By Additive Type, 2021 to 2025
- Absolute $ Opportunity Analysis By Additive Type, 2026 to 2036
- Global Market Analysis and Forecast, By Cement System, 2021 to 2036
- Introduction / Key Findings
- Historical Market Size Value (USD Million) Analysis By Cement System, 2021 to 2025
- Current and Future Market Size Value (USD Million) Analysis and Forecast By Cement System, 2026 to 2036
- Portland cement
- Lightweight cement
- HPHT cement
- Deepwater cement
- Gas well cement
- Portland cement
- Y-o-Y Growth Trend Analysis By Cement System, 2021 to 2025
- Absolute $ Opportunity Analysis By Cement System, 2026 to 2036
- Global Market Analysis and Forecast, By Operation, 2021 to 2036
- Introduction / Key Findings
- Historical Market Size Value (USD Million) Analysis By Operation, 2021 to 2025
- Current and Future Market Size Value (USD Million) Analysis and Forecast By Operation, 2026 to 2036
- Primary cementing
- Liner cementing
- Squeeze cementing
- Gas migration control
- Primary cementing
- Y-o-Y Growth Trend Analysis By Operation, 2021 to 2025
- Absolute $ Opportunity Analysis By Operation, 2026 to 2036
- Global Market Analysis and Forecast, By Well Environment, 2021 to 2036
- Introduction / Key Findings
- Historical Market Size Value (USD Million) Analysis By Well Environment, 2021 to 2025
- Current and Future Market Size Value (USD Million) Analysis and Forecast By Well Environment, 2026 to 2036
- Onshore
- Offshore
- HPHT
- Deepwater
- Sour gas
- Onshore
- Y-o-Y Growth Trend Analysis By Well Environment, 2021 to 2025
- Absolute $ Opportunity Analysis By Well Environment, 2026 to 2036
- Global Market Analysis and Forecast, By Sales Channel, 2021 to 2036
- Introduction / Key Findings
- Historical Market Size Value (USD Million) Analysis By Sales Channel, 2021 to 2025
- Current and Future Market Size Value (USD Million) Analysis and Forecast By Sales Channel, 2026 to 2036
- Cementing service companies
- Polymer suppliers
- Direct operator contracts
- Regional distributors
- Cementing service companies
- Y-o-Y Growth Trend Analysis By Sales Channel, 2021 to 2025
- Absolute $ Opportunity Analysis By Sales Channel, 2026 to 2036
- Global Market Analysis and Forecast, By Region, 2021 to 2036
- Introduction
- Historical Market Size Value (USD Million) Analysis By Region, 2021 to 2025
- Current Market Size Value (USD Million) Analysis and Forecast By Region, 2026 to 2036
- North America
- Latin America
- Western Europe
- Eastern Europe
- East Asia
- South Asia and Pacific
- Middle East & Africa
- Market Attractiveness Analysis By Region
- North America Market Analysis and Forecast, By Country, 2021 to 2036
- Historical Market Size Value (USD Million) Trend Analysis By Market Taxonomy, 2021 to 2025
- Market Size Value (USD Million) Forecast By Market Taxonomy, 2026 to 2036
- By Country
- USA
- Canada
- By Additive Type
- By Cement System
- By Operation
- By Well Environment
- By Sales Channel
- By Country
- Market Attractiveness Analysis
- By Country
- By Additive Type
- By Cement System
- By Operation
- By Well Environment
- By Sales Channel
- Key Takeaways
- Latin America Market Analysis and Forecast, By Country
- Historical Market Size Value (USD Million) Trend Analysis By Market Taxonomy, 2021 to 2025
- Market Size Value (USD Million) Forecast By Market Taxonomy, 2026 to 2036
- By Country
- Brazil
- Mexico
- Chile
- Rest of Latin America
- By Additive Type
- By Cement System
- By Operation
- By Well Environment
- By Sales Channel
- By Country
- Market Attractiveness Analysis
- By Country
- By Additive Type
- By Cement System
- By Operation
- By Well Environment
- By Sales Channel
- Key Takeaways
- Western Europe Market Analysis and Forecast, By Country
- Historical Market Size Value (USD Million) Trend Analysis By Market Taxonomy, 2021 to 2025
- Market Size Value (USD Million) Forecast By Market Taxonomy, 2026 to 2036
- By Country
- Germany
- UK
- Italy
- Spain
- France
- Nordic
- BENELUX
- Rest of Western Europe
- By Additive Type
- By Cement System
- By Operation
- By Well Environment
- By Sales Channel
- By Country
- Market Attractiveness Analysis
- By Country
- By Additive Type
- By Cement System
- By Operation
- By Well Environment
- By Sales Channel
- Key Takeaways
- Eastern Europe Market Analysis and Forecast, By Country
- Historical Market Size Value (USD Million) Trend Analysis By Market Taxonomy, 2021 to 2025
- Market Size Value (USD Million) Forecast By Market Taxonomy, 2026 to 2036
- By Country
- Russia
- Poland
- Hungary
- Balkan & Baltic
- Rest of Eastern Europe
- By Additive Type
- By Cement System
- By Operation
- By Well Environment
- By Sales Channel
- By Country
- Market Attractiveness Analysis
- By Country
- By Additive Type
- By Cement System
- By Operation
- By Well Environment
- By Sales Channel
- Key Takeaways
- East Asia Market Analysis and Forecast, By Country
- Historical Market Size Value (USD Million) Trend Analysis By Market Taxonomy, 2021 to 2025
- Market Size Value (USD Million) Forecast By Market Taxonomy, 2026 to 2036
- By Country
- China
- Japan
- South Korea
- By Additive Type
- By Cement System
- By Operation
- By Well Environment
- By Sales Channel
- By Country
- Market Attractiveness Analysis
- By Country
- By Additive Type
- By Cement System
- By Operation
- By Well Environment
- By Sales Channel
- Key Takeaways
- South Asia and Pacific Market Analysis and Forecast, By Country
- Historical Market Size Value (USD Million) Trend Analysis By Market Taxonomy, 2021 to 2025
- Market Size Value (USD Million) Forecast By Market Taxonomy, 2026 to 2036
- By Country
- India
- ASEAN
- Australia & New Zealand
- Rest of South Asia and Pacific
- By Additive Type
- By Cement System
- By Operation
- By Well Environment
- By Sales Channel
- By Country
- Market Attractiveness Analysis
- By Country
- By Additive Type
- By Cement System
- By Operation
- By Well Environment
- By Sales Channel
- Key Takeaways
- Middle East & Africa Market Analysis and Forecast, By Country
- Historical Market Size Value (USD Million) Trend Analysis By Market Taxonomy, 2021 to 2025
- Market Size Value (USD Million) Forecast By Market Taxonomy, 2026 to 2036
- By Country
- Kingdom of Saudi Arabia
- Other GCC Countries
- Türkiye
- South Africa
- Other African Union
- Rest of Middle East & Africa
- By Additive Type
- By Cement System
- By Operation
- By Well Environment
- By Sales Channel
- By Country
- Market Attractiveness Analysis
- By Country
- By Additive Type
- By Cement System
- By Operation
- By Well Environment
- By Sales Channel
- Key Takeaways
- Key Countries Market Analysis
- USA
- Pricing Analysis
- Market Share Analysis, 2025
- By Additive Type
- By Cement System
- By Operation
- By Well Environment
- By Sales Channel
- Canada
- Pricing Analysis
- Market Share Analysis, 2025
- By Additive Type
- By Cement System
- By Operation
- By Well Environment
- By Sales Channel
- Mexico
- Pricing Analysis
- Market Share Analysis, 2025
- By Additive Type
- By Cement System
- By Operation
- By Well Environment
- By Sales Channel
- Brazil
- Pricing Analysis
- Market Share Analysis, 2025
- By Additive Type
- By Cement System
- By Operation
- By Well Environment
- By Sales Channel
- Chile
- Pricing Analysis
- Market Share Analysis, 2025
- By Additive Type
- By Cement System
- By Operation
- By Well Environment
- By Sales Channel
- Germany
- Pricing Analysis
- Market Share Analysis, 2025
- By Additive Type
- By Cement System
- By Operation
- By Well Environment
- By Sales Channel
- UK
- Pricing Analysis
- Market Share Analysis, 2025
- By Additive Type
- By Cement System
- By Operation
- By Well Environment
- By Sales Channel
- Italy
- Pricing Analysis
- Market Share Analysis, 2025
- By Additive Type
- By Cement System
- By Operation
- By Well Environment
- By Sales Channel
- Spain
- Pricing Analysis
- Market Share Analysis, 2025
- By Additive Type
- By Cement System
- By Operation
- By Well Environment
- By Sales Channel
- France
- Pricing Analysis
- Market Share Analysis, 2025
- By Additive Type
- By Cement System
- By Operation
- By Well Environment
- By Sales Channel
- India
- Pricing Analysis
- Market Share Analysis, 2025
- By Additive Type
- By Cement System
- By Operation
- By Well Environment
- By Sales Channel
- ASEAN
- Pricing Analysis
- Market Share Analysis, 2025
- By Additive Type
- By Cement System
- By Operation
- By Well Environment
- By Sales Channel
- Australia & New Zealand
- Pricing Analysis
- Market Share Analysis, 2025
- By Additive Type
- By Cement System
- By Operation
- By Well Environment
- By Sales Channel
- China
- Pricing Analysis
- Market Share Analysis, 2025
- By Additive Type
- By Cement System
- By Operation
- By Well Environment
- By Sales Channel
- Japan
- Pricing Analysis
- Market Share Analysis, 2025
- By Additive Type
- By Cement System
- By Operation
- By Well Environment
- By Sales Channel
- South Korea
- Pricing Analysis
- Market Share Analysis, 2025
- By Additive Type
- By Cement System
- By Operation
- By Well Environment
- By Sales Channel
- Russia
- Pricing Analysis
- Market Share Analysis, 2025
- By Additive Type
- By Cement System
- By Operation
- By Well Environment
- By Sales Channel
- Poland
- Pricing Analysis
- Market Share Analysis, 2025
- By Additive Type
- By Cement System
- By Operation
- By Well Environment
- By Sales Channel
- Hungary
- Pricing Analysis
- Market Share Analysis, 2025
- By Additive Type
- By Cement System
- By Operation
- By Well Environment
- By Sales Channel
- Kingdom of Saudi Arabia
- Pricing Analysis
- Market Share Analysis, 2025
- By Additive Type
- By Cement System
- By Operation
- By Well Environment
- By Sales Channel
- Türkiye
- Pricing Analysis
- Market Share Analysis, 2025
- By Additive Type
- By Cement System
- By Operation
- By Well Environment
- By Sales Channel
- South Africa
- Pricing Analysis
- Market Share Analysis, 2025
- By Additive Type
- By Cement System
- By Operation
- By Well Environment
- By Sales Channel
- USA
- Market Structure Analysis
- Competition Dashboard
- Competition Benchmarking
- Market Share Analysis of Top Players
- By Regional
- By Additive Type
- By Cement System
- By Operation
- By Well Environment
- By Sales Channel
- Emerging Startups
- Innovation Benchmarking
- Competition Analysis
- Competition Deep Dive
- SLB
- Overview
- Product Portfolio
- Profitability by Market Segments
- Sales Footprint
- Strategy Overview
- Marketing Strategy
- Product Strategy
- Channel Strategy
- Halliburton
- Baker Hughes
- BASF
- Ashland
- Nouryon
- Kemira
- Clariant
- Innospec
- TETRA Technologies
- SLB
- Case Studies
- Success Stories
- Recent Developments
- Competition Deep Dive
- Assumptions & Acronyms Used


