The Transit Ticketing market is experiencing significant growth driven by the increasing adoption of digital ticketing solutions and automated fare collection systems across urban and intercity transportation networks. The market outlook is shaped by the growing need for efficient, secure, and contactless ticketing systems that enhance commuter convenience and operational efficiency. Investment in smart city infrastructure and modernization of public transport networks has accelerated the deployment of advanced ticketing technologies.
Rising passenger volumes and the emphasis on reducing cash-based transactions are also key factors driving market expansion. Additionally, integration of software platforms with hardware components, mobile applications, and contactless payment solutions is enabling seamless travel experiences.
Governments and transportation authorities are focusing on improving commuter satisfaction while optimizing revenue collection, further supporting market growth As urban mobility evolves and digitalization of public transport becomes a priority, the Transit Ticketing market is poised to witness sustained expansion across both developed and emerging regions.
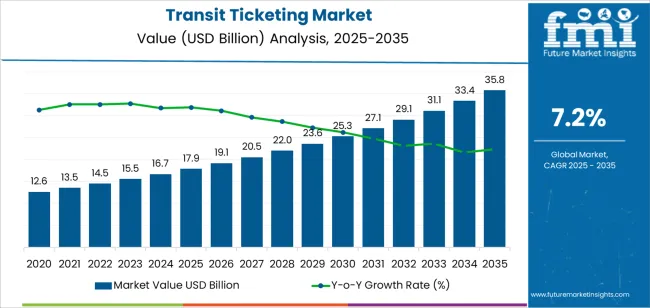
| Metric | Value |
|---|---|
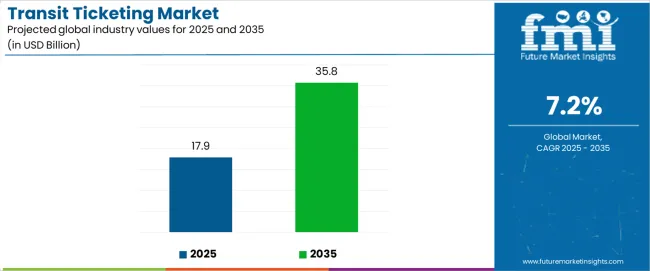
| Transit Ticketing Market Estimated Value in (2025 E) | USD 17.9 billion |
| Transit Ticketing Market Forecast Value in (2035 F) | USD 35.8 billion |
| Forecast CAGR (2025 to 2035) | 7.2% |
The market is segmented by Ticketing Infrastructure, Application, and Transportation Type and region. By Ticketing Infrastructure, the market is divided into Hardware, Software, and Services. In terms of Application, the market is classified into Railways Stations, Airports, Bus Transits, Sub-Ways/Metros, Toll Booths, Smart Parking Facilities, and Others. Based on Transportation Type, the market is segmented into Urban Transportation and Mainline Transportation. Regionally, the market is classified into North America, Latin America, Western Europe, Eastern Europe, Balkan & Baltic Countries, Russia & Belarus, Central Asia, East Asia, South Asia & Pacific, and the Middle East & Africa.
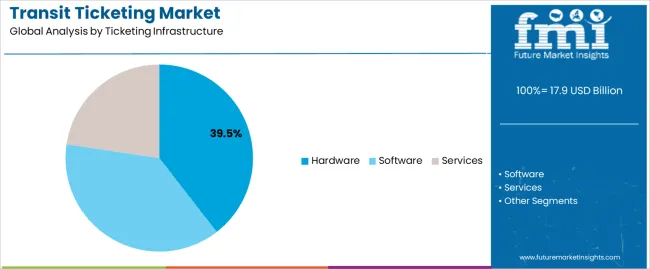
The hardware segment is projected to hold 39.50% of the Transit Ticketing market revenue share in 2025, making it the leading ticketing infrastructure component. This dominance is driven by the widespread deployment of automated fare collection machines, smart card readers, and self-service kiosks across transit networks.
The segment has benefited from improvements in durability, reliability, and ease of integration with digital ticketing software platforms. The need for efficient processing of high passenger volumes and secure fare collection has further reinforced hardware adoption.
Additionally, ongoing modernization of transportation infrastructure and expansion of urban mobility networks are driving demand for scalable and interoperable hardware solutions The segment’s growth is supported by investments in contactless ticketing technologies and the increasing emphasis on reducing operational bottlenecks, making hardware a critical component in the overall transit ticketing ecosystem.
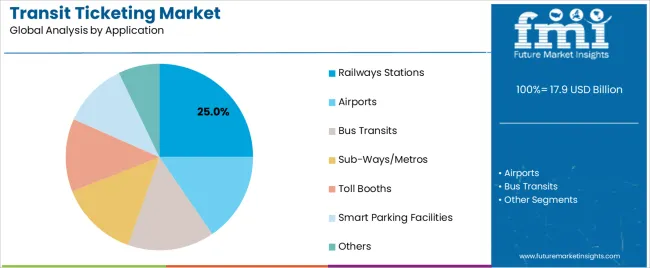
The railways stations application segment is expected to account for 25.00% of the Transit Ticketing market revenue share in 2025, establishing it as the leading application. This growth is influenced by the modernization of railway stations to provide faster, safer, and more convenient ticketing experiences for passengers.
The integration of automated ticketing systems with smart card solutions and mobile ticketing apps has improved efficiency, reduced queues, and enhanced commuter satisfaction. Rising passenger traffic in urban and intercity railway networks, coupled with the adoption of contactless payment systems, has further reinforced the segment’s prominence.
Implementation of software-defined ticketing platforms allows real-time monitoring of transactions and operational analytics, which is critical for effective management of large transportation hubs The focus on providing seamless end-to-end travel experiences continues to drive the adoption of transit ticketing solutions in railway stations.
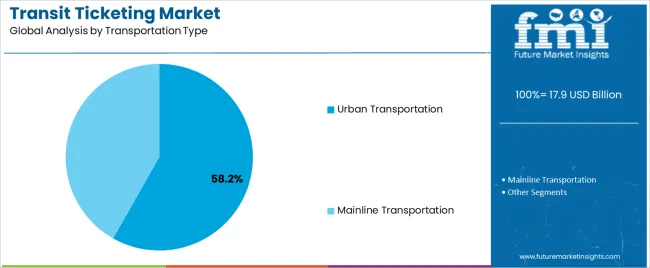
The urban transportation segment is anticipated to hold 58.20% of the Transit Ticketing market revenue share in 2025, making it the largest end-use industry. Growth in this segment is driven by the rising demand for smart, contactless, and interoperable ticketing solutions across buses, trams, metro systems, and other urban mobility services.
The need to manage high commuter volumes efficiently while ensuring convenience and security has accelerated the deployment of advanced ticketing technologies. Integration with mobile applications, digital wallets, and automated fare collection systems enables operators to optimize revenue collection and improve operational efficiency.
Additionally, government initiatives promoting cashless travel and investment in urban mobility infrastructure are key factors supporting market expansion The segment’s prominence is further reinforced by the growing adoption of data-driven insights and analytics to enhance service planning, reduce congestion, and improve overall passenger experience, positioning urban transportation as a critical driver of the transit ticketing market.
The below table presents the expected CAGR for the global transit ticketing market over several semi-annual periods spanning from 2025 to 2035. This assessment outlines changes in the transit ticketing industry and identify revenue trends, offering key decision makers an understanding about market performance throughout the year.
H1 represents first half of the year from January to June, H2 spans from July to December, which is the second half. In the first half (H1) of the year from 2025 to 2035, the business is predicted to surge at a CAGR of 11.7%, followed by a slightly higher growth rate of 12.5% in the second half (H2) of the same decade.
| Particular | Value CAGR |
|---|---|
| H1(2025 to 2035) | 11.7% |
| H2(2025 to 2035) | 12.5% |
| H1(2025 to 2035) | 11.4% |
| H2(2025 to 2035) | 12.7% |
Moving into the subsequent period, from H1 2025 to H2 2035, the CAGR is projected to decrease slightly to 11.4% in the first half and remain higher at 12.7% in the second half. In the first half (H1) the market witnessed a decrease of 30 BPS while in the second half (H2), the market witnessed an increase of 20 BPS.
Increased Adoption of Ticket Vending Machines (TVMs) Enhances User Convenience and Reduces Operational Costs
As transit systems seek to expand efficiency and customer experience, the deployment of TVMs has become a solution. According to USA Federal Transit Administration indicates that transit agencies implementing TVMs sees 20% increase in self-service ticketing and a 15% reduction in staffing costs.
In 2025, In New York City, the Metropolitan Transportation Authority's rollout of new TVMs across subway stations has streamlined ticket purchasing processes, resulting in a 25% decrease in queue times. The integration of machines with contactless payment options has further improved user convenience.
In 2025, according to report by Transit Cooperative Research Program, the shift towards TVMs is driven by need for more efficient ticketing solutions and cost-effective operations. The rising adoption of TVMs reflects an industry trend towards automation and self-service in the transit ticketing market, enhancing overall operational efficiency and passenger satisfaction.
Rising need for secure access control and efficient passenger flow in transit systems
The growing need for secure access control and efficient passenger flow is driving the adoption of fare gates and turnstiles in transit systems. The public transportation networks expand and become more complex ensuring that paying passengers access the system is crucial. Fare gates and turnstiles will provide a reliable solution for controlling entry points, preventing fare evasion and managing large crowds specifically during peak hours.
These systems are integrating with smart card readers and contactless payment technologies enables quicker and smoother passenger movement. By improving security and efficiency fare gates and turnstiles contribute to a more organized and safer transit environment.
Expanding integration of digital wallets and contactless payments drives the adoption of smart cards and payment devices
The shift towards digital payment methods for convenience and security transit systems is adapting by offering smart cards and mobile payment transaction options. These devices allow passengers to quickly tap and pay for their rides eliminating the need for paper tickets or exact change. The growing attractiveness of contactless payments particularly in urban areas is making smart cards IC a preferred choice for daily commuters.
This shift not only enhances the user experience but also streamlines the fare collection process for transit operators and it will help in reducing transaction times and improving overall efficiency.
Dependence on stable connectivity and power cause operational disruptions for Transit Ticketing
The devices are essential for validating tickets in real-time especially in systems where passengers tap their smart cards or use mobile payments to access transportation services.
If there is an issue with connectivity such as poor network coverage or technical glitches, the validators not function properly and it leads to delays and inconveniences for passengers. The power outages or insufficient battery life can render devices inoperable disrupting the entire ticketing process.
The global transit ticketing market experienced a growth with revenue reaching USD 9,999.2 million in 2020. The growth for transit ticketing from 2020 to 2025 at a CAGR of 9.5%. The pandemic accelerated the adoption of transit ticketing solutions as transit systems worldwide shifted towards contactless and remote operations to ensure passenger safety.
The increasing focus helps to enhance public transportation efficiency and helps in reducing physical touchpoints further propel the demand for advanced ticketing technologies during this period.
Looking ahead from 2025 to 2035, the transit ticketing is anticipated to witness growth driven by ongoing technological advancements and the increasing implementation of smart city initiatives. The urban populations are increasing along with the need for efficient transit systems will become more critical pushing the adoption of digital and automated ticketing solutions.
Innovations such as AI-powered fare collection, mobile ticketing apps and integrated payment systems will play a substantial role in this development. By 2035, the market is expected to reach an estimation of approximately USD 50,287.0 million. The growing demand for travel experiences and it will enhance operational efficiency and improved decision-making in transit systems will be key factors driving this market's growth from 2025 to 2035.
The transit ticketing market is largely led by Tier 1 suppliers, account for 45-50% of the global market share. The leading vendors are growing by increasing their investments in technology and infrastructure. Vendors includes Thales Group, NXP Semiconductors and Giesecke+Devrient are the main giants in this market.
Vendors offers comprehensive products and services catering to public transportation, smart cities and smart mobility. Vendors are continuously innovating new functionalities such as contactless payments, mobile ticketing and real-time information intelligence into their systems. This allows to meet the rising demand for modern ticketing services, enhance customer experiences and improve the management of transit systems.
Tier 2 vendors in the transit ticketing market caters approximately 15% to 20% of the global market share. These companies are expanding their presence by focusing on specialized areas and enhancing their product offerings. Vendors like Hitachi Rail, Conduent Incorporated and Infineon Technologies significantly contribute to the market by improving ticketing solutions, particularly in transit ticketing, smart city integration and flexible payment options.
Their targeted approach to specific market segments and ability to introduce innovative solutions play a crucial role in advancing both national and international transit ticketing industries.
Tier 3 vendors caters around 30% to 35% of the global transit ticketing market share. These vendors are introducing new and specialized ticketing solutions that cater to specific industry needs. Key players in this tier include Scheidt & Bachmann, Vix Technology and Masabi.
Tier 3 vendors are focused on innovation enables them to provide unique solutions tailored to specific customer requirements such as customized fare structures, regional transit integration and user-friendly interfaces. By attracting a distinctive client and offering specialized services vendors play a vital role in enhancing the overall functionality of transit ticketing systems and improving the performance of public transportation.
The section highlights the CAGRs of countries experiencing growth in the transit ticketing market, along with the latest advancements contributing to overall market development. Based on current estimates, India, China and Germany are expected to see steady growth during the forecast period.
| Countries | CAGR from 2025 to 2035 |
|---|---|
| India | 18.0% |
| China | 16.6% |
| United Kingdom | 10.6% |
| Australia & New Zealand | 17.1% |
| United States | 11.6% |
According to Airports Authority of India (AAI) the aviation sector in India experiencing significant growth at a CAGR 10% increase in passenger traffic. The airports are under pressure to enhance operational efficiency. To address such challenges, the Indian government promoting for adoption of advanced technologies through various initiatives such as National Civil Aviation Policy 2020 supports modernization and efficiency improvements.
The demand is accelerating the integration of digital and contactless ticketing systems, which help to streamline check-in processes, reduce waiting times and improve overall passenger experience. India is anticipated to see substantial growth at a CAGR 18.0% from 2025 to 2035 in the transit ticketing market as airports implement these advanced solutions to meet the evolving needs of travelers.
The Chinese government’s promise of advancement in urban mobility is evident through various initiatives such as 14th Five-Year Plan helps in integration of technology to improve transportation efficiency. According to the Ministry of Transport, the focus includes deploying smart ticketing solutions help to streamline fare collection processes and enhance overall passenger experience.
Recent developments in China such as introduction of the “Smart Transportation City” initiative, aim to leverage mobile apps and contactless payment systems to create more seamless and user-friendly transit experience.
China is anticipated to see faster growth in the transit ticketing poised at a CAGR 16.6% from the period 2025 to 2035 and projected to drive the market to USD 5,869.2 million by 2035, indicating a significant rise in adoption and market value driven by both regulatory support and technological advancements.
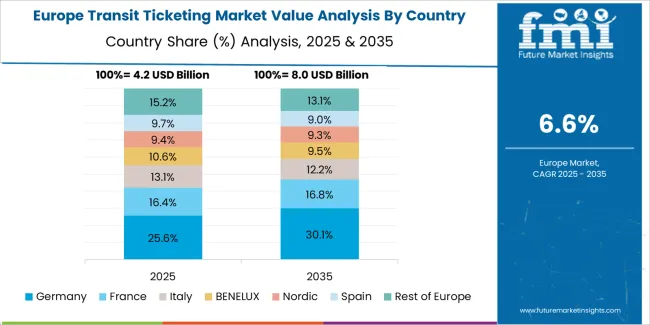
The government commitment for modernizing public transportation is highlighted by the “Digitalisierungsoffensive” (Digitalization Offensive), aims to integrate advanced technologies into urban transit systems. According to Federal Ministry of Digital and Transport 70% of public transit riders in major cities like Berlin and Munich are now using mobile apps and contactless smart cards for their daily commutes.
A recent study by Institute for Mobility Research indicates the integration of technologies has led to 25% reduction in boarding times and 15% increase in passenger satisfaction. Germany transit ticketing market is anticipated to grow at a CAGR of 11.9% from 2025 to 2035, fuel by technological advancements and the government’s push for digital innovation in public transit.
The section below offers in-depth insights into leading segments. The ticketing infrastructure category includes hardware, software and services. Also, under transportation type category includes urban transportation and mainline transportation. Among these segments, system integration gained vast popularity and experiencing a booming development, while urban transportation holds dominant market share excelled in adopting advanced ticketing solutions.
Recent developments in transit sector highlight the importance of integrating payment systems with ticketing infrastructure to streamline operations and improving user experiences. According to USA Department of Transportation, cities have adopted integrated payment solutions have seen a 25% reduction in transaction processing times and a 20% increase in fare revenue efficiency.
The Metropolitan Transportation Authority in New York successfully implemented seamless integration resulting in smoother fare collection and enhanced operational coordination across its network. The need for efficient and user-friendly transit systems reflects a broader industry movement towards modernizing infrastructure to meet growing demands.
The transit authorities are progressively investing in integration services to boost system performance and passenger satisfaction. System Integration services have reported to cover a share value of 39.5% for 2025.
| Segment | System Integration (Ticketing Infrastructure Services) |
|---|---|
| Value Share (2025) | 39.5% |
As the urban areas face increasing commuter volumes, the need for ticketing systems has become more demanding. According to European Commission highlights the implementation of advanced ticketing technologies in cities such as London and Paris have led to a 30% reduction in boarding times and 20% improvement in fare collection accuracy.
Also, the London Underground’s introduction of contactless payment methods has streamlined passenger flow and minimized delays. In 2025, According to International Association of Public Transport, cities adopting such solutions have seen a significant rise in operational efficiency and customer satisfaction.
These developments are crucial for managing the complexities of high-density transit environments, emphasizing the importance of integrating modern ticketing systems to meet the demands of urban commuters. Urban Transportation are accounted to register 58.2% value share for global transit ticketing market.
| Segment | Urban Transportation (Transportation Type) |
|---|---|
| Value Share (2025) | 58.2% |
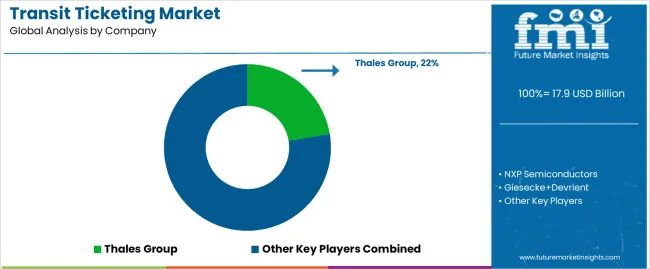
The transit ticketing market is competitive, driven by strategic partnerships and technological advancements. Vendors like Cubic Transportation Systems, Conduent Transportation, Thales and Scheidt & Bachmann are leading the industry by modernizing fare collection systems and introducing next-generation ticketing solutions.
Account-based ticketing and contactless payments are becoming standard, enhancing user convenience and driving market adoption. The focus on integrating multiple payment options, including NFC-enabled devices and smart cards, is intensifying competition as firms vie to offer the most comprehensive solutions. This competitive landscape is propelled by global expansions and collaborations in regions like Europe, Australia and Asia.
Industry Update
In terms of ticketing infrastructure, the industry is divided into hardware, software and services.
In terms of application, the industry is segregated into airports, bus transits, railways stations, sub-ways/metros, toll booths, smart parking facilities and others.
In terms of transportation type, the industry is segregated into urban transportation and mainline transportation.
A regional analysis has been carried out in key countries of North America, Latin America, Asia Pacific, Middle East and Africa (MEA), and Europe.
The global transit ticketing market is estimated to be valued at USD 17.9 billion in 2025.
The market size for the transit ticketing market is projected to reach USD 35.8 billion by 2035.
The transit ticketing market is expected to grow at a 7.2% CAGR between 2025 and 2035.
The key product types in transit ticketing market are hardware, software and services.
In terms of application, railways stations segment to command 25.0% share in the transit ticketing market in 2025.


Full Research Suite comprises of:
Market outlook & trends analysis
Interviews & case studies
Strategic recommendations
Vendor profiles & capabilities analysis
5-year forecasts
8 regions and 60+ country-level data splits
Market segment data splits
12 months of continuous data updates
DELIVERED AS:
PDF EXCEL ONLINE
Transit Station Display Boards Market
2D Transition Metal Carbides Nitrides Market Size and Share Forecast Outlook 2025 to 2035
Rail Transit Vehicle Glass Market Size and Share Forecast Outlook 2025 to 2035
Open Transition Transfer Switch Market Size and Share Forecast Outlook 2025 to 2035
State Transition Testing Market Size and Share Forecast Outlook 2025 to 2035
Floor Transition Strips Market Analysis - Size, Share, and Forecast Outlook 2025 to 2035
Closed Transition Transfer Switch Market Size and Share Forecast Outlook 2025 to 2035
Smart Ticketing Market Size and Share Forecast Outlook 2025 to 2035
Contactless Ticketing Market Analysis – Growth & Forecast through 2034
Contactless Ticketing ICs Market

Thank you!
You will receive an email from our Business Development Manager. Please be sure to check your SPAM/JUNK folder too.
Chat With
MaRIA