State Transition Testing Market Size and Share Forecast Outlook 2025 to 2035

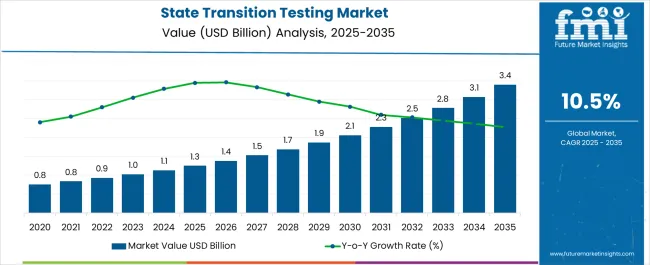
The state transition testing market is estimated to be valued at USD 1.3 billion in 2025. As per Future Market Insights, a top research partner for Fortune 1000 companies, the market is projected to reach USD 3.4 billion by 2035, registering a compound annual growth rate (CAGR) of 10.5% over the forecast period.
Quick Stats for State Transition Testing Market

  • State Transition Testing Market Value (2025): USD 1.3 billion
  • State Transition Testing Market Forecast Value (2035): USD 3.4 billion
  • State Transition Testing Market Forecast CAGR: 10.5%
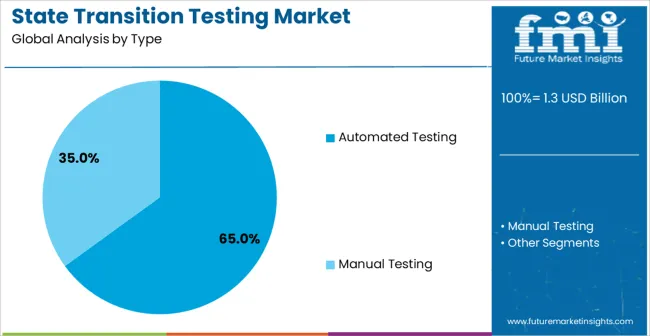
  • Leading Segment in State Transition Testing Market in 2025: Automated Testing (65.0%)
  • Key Growth Regions in State Transition Testing Market: North America, Asia-Pacific, Europe
  • Top Key Players in State Transition Testing Market: Ideyatech, Inc., tesena s.r.o., DeRisk QA, Sparx Systems Pty Ltd., Prezi Inc., Intertek Group plc, Stratfor Enterprises, LLC, RiseSmart, Inc.

State Transition Testing Market Market Value Analysis

State Transition Testing Market Key Takeaways

Metric Value
State Transition Testing Market Estimated Value in (2025 E) USD 1.3 billion
State Transition Testing Market Forecast Value in (2035 F) USD 3.4 billion
Forecast CAGR (2025 to 2035) 10.5%

Why is the State Transition Testing Market Growing?

The State Transition Testing market is being driven by the growing need for improved software reliability, especially in complex systems where state-dependent behavior must be validated to ensure performance and safety. The current market scenario reflects a strong preference for automated testing methods, which have gained prominence as organizations move toward faster development cycles and continuous integration pipelines.

Increased digitization in sectors such as banking, financial services, and insurance has further accelerated the adoption of state transition testing, as these industries require robust validation processes to maintain operational stability and regulatory compliance. The ability to simulate multiple states and transitions through automation has reduced testing time and enhanced fault detection.

With the rapid expansion of software-based services and increasing investment in test automation tools, the market is expected to continue growing steadily As software complexity rises, and companies prioritize efficiency and quality, state transition testing is being positioned as a critical component of the software development lifecycle, with future opportunities expected in cloud-based testing solutions and AI-supported test generation.

Segmental Analysis

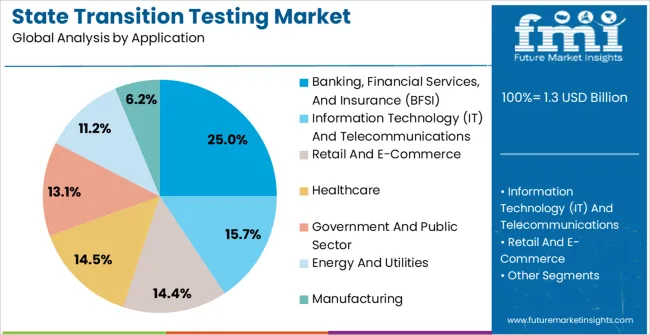
The state transition testing market is segmented by type, application, and geographic regions. By type, state transition testing market is divided into Automated Testing and Manual Testing. In terms of application, state transition testing market is classified into Banking, Financial Services, And Insurance (BFSI), Information Technology (IT) And Telecommunications, Retail And E-Commerce, Healthcare, Government And Public Sector, Energy And Utilities, and Manufacturing. Regionally, the state transition testing industry is classified into North America, Latin America, Western Europe, Eastern Europe, Balkan & Baltic Countries, Russia & Belarus, Central Asia, East Asia, South Asia & Pacific, and the Middle East & Africa.
Insights into the Automated Testing Segment

State Transition Testing Market Analysis By Type

The Automated Testing segment is estimated to hold 65.00% of the State Transition Testing market revenue share in 2025, making it the largest segment in terms of testing type. The prominence of this segment has been driven by its ability to enhance testing efficiency and accuracy across software applications that require validation of multiple states and transitions. Automation is increasingly being used to address the complexities associated with state-dependent processes, reducing the need for manual intervention while improving fault coverage.

The rising demand for faster time-to-market and cost-effective validation has accelerated its adoption across enterprises. The segment’s growth has been supported by the integration of automated test scripts with continuous integration and delivery pipelines, enabling early fault detection.

Furthermore, automated testing tools have been integrated with advanced frameworks that allow parameterization and reuse of test cases, which enhances their scalability and applicability As enterprises seek to optimize testing efforts while improving software quality, automated testing is expected to maintain its leadership position in the market.
Insights into the Banking, Financial Services, And Insurance Segment

State Transition Testing Market Analysis By Application

The Banking, Financial Services, and Insurance segment is projected to account for 25.00% of the State Transition Testing market revenue share in 2025, making it a key application area. This segment’s prominence has been driven by the critical need for robust software validation in systems that process sensitive financial transactions and customer data.

The complexity of state-dependent operations, such as transaction workflows, risk management, and fraud detection, has necessitated the adoption of state transition testing to ensure accuracy and resilience. Increasing regulatory requirements related to data security, operational transparency, and compliance have further accelerated the use of automated testing tools in this sector.

Additionally, the growing reliance on digital banking platforms, mobile payment systems, and insurance claim processing has increased the scope for testing state transitions, which are often at the core of these applications With the need for uninterrupted service and fault-free operations, the banking, financial services, and insurance sector is expected to continue investing in state transition testing as a core strategy to enhance software reliability and meet customer expectations.

Market Overview

State Transition Testing Market: Introduction

The state transition testing is defined as the technique of testing the changes in input conditions which may cause state changes in the application under test. State transition testing is a black box testing technique where the behavior of an application under test is analyzed by the tester for different input conditions in a sequence.

In the state transition testing technique, tester which analysed the conditions provides both the positive as well as negative input test values and record the same. Here, the finite system gets a different output for the same input, depending upon conditions happened before.

Furthermore, the state transition testing is the model on which the system along with tests are based. State transition testing technique is widely used and are helpful where you need to test different system transitions.

State transition testing are majorly used when a tester is analyzing or testing the application for a finite set of input values, trying to test the sequence of events occurring in the application under test, when the system has the dependency on the values or events in the past. Furthermore, states, transitions, events, and actions are the four main components of the state transition model.
Analysis of State Transition Testing Market By Key Countries

State Transition Testing Market Cagr Analysis By Country

Country CAGR
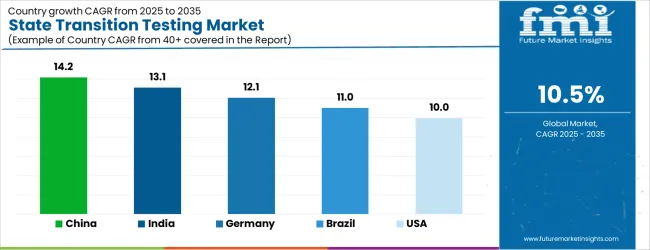
China 14.2%
India 13.1%
Germany 12.1%
Brazil 11.0%
USA 10.0%
UK 8.9%
Japan 7.9%

Country-wise Analysis

The State Transition Testing Market is expected to register a CAGR of 10.5% during the forecast period, exhibiting varied country level momentum. China leads with the highest CAGR of 14.2%, followed by India at 13.1%. Developed markets such as Germany, France, and the UK continue to expand steadily, while the USA is likely to grow at consistent rates. Japan posts the lowest CAGR at 7.9%, yet still underscores a broadly positive trajectory for the global State Transition Testing Market. In 2024, Germany held a dominant revenue in the Western Europe market and is expected to grow with a CAGR of 12.1%. The USA State Transition Testing Market is estimated to be valued at USD 437.5 million in 2025 and is anticipated to reach a valuation of USD 437.5 million by 2035. Sales are projected to rise at a CAGR of 0.0% over the forecast period between 2025 and 2035. While Japan and South Korea markets are estimated to be valued at USD 64.6 million and USD 40.1 million respectively in 2025.
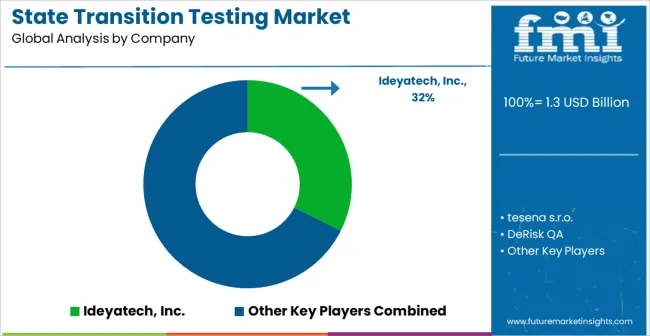
Key Players in the State Transition Testing Market

State Transition Testing Market Analysis By Company

  • Ideyatech, Inc.
  • tesena s.r.o.
  • DeRisk QA
  • Sparx Systems Pty Ltd.
  • Prezi Inc.
  • Intertek Group plc
  • Stratfor Enterprises, LLC
  • RiseSmart, Inc.

Scope of the Report

Item Value
Quantitative Units USD 1.3 Billion
Type Automated Testing and Manual Testing
Application Banking, Financial Services, And Insurance (BFSI), Information Technology (IT) And Telecommunications, Retail And E-Commerce, Healthcare, Government And Public Sector, Energy And Utilities, and Manufacturing
Regions Covered North America, Europe, Asia-Pacific, Latin America, Middle East & Africa
Country Covered United States, Canada, Germany, France, United Kingdom, China, Japan, India, Brazil, South Africa
Key Companies Profiled Ideyatech, Inc., tesena s.r.o., DeRisk QA, Sparx Systems Pty Ltd., Prezi Inc., Intertek Group plc, Stratfor Enterprises, LLC, and RiseSmart, Inc.

State Transition Testing Market by Segments

Type:

  • Automated Testing
  • Manual Testing

Application:

  • Banking, Financial Services, And Insurance (BFSI)
  • Information Technology (IT) And Telecommunications
  • Retail And E-Commerce
  • Healthcare
  • Government And Public Sector
  • Energy And Utilities
  • Manufacturing

Region:

  • North America
    • USA
    • Canada
    • Mexico
  • Latin America
    • Brazil
    • Chile
    • Rest of Latin America
  • Western Europe
    • Germany
    • UK
    • Italy
    • Spain
    • France
    • Nordic
    • BENELUX
    • Rest of Western Europe
  • Eastern Europe
    • Russia
    • Poland
    • Hungary
    • Balkan & Baltic
    • Rest of Eastern Europe
  • East Asia
    • China
    • Japan
    • South Korea
  • South Asia and Pacific
    • India
    • ASEAN
    • Australia & New Zealand
    • Rest of South Asia and Pacific
  • Middle East & Africa
    • Kingdom of Saudi Arabia
    • Other GCC Countries
    • Turkiye
    • South Africa
    • Other African Union
    • Rest of Middle East & Africa

Table of Content

  1. Executive Summary
    • Global Market Outlook
    • Demand-side Trends
    • Supply-side Trends
    • Technology Roadmap Analysis
    • Analysis and Recommendations
  2. Market Overview
    • Market Coverage / Taxonomy
    • Market Definition / Scope / Limitations
  3. Market Background
    • Market Dynamics
      • Drivers
      • Restraints
      • Opportunity
      • Trends
    • Scenario Forecast
      • Demand in Optimistic Scenario
      • Demand in Likely Scenario
      • Demand in Conservative Scenario
    • Opportunity Map Analysis
    • Product Life Cycle Analysis
    • Supply Chain Analysis
    • Investment Feasibility Matrix
    • Value Chain Analysis
    • PESTLE and Porter’s Analysis
    • Regulatory Landscape
    • Regional Parent Market Outlook
    • Production and Consumption Statistics
    • Import and Export Statistics
  4. Global Market Analysis 2020 to 2024 and Forecast, 2025 to 2035
    • Historical Market Size Value (USD Million) Analysis, 2020 to 2024
    • Current and Future Market Size Value (USD Million) Projections, 2025 to 2035
      • Y-o-Y Growth Trend Analysis
      • Absolute $ Opportunity Analysis
  5. Global Market Pricing Analysis 2020 to 2024 and Forecast 2025 to 2035
  6. Global Market Analysis 2020 to 2024 and Forecast 2025 to 2035, By Type
    • Introduction / Key Findings
    • Historical Market Size Value (USD Million) Analysis By Type , 2020 to 2024
    • Current and Future Market Size Value (USD Million) Analysis and Forecast By Type , 2025 to 2035
      • Automated Testing
      • Manual Testing
    • Y-o-Y Growth Trend Analysis By Type , 2020 to 2024
    • Absolute $ Opportunity Analysis By Type , 2025 to 2035
  7. Global Market Analysis 2020 to 2024 and Forecast 2025 to 2035, By Application
    • Introduction / Key Findings
    • Historical Market Size Value (USD Million) Analysis By Application, 2020 to 2024
    • Current and Future Market Size Value (USD Million) Analysis and Forecast By Application, 2025 to 2035
      • Banking, Financial Services, And Insurance (BFSI)
      • Information Technology (IT) And Telecommunications
      • Retail And E-Commerce
      • Healthcare
      • Government And Public Sector
      • Energy And Utilities
      • Manufacturing
    • Y-o-Y Growth Trend Analysis By Application, 2020 to 2024
    • Absolute $ Opportunity Analysis By Application, 2025 to 2035
  8. Global Market Analysis 2020 to 2024 and Forecast 2025 to 2035, By Region
    • Introduction
    • Historical Market Size Value (USD Million) Analysis By Region, 2020 to 2024
    • Current Market Size Value (USD Million) Analysis and Forecast By Region, 2025 to 2035
      • North America
      • Latin America
      • Western Europe
      • Eastern Europe
      • East Asia
      • South Asia and Pacific
      • Middle East & Africa
    • Market Attractiveness Analysis By Region
  9. North America Market Analysis 2020 to 2024 and Forecast 2025 to 2035, By Country
    • Historical Market Size Value (USD Million) Trend Analysis By Market Taxonomy, 2020 to 2024
    • Market Size Value (USD Million) Forecast By Market Taxonomy, 2025 to 2035
      • By Country
        • USA
        • Canada
        • Mexico
      • By Type
      • By Application
    • Market Attractiveness Analysis
      • By Country
      • By Type
      • By Application
    • Key Takeaways
  10. Latin America Market Analysis 2020 to 2024 and Forecast 2025 to 2035, By Country
    • Historical Market Size Value (USD Million) Trend Analysis By Market Taxonomy, 2020 to 2024
    • Market Size Value (USD Million) Forecast By Market Taxonomy, 2025 to 2035
      • By Country
        • Brazil
        • Chile
        • Rest of Latin America
      • By Type
      • By Application
    • Market Attractiveness Analysis
      • By Country
      • By Type
      • By Application
    • Key Takeaways
  11. Western Europe Market Analysis 2020 to 2024 and Forecast 2025 to 2035, By Country
    • Historical Market Size Value (USD Million) Trend Analysis By Market Taxonomy, 2020 to 2024
    • Market Size Value (USD Million) Forecast By Market Taxonomy, 2025 to 2035
      • By Country
        • Germany
        • UK
        • Italy
        • Spain
        • France
        • Nordic
        • BENELUX
        • Rest of Western Europe
      • By Type
      • By Application
    • Market Attractiveness Analysis
      • By Country
      • By Type
      • By Application
    • Key Takeaways
  12. Eastern Europe Market Analysis 2020 to 2024 and Forecast 2025 to 2035, By Country
    • Historical Market Size Value (USD Million) Trend Analysis By Market Taxonomy, 2020 to 2024
    • Market Size Value (USD Million) Forecast By Market Taxonomy, 2025 to 2035
      • By Country
        • Russia
        • Poland
        • Hungary
        • Balkan & Baltic
        • Rest of Eastern Europe
      • By Type
      • By Application
    • Market Attractiveness Analysis
      • By Country
      • By Type
      • By Application
    • Key Takeaways
  13. East Asia Market Analysis 2020 to 2024 and Forecast 2025 to 2035, By Country
    • Historical Market Size Value (USD Million) Trend Analysis By Market Taxonomy, 2020 to 2024
    • Market Size Value (USD Million) Forecast By Market Taxonomy, 2025 to 2035
      • By Country
        • China
        • Japan
        • South Korea
      • By Type
      • By Application
    • Market Attractiveness Analysis
      • By Country
      • By Type
      • By Application
    • Key Takeaways
  14. South Asia and Pacific Market Analysis 2020 to 2024 and Forecast 2025 to 2035, By Country
    • Historical Market Size Value (USD Million) Trend Analysis By Market Taxonomy, 2020 to 2024
    • Market Size Value (USD Million) Forecast By Market Taxonomy, 2025 to 2035
      • By Country
        • India
        • ASEAN
        • Australia & New Zealand
        • Rest of South Asia and Pacific
      • By Type
      • By Application
    • Market Attractiveness Analysis
      • By Country
      • By Type
      • By Application
    • Key Takeaways
  15. Middle East & Africa Market Analysis 2020 to 2024 and Forecast 2025 to 2035, By Country
    • Historical Market Size Value (USD Million) Trend Analysis By Market Taxonomy, 2020 to 2024
    • Market Size Value (USD Million) Forecast By Market Taxonomy, 2025 to 2035
      • By Country
        • Kingdom of Saudi Arabia
        • Other GCC Countries
        • Turkiye
        • South Africa
        • Other African Union
        • Rest of Middle East & Africa
      • By Type
      • By Application
    • Market Attractiveness Analysis
      • By Country
      • By Type
      • By Application
    • Key Takeaways
  16. Key Countries Market Analysis
    • USA
      • Pricing Analysis
      • Market Share Analysis, 2024
        • By Type
        • By Application
    • Canada
      • Pricing Analysis
      • Market Share Analysis, 2024
        • By Type
        • By Application
    • Mexico
      • Pricing Analysis
      • Market Share Analysis, 2024
        • By Type
        • By Application
    • Brazil
      • Pricing Analysis
      • Market Share Analysis, 2024
        • By Type
        • By Application
    • Chile
      • Pricing Analysis
      • Market Share Analysis, 2024
        • By Type
        • By Application
    • Germany
      • Pricing Analysis
      • Market Share Analysis, 2024
        • By Type
        • By Application
    • UK
      • Pricing Analysis
      • Market Share Analysis, 2024
        • By Type
        • By Application
    • Italy
      • Pricing Analysis
      • Market Share Analysis, 2024
        • By Type
        • By Application
    • Spain
      • Pricing Analysis
      • Market Share Analysis, 2024
        • By Type
        • By Application
    • France
      • Pricing Analysis
      • Market Share Analysis, 2024
        • By Type
        • By Application
    • India
      • Pricing Analysis
      • Market Share Analysis, 2024
        • By Type
        • By Application
    • ASEAN
      • Pricing Analysis
      • Market Share Analysis, 2024
        • By Type
        • By Application
    • Australia & New Zealand
      • Pricing Analysis
      • Market Share Analysis, 2024
        • By Type
        • By Application
    • China
      • Pricing Analysis
      • Market Share Analysis, 2024
        • By Type
        • By Application
    • Japan
      • Pricing Analysis
      • Market Share Analysis, 2024
        • By Type
        • By Application
    • South Korea
      • Pricing Analysis
      • Market Share Analysis, 2024
        • By Type
        • By Application
    • Russia
      • Pricing Analysis
      • Market Share Analysis, 2024
        • By Type
        • By Application
    • Poland
      • Pricing Analysis
      • Market Share Analysis, 2024
        • By Type
        • By Application
    • Hungary
      • Pricing Analysis
      • Market Share Analysis, 2024
        • By Type
        • By Application
    • Kingdom of Saudi Arabia
      • Pricing Analysis
      • Market Share Analysis, 2024
        • By Type
        • By Application
    • Turkiye
      • Pricing Analysis
      • Market Share Analysis, 2024
        • By Type
        • By Application
    • South Africa
      • Pricing Analysis
      • Market Share Analysis, 2024
        • By Type
        • By Application
  17. Market Structure Analysis
    • Competition Dashboard
    • Competition Benchmarking
    • Market Share Analysis of Top Players
      • By Regional
      • By Type
      • By Application
  18. Competition Analysis
    • Competition Deep Dive
      • Ideyatech, Inc.
        • Overview
        • Product Portfolio
        • Profitability by Market Segments (Product/Age /Sales Channel/Region)
        • Sales Footprint
        • Strategy Overview
          • Marketing Strategy
          • Product Strategy
          • Channel Strategy
      • tesena s.r.o.
      • DeRisk QA
      • Sparx Systems Pty Ltd.
      • Prezi Inc.
      • Intertek Group plc
      • Stratfor Enterprises, LLC
      • RiseSmart, Inc.
  19. Assumptions & Acronyms Used
  20. Research Methodology

List of Tables

  • Table 1: Global Market Value (USD Million) Forecast by Region, 2020 to 2035
  • Table 2: Global Market Value (USD Million) Forecast by Type , 2020 to 2035
  • Table 3: Global Market Value (USD Million) Forecast by Application, 2020 to 2035
  • Table 4: North America Market Value (USD Million) Forecast by Country, 2020 to 2035
  • Table 5: North America Market Value (USD Million) Forecast by Type , 2020 to 2035
  • Table 6: North America Market Value (USD Million) Forecast by Application, 2020 to 2035
  • Table 7: Latin America Market Value (USD Million) Forecast by Country, 2020 to 2035
  • Table 8: Latin America Market Value (USD Million) Forecast by Type , 2020 to 2035
  • Table 9: Latin America Market Value (USD Million) Forecast by Application, 2020 to 2035
  • Table 10: Western Europe Market Value (USD Million) Forecast by Country, 2020 to 2035
  • Table 11: Western Europe Market Value (USD Million) Forecast by Type , 2020 to 2035
  • Table 12: Western Europe Market Value (USD Million) Forecast by Application, 2020 to 2035
  • Table 13: Eastern Europe Market Value (USD Million) Forecast by Country, 2020 to 2035
  • Table 14: Eastern Europe Market Value (USD Million) Forecast by Type , 2020 to 2035
  • Table 15: Eastern Europe Market Value (USD Million) Forecast by Application, 2020 to 2035
  • Table 16: East Asia Market Value (USD Million) Forecast by Country, 2020 to 2035
  • Table 17: East Asia Market Value (USD Million) Forecast by Type , 2020 to 2035
  • Table 18: East Asia Market Value (USD Million) Forecast by Application, 2020 to 2035
  • Table 19: South Asia and Pacific Market Value (USD Million) Forecast by Country, 2020 to 2035
  • Table 20: South Asia and Pacific Market Value (USD Million) Forecast by Type , 2020 to 2035
  • Table 21: South Asia and Pacific Market Value (USD Million) Forecast by Application, 2020 to 2035
  • Table 22: Middle East & Africa Market Value (USD Million) Forecast by Country, 2020 to 2035
  • Table 23: Middle East & Africa Market Value (USD Million) Forecast by Type , 2020 to 2035
  • Table 24: Middle East & Africa Market Value (USD Million) Forecast by Application, 2020 to 2035

List of Figures

  • Figure 1: Global Market Pricing Analysis
  • Figure 2: Global Market Value (USD Million) Forecast 2020 to 2035
  • Figure 3: Global Market Value Share and BPS Analysis by Type , 2025 and 2035
  • Figure 4: Global Market Y-o-Y Growth Comparison by Type , 2025 to 2035
  • Figure 5: Global Market Attractiveness Analysis by Type
  • Figure 6: Global Market Value Share and BPS Analysis by Application, 2025 and 2035
  • Figure 7: Global Market Y-o-Y Growth Comparison by Application, 2025 to 2035
  • Figure 8: Global Market Attractiveness Analysis by Application
  • Figure 9: Global Market Value (USD Million) Share and BPS Analysis by Region, 2025 and 2035
  • Figure 10: Global Market Y-o-Y Growth Comparison by Region, 2025 to 2035
  • Figure 11: Global Market Attractiveness Analysis by Region
  • Figure 12: North America Market Incremental Dollar Opportunity, 2025 to 2035
  • Figure 13: Latin America Market Incremental Dollar Opportunity, 2025 to 2035
  • Figure 14: Western Europe Market Incremental Dollar Opportunity, 2025 to 2035
  • Figure 15: Eastern Europe Market Incremental Dollar Opportunity, 2025 to 2035
  • Figure 16: East Asia Market Incremental Dollar Opportunity, 2025 to 2035
  • Figure 17: South Asia and Pacific Market Incremental Dollar Opportunity, 2025 to 2035
  • Figure 18: Middle East & Africa Market Incremental Dollar Opportunity, 2025 to 2035
  • Figure 19: North America Market Value Share and BPS Analysis by Country, 2025 and 2035
  • Figure 20: North America Market Value Share and BPS Analysis by Type , 2025 and 2035
  • Figure 21: North America Market Y-o-Y Growth Comparison by Type , 2025 to 2035
  • Figure 22: North America Market Attractiveness Analysis by Type
  • Figure 23: North America Market Value Share and BPS Analysis by Application, 2025 and 2035
  • Figure 24: North America Market Y-o-Y Growth Comparison by Application, 2025 to 2035
  • Figure 25: North America Market Attractiveness Analysis by Application
  • Figure 26: Latin America Market Value Share and BPS Analysis by Country, 2025 and 2035
  • Figure 27: Latin America Market Value Share and BPS Analysis by Type , 2025 and 2035
  • Figure 28: Latin America Market Y-o-Y Growth Comparison by Type , 2025 to 2035
  • Figure 29: Latin America Market Attractiveness Analysis by Type
  • Figure 30: Latin America Market Value Share and BPS Analysis by Application, 2025 and 2035
  • Figure 31: Latin America Market Y-o-Y Growth Comparison by Application, 2025 to 2035
  • Figure 32: Latin America Market Attractiveness Analysis by Application
  • Figure 33: Western Europe Market Value Share and BPS Analysis by Country, 2025 and 2035
  • Figure 34: Western Europe Market Value Share and BPS Analysis by Type , 2025 and 2035
  • Figure 35: Western Europe Market Y-o-Y Growth Comparison by Type , 2025 to 2035
  • Figure 36: Western Europe Market Attractiveness Analysis by Type
  • Figure 37: Western Europe Market Value Share and BPS Analysis by Application, 2025 and 2035
  • Figure 38: Western Europe Market Y-o-Y Growth Comparison by Application, 2025 to 2035
  • Figure 39: Western Europe Market Attractiveness Analysis by Application
  • Figure 40: Eastern Europe Market Value Share and BPS Analysis by Country, 2025 and 2035
  • Figure 41: Eastern Europe Market Value Share and BPS Analysis by Type , 2025 and 2035
  • Figure 42: Eastern Europe Market Y-o-Y Growth Comparison by Type , 2025 to 2035
  • Figure 43: Eastern Europe Market Attractiveness Analysis by Type
  • Figure 44: Eastern Europe Market Value Share and BPS Analysis by Application, 2025 and 2035
  • Figure 45: Eastern Europe Market Y-o-Y Growth Comparison by Application, 2025 to 2035
  • Figure 46: Eastern Europe Market Attractiveness Analysis by Application
  • Figure 47: East Asia Market Value Share and BPS Analysis by Country, 2025 and 2035
  • Figure 48: East Asia Market Value Share and BPS Analysis by Type , 2025 and 2035
  • Figure 49: East Asia Market Y-o-Y Growth Comparison by Type , 2025 to 2035
  • Figure 50: East Asia Market Attractiveness Analysis by Type
  • Figure 51: East Asia Market Value Share and BPS Analysis by Application, 2025 and 2035
  • Figure 52: East Asia Market Y-o-Y Growth Comparison by Application, 2025 to 2035
  • Figure 53: East Asia Market Attractiveness Analysis by Application
  • Figure 54: South Asia and Pacific Market Value Share and BPS Analysis by Country, 2025 and 2035
  • Figure 55: South Asia and Pacific Market Value Share and BPS Analysis by Type , 2025 and 2035
  • Figure 56: South Asia and Pacific Market Y-o-Y Growth Comparison by Type , 2025 to 2035
  • Figure 57: South Asia and Pacific Market Attractiveness Analysis by Type
  • Figure 58: South Asia and Pacific Market Value Share and BPS Analysis by Application, 2025 and 2035
  • Figure 59: South Asia and Pacific Market Y-o-Y Growth Comparison by Application, 2025 to 2035
  • Figure 60: South Asia and Pacific Market Attractiveness Analysis by Application
  • Figure 61: Middle East & Africa Market Value Share and BPS Analysis by Country, 2025 and 2035
  • Figure 62: Middle East & Africa Market Value Share and BPS Analysis by Type , 2025 and 2035
  • Figure 63: Middle East & Africa Market Y-o-Y Growth Comparison by Type , 2025 to 2035
  • Figure 64: Middle East & Africa Market Attractiveness Analysis by Type
  • Figure 65: Middle East & Africa Market Value Share and BPS Analysis by Application, 2025 and 2035
  • Figure 66: Middle East & Africa Market Y-o-Y Growth Comparison by Application, 2025 to 2035
  • Figure 67: Middle East & Africa Market Attractiveness Analysis by Application
  • Figure 68: Global Market – Tier Structure Analysis
  • Figure 69: Global Market – Company Share Analysis

Frequently Asked Questions

How big is the state transition testing market in 2025?

The global state transition testing market is estimated to be valued at USD 1.3 billion in 2025.

What will be the size of state transition testing market in 2035?

The market size for the state transition testing market is projected to reach USD 3.4 billion by 2035.

How much will be the state transition testing market growth between 2025 and 2035?

The state transition testing market is expected to grow at a 10.5% CAGR between 2025 and 2035.

What are the key product types in the state transition testing market?

The key product types in state transition testing market are automated testing and manual testing.

Which application segment to contribute significant share in the state transition testing market in 2025?

In terms of application, banking, financial services, and insurance (bfsi) segment to command 25.0% share in the state transition testing market in 2025.

Explore Similar Insights

Future Market Insights

State Transition Testing Market

Chat With MaRIA

Chat With

MaRIA

Hi There, I am MaRIA, Your Market Research Intelligence Assistant. How may I help you?