The global tritium light source market is valued at USD 225.4 million in 2025. It is projected to reach USD 308.9 million by 2035, representing an absolute increase of USD 83.5 million over the forecast period. This translates into a total growth of 34.7%, with the market forecast to expand at a compound annual growth rate (CAGR) of 3.2% between 2025 and 2035. The overall market size is expected to grow by nearly 1.3X during the same period, supported by increasing demand for self-powered lighting solutions, growing adoption in defense and aerospace applications, and rising requirements for reliable illumination in critical industrial environments across diverse operational conditions.
Between 2025 and 2030, the tritium light source market is projected to expand from USD 225.4 million to USD 256.8 million, resulting in a value increase of USD 31.4 million, which represents 40.1% of the total forecast growth for the decade. This phase of development will be shaped by increasing defense modernization programs, rising adoption of self-powered lighting in critical infrastructure, and growing demand for maintenance-free illumination solutions in harsh operating environments. As per Future Market Insights, a top research partner for Fortune 1000 companies, equipment manufacturers are expanding their production capabilities to address the growing demand for reliable tritium-based lighting solutions and enhanced operational durability.
From 2030 to 2035, the market is forecast to grow from USD 256.8 million to USD 303.7 million, adding another USD 46.9 million, which constitutes 59.9% of the overall ten-year expansion. This period is expected to be characterized by the expansion of advanced tritium light technologies, the integration of enhanced safety features and regulatory compliance standards, and the development of specialized applications for emerging industrial and defense requirements. The growing adoption of energy-independent lighting systems and enhanced operational reliability programs will drive demand for tritium light sources with improved luminosity and extended service life capabilities.
The growing focus on safety and regulatory requirements for lighting systems in public spaces is also driving market growth. Tritium light sources are widely used in emergency lighting systems, exit signs, and hazard warnings in commercial buildings, airports, and other public infrastructure. These lighting systems are often required by safety regulations to provide visibility during power outages or emergencies. Since tritium lights require no external power source and are maintenance-free, they are ideal for ensuring that emergency signage and lighting systems remain operational when they are needed most. As governments and regulatory bodies continue to enforce stringent safety standards, the adoption of tritium-based lighting solutions in public safety applications is expected to increase.
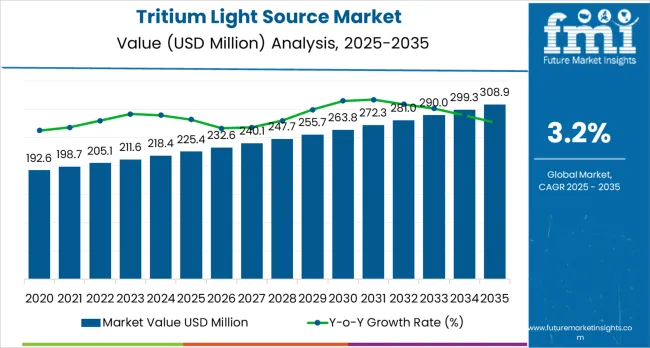
| Metric | Value |
|---|---|
| Estimated Value in (2025E) | USD 225.4 million |
| Forecast Value in (2035F) | USD 303.7 million |
| Forecast CAGR (2025 to 2035) | 3.2% |
Market expansion is being supported by the increasing demand for energy-independent lighting solutions and the corresponding need for reliable illumination systems that can maintain consistent performance and operational reliability while supporting diverse defense and industrial applications across various operational environments. Modern defense agencies and industrial facilities are increasingly focused on implementing lighting solutions that can provide uninterrupted illumination, minimize maintenance requirements, and deliver consistent performance in critical applications. Tritium light sources'proven ability to deliver enhanced reliability, maintenance-free operation, and versatile lighting applications make them essential components for contemporary defense systems and industrial safety solutions.
The growing emphasis on operational reliability and energy independence is driving demand for tritium light sources that can support critical applications, reduce maintenance dependencies, and enable efficient long-term operations across varying environmental conditions. End users'preference for lighting systems that combine reliability with operational efficiency and cost-effectiveness is creating opportunities for innovative tritium implementations. The rising influence of safety regulations and defense modernization programs is also contributing to increased adoption of tritium light sources that can provide advanced illumination capabilities without compromising performance or operational compliance.
The tritium light source market is positioned for steady growth and technological advancement. As defense agencies and industrial operators across both developed and emerging markets seek lighting solutions that are reliable, maintenance-free, energy-independent, and operationally efficient, tritium lighting systems are gaining prominence not just as illumination devices but as strategic components for operational readiness, safety enhancement, equipment reliability, and mission-critical performance.
Rising defense spending and industrial safety requirements in North America, Western Europe, and East Asia amplify demand, while manufacturers are advancing innovations in phosphor technologies and sealed tube manufacturing.
Pathways like enhanced luminosity systems, specialized military applications, and industrial safety integration promise strong margin opportunities, especially in developed defense markets. Geographic expansion and application diversification will capture volume, particularly where defense modernization is growing or industrial safety requirements are expanding. Regulatory pressures around operational safety, equipment reliability, performance standards, and compliance requirements provide structural support.
The market is segmented by visible light, application, end use sector, and region. By visible light, the market is divided into green, yellow, orange, red, blue, white, and purple. By application, it covers directional markers and navigation aids, aviation markers, warning lights/markers, and firearm accessories. By end use sector, it is segmented into civil and commercial, industrial infrastructure, and defense and aerospace. Regionally, the market is divided into North America, Latin America, Western Europe, Eastern Europe, East Asia, South Asia, and Middle East &Africa.
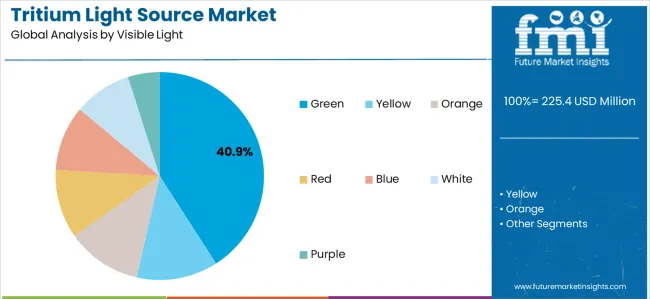
The green visible light segment is projected to account for 40.9% of the tritium light source market in 2025, reaffirming its position as the leading color category. Defense agencies and industrial operators increasingly utilize green tritium lights for their superior brightness perception by human eyes, established visibility advantages, and optimal performance in low-light operational environments across navigation systems, safety markers, and tactical equipment applications. Green light technology's proven visual efficiency and consistent luminosity output directly address the operational requirements for reliable visibility and enhanced performance recognition in diverse environmental conditions.
This visible light segment forms the foundation of current tritium applications, as it represents the technology with the greatest visual effectiveness and established performance characteristics across multiple applications and operational scenarios. User investments in enhanced green phosphor systems and brightness optimization continue to strengthen adoption among defense and industrial operators. With end users prioritizing visibility performance and operational effectiveness, green tritium lights align with both performance optimization objectives and operational reliability requirements, making them the central component of comprehensive tritium lighting strategies.
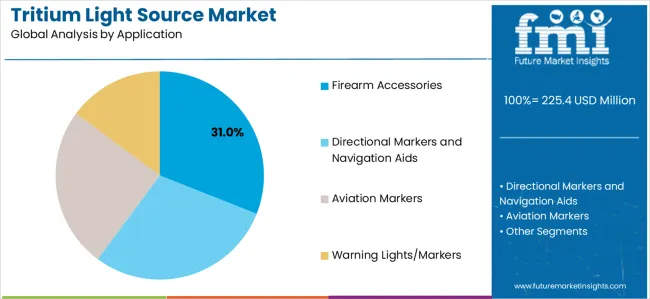
Firearm accessories are projected to represent 31.0% of tritium light source demand in 2025, underscoring their critical role as the primary application for military and law enforcement tactical equipment operations. Defense and security operators prefer tritium light sources for their reliability, maintenance-free operation, and ability to provide consistent illumination in tactical sights and targeting systems while supporting mission requirements and operational readiness. Positioned as essential components for modern military equipment, tritium accessories offer both performance advantages and operational benefits.
The segment is supported by continuous innovation in defense modernization programs and the growing availability of specialized tritium configurations that enable enhanced targeting accuracy with improved operational capabilities. Additionally, military and law enforcement agencies are investing in equipment optimization to support tactical operations and mission effectiveness. As defense requirements become more demanding and operational precision increases, firearm accessories will continue to dominate the application market while supporting advanced equipment performance and tactical operational strategies.
The tritium light source market is advancing steadily due to increasing defense modernization programs and growing adoption of energy-independent lighting infrastructure that provides enhanced reliability and operational performance across diverse tactical and industrial applications. However, the market faces challenges, including limited tritium supply availability, specialized manufacturing requirements, and varying regulatory frameworks across different operational environments. Innovation in phosphor coating technologies and sealed tube manufacturing continues to influence product development and market expansion patterns.
The growing expansion of defense capabilities and operational readiness initiatives is enabling manufacturers to develop tritium light systems that provide superior reliability, enhanced performance characteristics, and consistent operation in demanding tactical environments. Advanced tritium systems provide improved operational capacity while allowing more effective mission execution and reliable performance across various applications and operational requirements. Manufacturers are increasingly recognizing the competitive advantages of modern tritium capabilities for operational effectiveness and mission readiness positioning.
Modern tritium light source manufacturers are incorporating advanced phosphor coatings and precision manufacturing processes to enhance brightness output, extend operational life, and ensure consistent performance delivery to defense and industrial customers. These technologies improve product reliability while enabling new applications, including specialized tactical equipment and enhanced industrial safety systems. Advanced technology integration also allows manufacturers to support premium product positioning and performance optimization beyond traditional lighting applications.
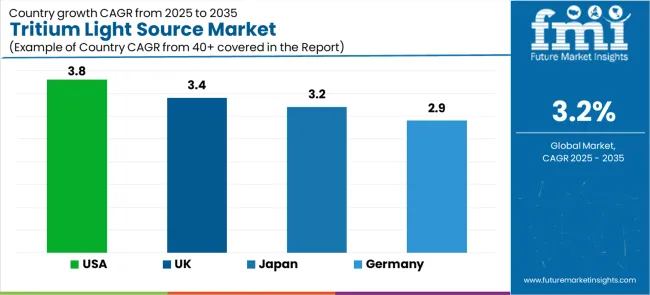
| Country | CAGR (2025-2035) |
|---|---|
| United States | 3.8% |
| Germany | 2.9% |
| United Kingdom | 3.4% |
| Japan | 3.2% |
The tritium light source market is experiencing steady growth globally, with ASEAN countries leading at a 5.2% CAGR through 2035, driven by expanding defense infrastructure, growing industrial development, and increasing adoption of advanced safety systems. The USA follows at 3.8%, supported by extensive defense modernization programs, aerospace industry requirements, and significant investment in tactical equipment upgrades. United Kingdom shows growth at 3.4%, emphasizing defense capabilities enhancement and industrial safety compliance. Japan records 3.2%, focusing on precision manufacturing and technology integration requirements. Germany demonstrates 2.9% growth, supported by advanced manufacturing capabilities and industrial safety standards.
The report covers an in-depth analysis of 40+ countries;five top-performing countries are highlighted below.
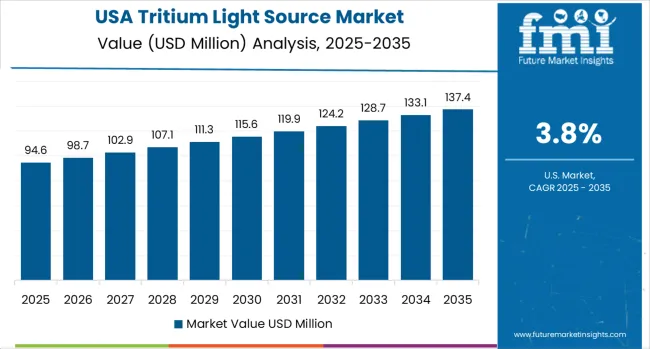
Revenue from tritium light sources in the USA is projected to exhibit strong growth with a CAGR of 3.8% through 2035, driven by extensive defense modernization initiatives and rapidly growing adoption of advanced tactical equipment supported by military procurement programs and operational readiness requirements. The country's comprehensive defense infrastructure and increasing investment in precision tactical systems are creating substantial demand for reliable tritium lighting solutions. Major defense contractors and military agencies are establishing comprehensive tritium programs to serve both domestic operational requirements and allied support obligations.
Revenue from tritium light sources in Germany is expanding at a CAGR of 2.9%, supported by the country's advanced manufacturing capabilities, precision engineering expertise, and comprehensive industrial safety programs. The country's established industrial sector and growing emphasis on operational safety are driving demand for reliable tritium technologies throughout the manufacturing market. Leading industrial companies and safety equipment manufacturers are establishing extensive tritium operations to address both domestic industrial needs and export market requirements.
Revenue from tritium light sources in the United Kingdom is growing at a CAGR of 3.4%, driven by expanding defense capabilities programs, increasing operational readiness requirements, and growing investment in tactical equipment modernization. The country's established defense infrastructure and emphasis on operational effectiveness are supporting demand for advanced tritium technologies across military and security markets. Defense agencies and equipment manufacturers are establishing comprehensive tritium programs to serve both national defense requirements and international cooperation obligations.
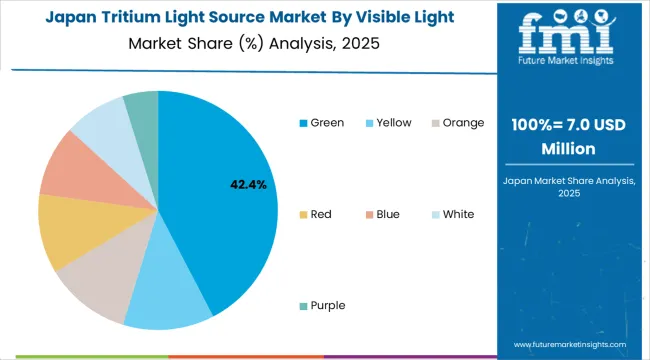
Revenue from tritium light sources in Japan is expanding at a CAGR of 3.2%, supported by the country's focus on precision manufacturing, advanced technology integration, and strategic investment in industrial and defense applications. Japan's established technology sector and emphasis on product quality are driving demand for specialized tritium technologies focusing on operational reliability and manufacturing precision. Industrial manufacturers are investing in comprehensive tritium integration to serve both domestic technology requirements and export market opportunities.
Revenue from tritium light sources in ASEAN countries is expanding at a CAGR of 5.2%, supported by regional infrastructure development programs, growing defense sector investment, and increasing emphasis on operational modernization. ASEAN's expanding industrial and defense markets and focus on capability development are driving demand for reliable tritium technologies across major metropolitan and strategic regions. Defense agencies and industrial operators are establishing service partnerships to serve both regional development requirements and operational effectiveness markets.
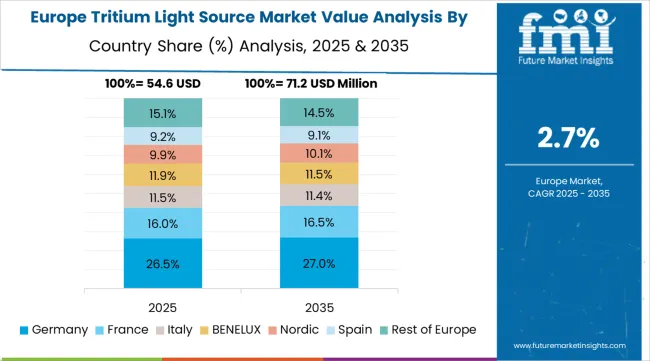
The tritium light source market in Europe is projected to grow from USD 45.1 million in 2025 to USD 60.8 million by 2035, registering a CAGR of 3.0% over the forecast period. Germany is expected to maintain its leadership position with a 28.5% market share in 2025, increasing to 29.1% by 2035, supported by its advanced manufacturing infrastructure, comprehensive industrial safety programs, and major defense contractors serving European and international markets.
United Kingdom follows with a 22.3% share in 2025, projected to reach 22.7% by 2035, driven by defense modernization programs, tactical equipment requirements, and established defense industry capabilities, supported by operational readiness initiatives and equipment modernization investments. France holds a 18.9% share in 2025, expected to maintain 18.6% by 2035, supported by defense industry requirements and industrial safety compliance but facing challenges from budget constraints and competitive pressures. Italy commands a 12.4% share in 2025, projected to reach 12.2% by 2035, while Spain accounts for 8.7% in 2025, expected to reach 8.9% by 2035. The Rest of Europe region, including Nordic countries, Eastern European markets, Netherlands, Belgium, and other European countries, is anticipated to maintain steady growth, with collective share from 9.2% to 8.5% by 2035, attributed to varying defense development programs and industrial safety initiatives across diverse European markets implementing modernization programs.
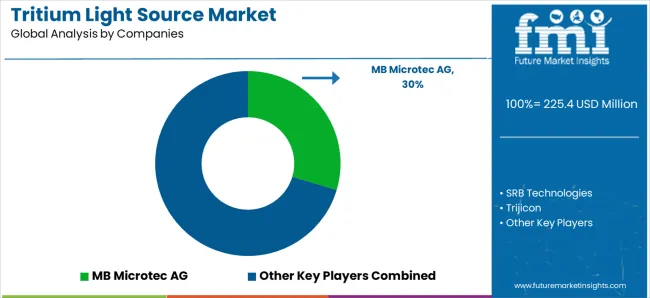
The tritium light source market features 10–15 players with moderate concentration, where the top three companies collectively hold around 42–48% of global market share. Growth is driven by increasing demand for tritium-powered illumination in industries such as defense, aerospace, automotive, and safety equipment, as well as rising regulatory standards for emergency exit signage and navigation systems. The leading company, MB Microtec AG, commands 30% of the market share, supported by its extensive portfolio of high-performance tritium light sources for military, industrial, and commercial applications. Competition centers on light intensity, durability, longevity, and safety standards rather than price alone.
Market leaders such as MB Microtec AG, SRB Technologies, and Trijicon maintain dominant positions by offering a range of tritium light sources that provide continuous, maintenance-free illumination for critical applications such as firearm sights, emergency exits, and navigational aids. Their strengths lie in advanced manufacturing capabilities, compliance with safety regulations, and strong customer relationships across various industrial sectors.
Challenger companies including Betalight B.V., Evenlite Inc., and Cammenga Company focus on specialized tritium-powered lighting systems for tactical, navigational, and safety applications, emphasizing high-quality standards and consistent performance.
Additional competition arises from ITTSAN GTLS, Trigalight, Sanyue Lighting Electrical Factory, and Shield Source Incorporated, which strengthen their market presence through cost-effective solutions, specialized designs, and regional manufacturing advantages.
| Items | Values |
|---|---|
| Quantitative Units (2025) | USD 225.4 million |
| Visible Light | Green, Yellow, Orange, Red, Blue, White, Purple |
| Application | Directional Markers and Navigation Aids, Aviation Markers, Warning Lights/Markers, Firearm Accessories |
| End Use Sector | Civil and Commercial, Industrial Infrastructure, Defense and Aerospace |
| Regions Covered | North America, Latin America, Western Europe, Eastern Europe, East Asia, South Asia, Middle East &Africa |
| Countries Covered | United States, Canada, Germany, United Kingdom, France, Japan, China, India, Brazil and 40+ countries |
| Key Companies Profiled | MB Microtec AG, SRB Technologies, Trijicon, Betalight B.V., Evenlite Inc., Cammenga Company, ITTSAN GTLS, Trigalight, Sanyue Lighting Electrical Factory, and Shield Source Incorporated |
| Additional Attributes | Product sales by visible light and application category, regional demand trends, competitive landscape, technological advancements in phosphor systems, manufacturing innovation, regulatory compliance development, and operational reliability optimization |
The global tritium light source market is estimated to be valued at USD 225.4 million in 2025.
The market size for the tritium light source market is projected to reach USD 308.9 million by 2035.
The tritium light source market is expected to grow at a 3.2% CAGR between 2025 and 2035.
The key product types in tritium light source market are green, yellow, orange, red, blue, white and purple.
In terms of application, firearm accessories segment to command 31.0% share in the tritium light source market in 2025.


Our Research Products

The "Full Research Suite" delivers actionable market intel, deep dives on markets or technologies, so clients act faster, cut risk, and unlock growth.

The Leaderboard benchmarks and ranks top vendors, classifying them as Established Leaders, Leading Challengers, or Disruptors & Challengers.

Locates where complements amplify value and substitutes erode it, forecasting net impact by horizon

We deliver granular, decision-grade intel: market sizing, 5-year forecasts, pricing, adoption, usage, revenue, and operational KPIs—plus competitor tracking, regulation, and value chains—across 60 countries broadly.

Spot the shifts before they hit your P&L. We track inflection points, adoption curves, pricing moves, and ecosystem plays to show where demand is heading, why it is changing, and what to do next across high-growth markets and disruptive tech

Real-time reads of user behavior. We track shifting priorities, perceptions of today’s and next-gen services, and provider experience, then pace how fast tech moves from trial to adoption, blending buyer, consumer, and channel inputs with social signals (#WhySwitch, #UX).

Partner with our analyst team to build a custom report designed around your business priorities. From analysing market trends to assessing competitors or crafting bespoke datasets, we tailor insights to your needs.
Supplier Intelligence
Discovery & Profiling
Capacity & Footprint
Performance & Risk
Compliance & Governance
Commercial Readiness
Who Supplies Whom
Scorecards & Shortlists
Playbooks & Docs
Category Intelligence
Definition & Scope
Demand & Use Cases
Cost Drivers
Market Structure
Supply Chain Map
Trade & Policy
Operating Norms
Deliverables
Buyer Intelligence
Account Basics
Spend & Scope
Procurement Model
Vendor Requirements
Terms & Policies
Entry Strategy
Pain Points & Triggers
Outputs
Pricing Analysis
Benchmarks
Trends
Should-Cost
Indexation
Landed Cost
Commercial Terms
Deliverables
Brand Analysis
Positioning & Value Prop
Share & Presence
Customer Evidence
Go-to-Market
Digital & Reputation
Compliance & Trust
KPIs & Gaps
Outputs
Full Research Suite comprises of:
Market outlook & trends analysis
Interviews & case studies
Strategic recommendations
Vendor profiles & capabilities analysis
5-year forecasts
8 regions and 60+ country-level data splits
Market segment data splits
12 months of continuous data updates
DELIVERED AS:
PDF EXCEL ONLINE
Analyzing Tritium Light Source Market Share & Applications
Extreme Ultraviolet Light Source Market Size and Share Forecast Outlook 2025 to 2035
Light Pipe Mould Market Size and Share Forecast Outlook 2025 to 2035
Lightning Surge Protector Market Size and Share Forecast Outlook 2025 to 2035
Light Therapy Market Forecast and Outlook 2025 to 2035
Light Rail Traction Converter Market Size and Share Forecast Outlook 2025 to 2035
Light Management System Market Size and Share Forecast Outlook 2025 to 2035
Lightweight Corrugator Modules Market Size and Share Forecast Outlook 2025 to 2035
Lightening and Whitening Creams Market Analysis - Size and Share Forecast Outlook 2025 to 2035
Lightweight Automotive Body Panels Market Size and Share Forecast Outlook 2025 to 2035
Lightening / Whitening Agents Market Size and Share Forecast Outlook 2025 to 2035
Light Control Switch Market Size and Share Forecast Outlook 2025 to 2035
Lightweight Handheld Cordless Vacuum Cleaner Market Size and Share Forecast Outlook 2025 to 2035
Light Setting Spray Market Size and Share Forecast Outlook 2025 to 2035
Light-Activated Anti-Pollution Skincare Market Analysis - Size and Share Forecast Outlook 2025 to 2035
Lighting As A Service Market Size and Share Forecast Outlook 2025 to 2035
Light Duty Truck Market Size and Share Forecast Outlook 2025 to 2035
Light Commercial Vehicle Market Size and Share Forecast Outlook 2025 to 2035
Light Emitting Diode (LED) Backlight Display Market Size and Share Forecast Outlook 2025 to 2035
Light Control Switches Market Size and Share Forecast Outlook 2025 to 2035

Thank you!
You will receive an email from our Business Development Manager. Please be sure to check your SPAM/JUNK folder too.
Chat With
MaRIA