

- Market Size (2026)
- USD 50.0 Mn
- Forecast (2036)
- USD 200.5 Mn
- CAGR (2026 to 2036)
- 14.9%
How big is the Ultrasound-on-Chip Licensing Market?
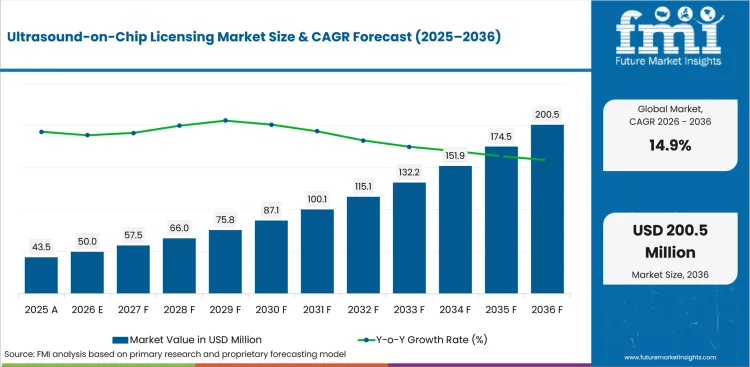
The Ultrasound-on-Chip Licensing Market is projected to grow from USD 50.0 million in 2026 to USD 200.5 million by 2036, at a CAGR of 14.9%.
The Ultrasound-on-Chip Licensing Market was valued at USD 43.5 million in 2025 and is expected to reach USD 50.0 million in 2026. The market is projected to reach USD 200.5 million by 2036 at a CAGR of 14.9%. Butterfly Embedded is estimated to account for a 61.0% share of the Technology Provider segment in 2026. Medical is projected to represent a 72.0% share of the Application Area segment in 2026.
In January 2024, Canon Medical and Olympus announced a business alliance for endoscopic ultrasound systems. The move shows how ultrasound expertise can be split between system development and market access. In April 2024, Exo launched FDA-cleared AI on Exo Iris for heart failure workflows. The development supports the case for chip-based portable ultrasound plus AI guidance.
Butterfly Network says Butterfly Embedded allows partners to license its Ultrasound-on-Chip technology for medical devices, industrial inspection tools, and other ultrasound-enabled products.
| Metric | Value |
|---|---|
| 2025 Market Size | USD 43.5 million |
| 2026 Market Size | USD 50.0 million |
| 2036 Market Size | USD 200.5 million |
| Forecast CAGR (2026-2036) | 14.9% |
| Leading Technology Provider | Butterfly Embedded |
| Butterfly Embedded Share (2026) | 61.0% |
| Leading Application Area | Medical |
| Medical Share (2026) | 72.0% |
| Fastest-growing Country | China |
| China CAGR by 2036 | 16.8% |
Summary of the Ultrasound-on-Chip Licensing Market
| Market Signal | Commercial Impact |
|---|---|
| Demand and Growth Drivers | Demand for ultrasound-on-chip licensing is increasing as OEMs seek compact imaging platforms that accelerate product development while reducing hardware complexity.
|
| Product and Segment View | Butterfly Embedded, medical applications, and device OEMs continue to represent the leading commercial opportunities across the market.
|
| Geography and Growth Outlook | North America and Asia continue to drive market expansion through medical imaging innovation, AI adoption, and embedded ultrasound technology development.
|
| Competitive Landscape | Competition increasingly focuses on intellectual property, semiconductor integration, software ecosystems, and long-term technology partnerships.
|
| Analyst Perspective | Ultrasound-on-chip licensing is evolving from a hardware sourcing decision into a strategic technology partnership where semiconductor integration, software access, and regulatory support determine long-term commercial success.
- Anurag Sharma, Principal Consultant at Future Market Insights |
Why is the Ultrasound-on-Chip Licensing Market growing?
OEMs want smaller ultrasound modules that can be integrated into devices without building a transducer platform from scratch. Medical AI workflows need ultrasound data access at the chip and software layer for automated capture and guidance.
- OEMs want smaller ultrasound modules that can be integrated into devices without building a transducer platform from scratch.
- Medical AI workflows need ultrasound data access at the chip and software layer for automated capture and guidance.
- Semiconductor integration lowers hardware complexity by replacing probe libraries with software-controlled imaging modes.
Medical OEMs are moving first since their product teams already understand imaging performance, regulatory files, and clinician workflow. The FDA describes ultrasound as a medical tool used to evaluate, diagnose, and treat conditions, and notes its non-ionizing nature compared with X-ray systems. This clinical familiarity makes ultrasound-on-chip easier to position inside regulated products than many newer sensing technologies. The practical result is that licensors can sell more than IP access. They can sell a validated path from chip behavior to clinical image output. Licensing is also gaining weight as ultrasound becomes software-defined. Butterfly says its Ultrasound-on-Chip technology integrates thousands of transducer elements onto circuits at wafer level and uses a CMUT design in a handheld probe.
How is the Ultrasound-on-Chip Licensing Market segmented?
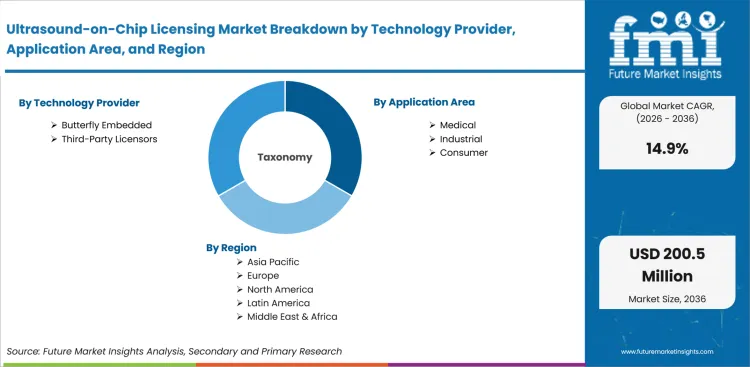
The Ultrasound-on-Chip Licensing Market is segmented by technology provider, application area, licensing model, end user, and region.
- Butterfly Embedded is estimated to account for a 61.0% share of Technology Provider demand in 2026 as it offers direct licensing for proprietary Ultrasound-on-Chip technology.
- With an estimated 72.0% share in 2026, Medical is expected to lead the application area category because clearer clinical use cases.
- Device OEMs are projected to represent 54.0% of End User demand in 2026 with product teams controlling integration budgets.
How does Butterfly Embedded contribute to the technology provider category?
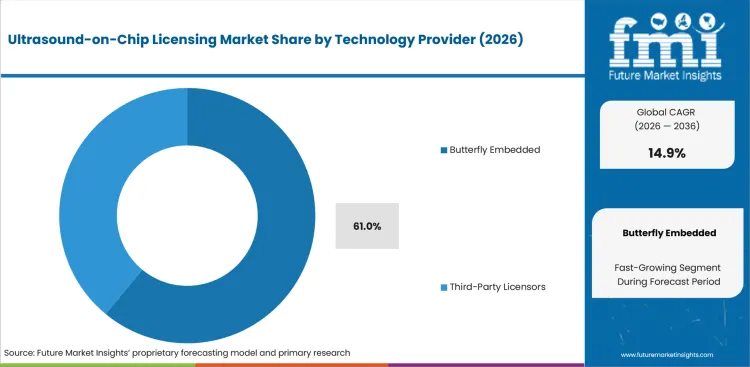
- Butterfly Embedded is projected to account for a 61.0% share in 2026 as its platform combines CMUT chip IP, software tools, and public licensing evidence from paid partner programs.
- Third-party licensors compete where buyers need custom semiconductor design or local integration support, but public evidence for direct ultrasound-on-chip licensing remains thinner than Butterfly’s disclosed program.
What supports demand for Medical?
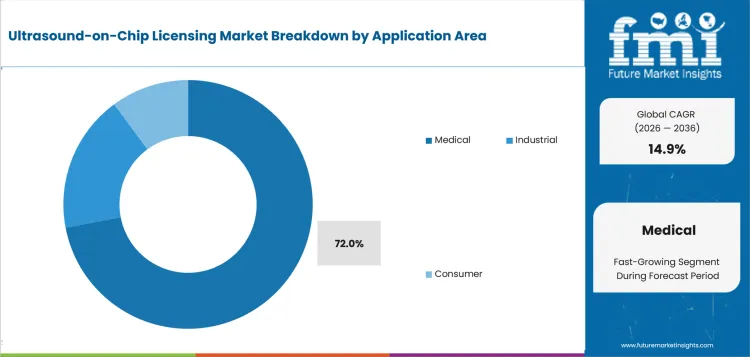
- Medical is estimated to represent a 72.0% share in 2026 as clinical ultrasound offers clearer validation paths, known safety expectations, and defined buyer budgets.
- Industrial and consumer uses face longer conversion cycles since non-clinical buyers must prove that embedded ultrasound data improves inspection, sensing, or user-facing product value.
How do buyers evaluate Co-Development within the licensing model category?
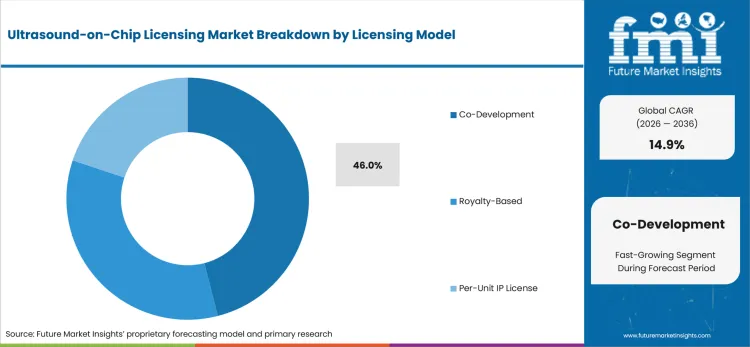
- Co-Development is anticipated to account for a 46.0% share in 2026 as partners need shared engineering, chip access, and software support before launch.
- Royalty-based models become stronger after commercial launch since licensors can price chip purchases, software access, and field-of-use rights across product life cycles.
What market factors influence demand for Device OEMs?
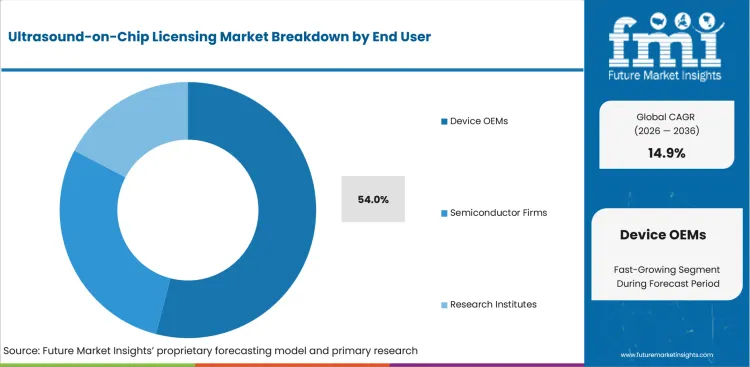
- Device OEMs are expected to represent a 54.0% share in 2026 as they own product architecture, compliance files, and end-market branding.
- Semiconductor firms enter licensing talks when chip packaging, wafer-level design, or signal processing becomes the main barrier to finished product delivery.
How does North America affect the regional outlook?
- North America is projected to account for a 42.0% share in 2026 as USA public filings provide the clearest evidence for paid chip licensing.
- Europe and East Asia expand through OEM evaluation programs, while Middle East demand remains more buyer-led than supply-led in available public sources.
What drives and restrains the market?
Driver: Chip-based probe design allows broader imaging modes from fewer hardware parts, which supports partner interest in compact devices; restraint: Regulatory evidence gaps slow non-medical programs since buyers must prove performance without established reimbursement pathways; opportunity: industrial inspection could open new revenue once ruggedized modules prove repeatability in field environments.
The market reflects a balance between the identified demand driver, adoption constraints, and the supplier opportunity outlined below.
- Driver: Chip-based probe design allows broader imaging modes from fewer hardware parts, which supports partner interest in compact devices.
- Restraint: Regulatory evidence gaps slow non-medical programs since buyers must prove performance without established reimbursement pathways.
- Opportunity: industrial inspection could open new revenue once ruggedized modules prove repeatability in field environments.
Chip Access Reduces Build Risk: Licensing grows when OEMs decide that building ultrasound hardware internally takes too much time and capital. Butterfly’s SEC filing for the Midjourney agreement disclosed a one-time USD 15 million fee and a USD 10 million annual license fee. That public structure shows how licensors can monetize access before hardware revenue begins. It also shows why buyers compare license cost with the cost of building chips, transducers, and imaging software internally. This makes co-development the most practical early contract type.
AI Workflows Raise: Software Value: AI changes what buyers expect from ultrasound-on-chip licensing. GE HealthCare agreed in July 2024 to acquire Intelligent Ultrasound’s clinical AI software business for about USD 51 million, aiming to add real-time image recognition into ultrasound devices. This does not make GE a chip licensor, but it shows how ultrasound value is shifting toward acquisition guidance and workflow software. Licensors with APIs and developer support can price those layers separately from chip supply. Regulatory Evidence Slows Expansion: The main restraint is not interest in the technology. The harder issue is proving safety, performance, and workflow value across new product categories.
Which factors support expansion?
Commercial expansion is reinforced by the value, workflow, and recurring-demand factors below.
- Licensing value is rising as OEMs treat chip-based ultrasound as a platform input instead of a finished handheld device.
- Software access changes contract economics since APIs and imaging modes can be licensed apart from physical chip supply.
- Medical buyers carry the first revenue wave as FDA-cleared ultrasound experience lowers perceived risk for partner programs.
Which country markets are included in the CAGR comparison?
The selected CAGR comparison covers China (16.8%), India (16.4%), South Korea (15.6%), United States (15.4%), and Japan (14.1%) through 2036.
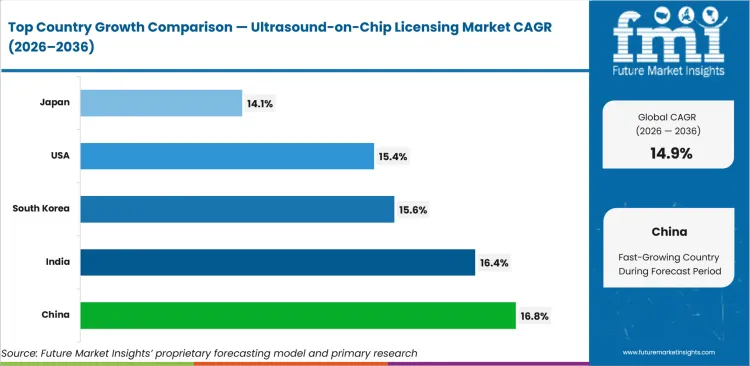
| Country | CAGR |
|---|---|
| China | 16.8% |
| India | 16.4% |
| South Korea | 15.6% |
| United States | 15.4% |
| Japan | 14.1% |
Source: Future Market Insights analysis.
How do country-level CAGRs compare?
- China (CAGR: 16.8%): China combines local medical device scale with rising interest in AI-enabled diagnosis.
- India (CAGR: 16.4%): India needs affordable imaging access across urban hospitals and smaller care settings.
- South Korea (CAGR: 15.6%): South Korea has a strong ultrasound OEM through Samsung Medison.
- United States (CAGR: 15.4%): FDA-cleared handheld ultrasound and AI-enabled device activity supports early buyer confidence.
- Japan (CAGR: 14.1%): Japan’s diagnostic imaging culture supports high-performance ultrasound evaluation.
The global Ultrasound-on-Chip Licensing Market is forecast to record a CAGR of 14.9% from 2026 to 2036. The study covers 30+ countries across the report regions.
How is the Ultrasound-on-Chip Licensing Market developing in China?
China is projected to record a CAGR of 16.8% through 2036. The country outlook identifies this demand signal: China combines local medical device scale with rising interest in AI-enabled diagnosis.
Country Market Snapshot
| Country | China |
|---|---|
| Forecast CAGR | 16.8% |
| Demand anchor | China combines local medical device scale with rising interest in AI-enabled diagnosis. |
| Procurement route | NMPA registration and provincial hospital buying influence device access. |
| Policy context | NMPA signaled stronger registration guidance for AI-powered products in 2025. |
| Supply structure | Mindray and United Imaging shape local medical imaging competition. |
| Restraint | Domestic substitution pressure can limit foreign IP pricing power. |
| Primary demand signal | China combines local medical device scale with rising interest in AI-enabled diagnosis. |
| Company context | Companies active in or serving this market include Mindray, SonoScape, Wisonic, Butterfly Network, and Exo. |
Market Outlook
China demand is shaped by localization goals and strong device manufacturing capability. NMPA said in October 2025 that it would strengthen registration guidance for AI-powered and biomaterial-based products. That gives medical device developers clearer expectations for AI-heavy product categories. Ultrasound-on-chip licensors can benefit if they help local OEMs reduce development risk and speed design cycles. China is expected to record a CAGR of 16.8% through 2036 as local device makers seek differentiated imaging hardware.
Key Growth Drivers
- NMPA attention to AI-powered products supports clearer review expectations for smart devices.
- Local OEM scale creates demand for reusable chip platforms across product lines.
- Hospital modernization supports compact ultrasound tools for specialist and point-of-care use.
- China combines local medical device scale with rising interest in AI-enabled diagnosis.
Key Restraints
- Domestic IP preference can pressure royalty rates and contract terms.
- Data and software localization requirements can complicate cloud-based imaging tools.
- Domestic substitution pressure can limit foreign IP pricing power.
Country Market FAQs
What should C-suite teams prioritize in China?
C-suite teams should prioritize qualification requirements, procurement routes, local service coverage, and implementation economics before committing capital or supplier volume.
How should suppliers approach the China market?
Suppliers should align technical evidence, local channel support, and account-specific commercial terms with the buying process used by major customers in China.
What can weaken the business case in China?
Domestic substitution pressure can limit foreign IP pricing power. Executives should test this exposure during supplier, investment, and rollout reviews.
How is the Ultrasound-on-Chip Licensing Market developing in India?
India is projected to record a CAGR of 16.4% through 2036. The country outlook identifies this demand signal: India needs affordable imaging access across urban hospitals and smaller care settings.
Country Market Snapshot
| Country | India |
|---|---|
| Forecast CAGR | 16.4% |
| Demand anchor | India needs affordable imaging access across urban hospitals and smaller care settings. |
| Procurement route | CDSCO import and manufacturing licenses shape device entry. |
| Local proof | CDSCO uses MD-14 and MD-15 routes for medical device import licensing. |
| Supply structure | Multinational ultrasound vendors serve India through sales and distributor networks. |
| Restraint | Price sensitivity can limit premium royalty structures for licensed platforms. |
| Primary demand signal | India needs affordable imaging access across urban hospitals and smaller care settings. |
| Company context | Companies active in or serving this market include GE HealthCare India, Philips India, Siemens Healthineers India, Mindray India, and Butterfly Network. |
Market Outlook
India demand is shaped by access gaps and cost discipline. CDSCO states that applicants use MD-14 for import license applications and receive MD-15 to import medical devices. This creates a defined pathway for foreign device suppliers, but it also places documentation responsibility on local agents and importers. Ultrasound-on-chip licensors can gain if they help OEMs build lower-cost systems with fewer probes and easier training.
Key Growth Drivers
- CDSCO’s defined import pathway gives foreign OEMs a route for regulated device entry.
- Hospital networks need portable imaging for emergency, maternal health, and critical care use.
- Medical device policy support encourages local design and manufacturing partnerships.
- India needs affordable imaging access across urban hospitals and smaller care settings.
Key Restraints
- Price-sensitive hospitals may resist high royalty fees in entry-level imaging products.
- Service coverage outside metro cities can slow adoption of advanced ultrasound platforms.
- Price sensitivity can limit premium royalty structures for licensed platforms.
Country Market FAQs
What should C-suite teams prioritize in India?
C-suite teams should prioritize qualification requirements, procurement routes, local service coverage, and implementation economics before committing capital or supplier volume.
How should suppliers approach the India market?
Suppliers should align technical evidence, local channel support, and account-specific commercial terms with the buying process used by major customers in India.
What can weaken the business case in India?
Price sensitivity can limit premium royalty structures for licensed platforms. Executives should test this exposure during supplier, investment, and rollout reviews.
How is the Ultrasound-on-Chip Licensing Market developing in South Korea?
South Korea is projected to record a CAGR of 15.6% through 2036. The country outlook identifies this demand signal: South Korea has a strong ultrasound OEM through Samsung Medison.
Country Market Snapshot
| Country | South Korea |
|---|---|
| Forecast CAGR | 15.6% |
| Demand anchor | South Korea has a strong ultrasound OEM through Samsung Medison. |
| Procurement route | MFDS review and hospital purchasing guide clinical device uptake. |
| Local proof | Samsung Medison acquired Sonio to strengthen AI-enhanced ultrasound workflows. |
| Supply structure | Samsung’s semiconductor group gives the country broader chip ecosystem depth. |
| Restraint | Direct licensing evidence for third-party ultrasound-on-chip IP is limited. |
| Primary demand signal | South Korea has a strong ultrasound OEM through Samsung Medison. |
| Company context | Companies active in or serving this market include Samsung Medison, Healcerion, GE HealthCare, Siemens Healthineers, and Butterfly Network. |
Market Outlook
South Korea demand is shaped by ultrasound system know-how and semiconductor depth. Samsung said the Sonio acquisition would combine AI expertise with Samsung Medison’s ultrasound systems to support AI-enhanced workflows. That makes South Korea relevant to licensing discussions around chip access and workflow software. The buyer focus is less about basic ultrasound demand and more about whether embedded imaging can add measurable workflow value. South Korea is projected to record 15.6% CAGR through 2036 as medical devices and semiconductors converge.
Key Growth Drivers
- Samsung Medison provides a local ultrasound OEM anchor with global brand access.
- Semiconductor capability supports advanced packaging and system integration discussions.
- AI workflow investment supports demand for ultrasound data access and automation.
- South Korea has a strong ultrasound OEM through Samsung Medison.
Key Restraints
- Local OEMs may prefer internal development over third-party IP licenses.
- Hospital adoption depends on clinical evidence and service reliability.
- Direct licensing evidence for third-party ultrasound-on-chip IP is limited.
Country Market FAQs
What should C-suite teams prioritize in South Korea?
C-suite teams should prioritize qualification requirements, procurement routes, local service coverage, and implementation economics before committing capital or supplier volume.
How should suppliers approach the South Korea market?
Suppliers should align technical evidence, local channel support, and account-specific commercial terms with the buying process used by major customers in South Korea.
What can weaken the business case in South Korea?
Direct licensing evidence for third-party ultrasound-on-chip IP is limited. Executives should test this exposure during supplier, investment, and rollout reviews.
How is the Ultrasound-on-Chip Licensing Market developing in the United States?
The United States is projected to record a CAGR of 15.4% through 2036. The country outlook identifies this demand signal: FDA-cleared handheld ultrasound and AI-enabled device activity supports early buyer confidence.
Country Market Snapshot
| Country | United States |
|---|---|
| Forecast CAGR | 15.4% |
| Demand anchor | FDA-cleared handheld ultrasound and AI-enabled device activity supports early buyer confidence. |
| Procurement route | Enterprise health systems evaluate POCUS platforms through clinical workflow and compliance teams. |
| Channel signal | USA revenue at Butterfly reached USD 21.4 million in Q1 2026. |
| Supply structure | Butterfly Network and Exo both show USA chip-based handheld ultrasound activity. |
| Restraint | Reimbursement clarity and clinical validation remain critical for new embedded use cases. |
| Primary demand signal | FDA-cleared handheld ultrasound and AI-enabled device activity supports early buyer confidence. |
| Company context | Companies active in or serving this market include Butterfly Network, Exo, GE HealthCare, Siemens Healthineers, and Philips. |
Market Outlook
United States demand is shaped by product teams that expect strong regulatory support and repeatable clinical evidence. Butterfly reported that USA revenue rose in Q1 2026, mainly helped by Butterfly Embedded partnerships and the Midjourney co-development program. This makes the United States the first reference market for chip IP monetization. Buyers treat licensing as a way to compress development time, but they expect proof that the platform can support clinical-grade images.
Key Growth Drivers
- USA FDA clearance pathways give OEMs clearer premarket expectations for ultrasound-enabled devices.
- Enterprise POCUS procurement creates demand for platforms that integrate imaging with hospital IT workflows.
- Semiconductor and AI investor ecosystems support co-development talks for new imaging form factors.
- FDA-cleared handheld ultrasound and AI-enabled device activity supports early buyer confidence.
Key Restraints
- Clinical validation cost can slow partner conversion from evaluation to paid license.
- Field-of-use restrictions may limit product flexibility for multi-application OEMs.
- Reimbursement clarity and clinical validation remain critical for new embedded use cases.
Country Market FAQs
What should C-suite teams prioritize in the United States?
C-suite teams should prioritize qualification requirements, procurement routes, local service coverage, and implementation economics before committing capital or supplier volume.
How should suppliers approach the United States market?
Suppliers should align technical evidence, local channel support, and account-specific commercial terms with the buying process used by major customers in the United States.
What can weaken the business case in the United States?
Reimbursement clarity and clinical validation remain critical for new embedded use cases. Executives should test this exposure during supplier, investment, and rollout reviews.
How is the Ultrasound-on-Chip Licensing Market developing in Japan?
Japan is projected to record a CAGR of 14.1% through 2036. The country outlook identifies this demand signal: Japan’s diagnostic imaging culture supports high-performance ultrasound evaluation.
Country Market Snapshot
| Country | Japan |
|---|---|
| Forecast CAGR | 14.1% |
| Demand anchor | Japan’s diagnostic imaging culture supports high-performance ultrasound evaluation. |
| Procurement route | PMDA review and hospital purchasing shape device entry. |
| Local proof | Canon Medical and Olympus announced an endoscopic ultrasound alliance in January 2024. |
| Supply structure | Canon Medical brings long ultrasound experience and global imaging reach. |
| Restraint | PMDA review expectations can lengthen entry for novel licensed chip platforms. |
| Primary demand signal | Japan’s diagnostic imaging culture supports high-performance ultrasound evaluation. |
| Company context | Companies active in or serving this market include Canon Medical Systems, Fujifilm Healthcare, Konica Minolta, Sony Semiconductor Solutions, and Butterfly Network. |
Market Outlook
Japan demand is driven by precision imaging expectations and long product qualification cycles. Canon Medical and Olympus announced a January 2024 alliance for endoscopic ultrasound systems, with Canon developing diagnostic ultrasound systems and Olympus handling sales and marketing. This shows how Japanese companies use role-sharing partnerships to improve ultrasound product reach. Japan is projected to grow at a CAGR of 14.1% through 2036 because its device makers value miniaturization and high image quality.
Key Growth Drivers
- Canon Medical provides a domestic imaging anchor with ultrasound system expertise.
- Japanese OEMs use partnerships to combine device manufacturing and sales specialization.
- PMDA review discipline supports premium positioning for well-documented licensed platforms.
- Japan’s diagnostic imaging culture supports high-performance ultrasound evaluation.
Key Restraints
- Longer approval expectations can slow first revenue for novel embedded ultrasound systems.
- Conservative hospital buying behavior favors proven imaging suppliers.
- PMDA review expectations can lengthen entry for novel licensed chip platforms.
Country Market FAQs
What should C-suite teams prioritize in Japan?
C-suite teams should prioritize qualification requirements, procurement routes, local service coverage, and implementation economics before committing capital or supplier volume.
How should suppliers approach the Japan market?
Suppliers should align technical evidence, local channel support, and account-specific commercial terms with the buying process used by major customers in Japan.
What can weaken the business case in Japan?
PMDA review expectations can lengthen entry for novel licensed chip platforms. Executives should test this exposure during supplier, investment, and rollout reviews.
Which companies are discussed in the Ultrasound-on-Chip Licensing Market?
The preview discusses Butterfly Network, Exo, GE HealthCare, Siemens Healthineers, and Samsung Medison among the companies active in this market.
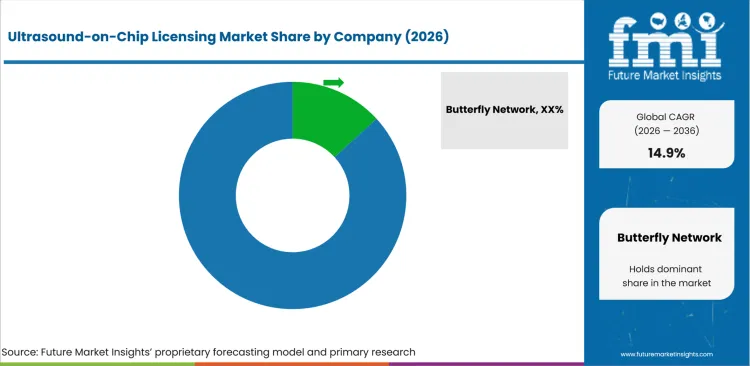
The market is concentrated around Butterfly Network for direct ultrasound-on-chip licensing evidence. Smaller competitors win through pMUT design, AI workflow tools, or application-specific integration. Large imaging OEMs influence buyer expectations through ultrasound AI acquisitions and platform upgrades.
Entry barriers include transducer IP, image processing depth, regulatory support, and partner engineering capacity. Semiconductor firms compete indirectly when packaging, signal chain, and compute design affect product viability. Competitive behavior is shaped by control over the full ultrasound stack.
How is competition structured?
Competition reflects differences in specialization, portfolio scope, geographic reach, evidence, and customer access.
The market is best understood by company role, not by size alone.
- Direct IP Licensors: Butterfly Network is the clearest direct licensor through Butterfly Embedded, which covers licensing and co-development for Ultrasound-on-Chip technology. The company combines CMUT-based chip architecture, software tools, developer access, and public licensing evidence.
- Chip-Based Ultrasound Platform Firms: Exo is relevant as a chip-based handheld ultrasound platform using pMUT technology and AI-enabled workflows. The company supports the broader technology case for compact ultrasound devices.
- Imaging OEM and Software Ecosystem Firms: GE HealthCare, Siemens Healthineers, Samsung Medison, Philips, Canon Medical, and Olympus shape buyer expectations through AI-enabled ultrasound systems and imaging partnerships.
How do selected companies compare?
The selected companies differ in portfolio focus, geographic reach, evidence depth, and channel strength.
| Company | Competitive position |
|---|---|
| Butterfly Network | Butterfly Network is assessed for chip-platform relevance, partnership potential, intellectual-property position, and access to medical-device channels. |
| Exo | Exo is assessed for chip-platform relevance, partnership potential, intellectual-property position, and access to medical-device channels. |
| GE HealthCare | GE HealthCare is assessed for chip-platform relevance, partnership potential, intellectual-property position, and access to medical-device channels. |
| Siemens Healthineers | Siemens Healthineers is assessed for chip-platform relevance, partnership potential, intellectual-property position, and access to medical-device channels. |
| Samsung Medison | Samsung Medison is assessed for chip-platform relevance, partnership potential, intellectual-property position, and access to medical-device channels. |
What are the key developments in the Ultrasound-on-Chip Licensing Market?
- In October 2023, Butterfly Network announced a five-year co-development agreement with Forest Neurotech that included licensing, chip purchases, services, and development milestones. The agreement directly demonstrated a commercial licensing model for Ultrasound-on-Chip technology.
- In November 2025, Butterfly Network disclosed a co-development partnership with Midjourney under a multi-year agreement. The transaction expanded the commercial scope of the Butterfly Embedded platform.
- In February 2026, Butterfly Network reported that the Midjourney partnership contributed USD 6.8 million in fourth-quarter revenue. The disclosure provided direct evidence of licensing commercialization.
Selected Companies in the Ultrasound-on-Chip Licensing Market
Companies referenced in this preview
- Butterfly Network.
- Exo.
- GE HealthCare.
- Siemens Healthineers.
- Samsung Medison.
- Philips.
- Canon Medical Systems.
- Fujifilm Healthcare.
Market Scope & Definition
| Metric | Value |
|---|---|
| Market definition | The Ultrasound-on-Chip Licensing Market covers paid access to semiconductor-based ultrasound IP, developer tools, chip supply rights, and co-development services. Included systems use CMUT or similar microfabricated transducer architectures integrated with software-controlled imaging workflows. |
| Functions covered | Butterfly Embedded, Third-Party Licensors |
| Applications covered | Medical, Industrial, Consumer |
| End-use industries | Device OEMs, Semiconductor Firms, Research Institutes |
| Inclusions | Market scope covers Butterfly Embedded and third-party licensors, medical and industrial application programs, co-development contracts, royalty-based agreements, per-unit IP licenses, device OEMs, semiconductor firms, research institutes, and the selected country coverage for 2026 to 2036. |
| Exclusions | The market excludes conventional cart-based ultrasound sales, standard piezoelectric probe sales, general medical imaging services, unrelated semiconductor IP, and software-only radiology tools without ultrasound-on-chip integration rights. |
Research Methodology
| Metric | Value |
|---|---|
| Primary Research | FMI analysts reviewed buying behavior across device OEMs, semiconductor design teams, ultrasound platform developers, and digital health product groups. Interviews focused on license structure, validation needs, integration pain points, and partner support expectations. |
| Desk Research | reviewed regulatory pages, FDA ultrasound guidance, medical device clearance records, company filings, and official product information. It also examined adjacent areas such as ultrasound demand and healthcare semiconductors to define boundary conditions. |
| Market Sizing and Forecasting | The model combined known license revenue, partner count, expected contract value, application mix, and country-level commercialization conditions. Forecast assumptions were checked against medical device adoption cycles and semiconductor IP pricing behavior. |
| Data Validation | Forecasts were cross-checked against public company filings, regulatory activity, and adjacent imaging technology demand. Segment shares are FMI estimates and are used to explain expected market structure in 2026. |
What does the report cover?
The report covers technology provider, application area, licensing model, end user, and region across the 2026-2036 forecast period in 30+ countries.
| Metric | Value |
|---|---|
| Periods | Base year 2025; estimated year 2026; forecast period 2026-2036 |
| Segment axes | technology provider, application area, licensing model, end user, and region |
| Regions | North America, Europe, East Asia, Middle East, and Rest of World |
| Countries | United States, United Kingdom, Germany, France, Japan, China, South Korea, India and 30+ countries |
| Companies | Butterfly Network, Exo, GE HealthCare, Siemens Healthineers, Samsung Medison, Philips, Canon Medical Systems, Fujifilm Healthcare, and others |
| Approach | Hybrid bottom-up and top-down methodology using public contract signals, segment use rates, and country-level adoption readiness. |
Market Segmentation Analysis
Segmented by Technology Provider
- Butterfly Embedded.
- Third-Party Licensors.
Segmented by Application Area
- Medical.
- Industrial.
- Consumer.
Segmented by Licensing Model
- Co-Development.
- Royalty-Based.
- Per-Unit IP License.
Segmented by End User
- Device OEMs.
- Semiconductor Firms.
- Research Institutes.
By Region
- North America.
- United States.
- Canada.
- Europe.
- Germany.
- United Kingdom.
- France.
- Western Europe.
- South Asia and Pacific.
- India.
- China.
- East Asia.
- Japan.
- South Korea.
- Middle East.
- UAE.
- Saudi Arabia.
- Rest of World.
Research Sources and Bibliography
- Butterfly Network. (2023, October 24). Butterfly Network announces five-year co-development agreement with Forest Neurotech. Butterfly Network.
- Butterfly Network. (2025, November). Butterfly Network discloses Midjourney co-development partnership. Butterfly Network Investor Relations.
- Butterfly Network. (2026, February 26). Butterfly Network reports fourth-quarter 2025 financial results. Butterfly Network Investor Relations.
- USA Food and Drug Administration. (2026, June). Artificial intelligence-enabled medical devices. https://www.fda.gov/medical-devices/software-medical-device-samd/artificial-intelligence-enabled-medical-devices
- USA Food and Drug Administration. (2024, September 19). Ultrasound imaging. https://www.fda.gov/radiation-emitting-products/medical-imaging/ultrasound-imaging
- NHS England. (2024, September 26). Diagnostic imaging dataset statistical release. https://www.england.nhs.uk/statistics/wp-content/uploads/sites/2/2024/09/Statistical-Release-26th-September-2024-1.pdf
- GE HealthCare. (2024, July 18). GE HealthCare announces agreement to acquire clinical artificial intelligence business from Intelligent Ultrasound. https://www.gehealthcare.com/en-us/about/newsroom/press-releases/ge-healthcare-announces-agreement-to-acquire-clinical-artificial-intelligence-business-from-intelligent-ultrasound
- Exo. (2024, April 23). Exo launches FDA-cleared AI on Exo Iris to address heart failure. https://www.exo.inc/article/exo-launches-fda-cleared-ai-on-exo-iris-to-address-heart-failure
- Samsung Newsroom. (2024, May 8). Samsung announces acquisition of Sonio to strengthen its leading position in cutting-edge medical devices. https://news.samsung.com/global/samsung-announces-acquisition-of-sonio-to-strengthen-its-leading-position-in-cutting-edge-medical-devices
- Siemens Healthineers. (2024, December 1). Siemens Healthineers collaborates with RadNet’s DeepHealth to create AI-powered SmartTechnology. https://www.siemens-healthineers.com/en-us/press-room/press-releases/ultrasound-radnet-deephealth-collaboration
- Olympus. (2024, January 15). Canon Medical Systems and Olympus announce business alliance regarding endoscopic ultrasound systems. https://www.olympus-global.com/news/2024/nr02606.html
- Philips. (2025, June 17). Philips breaks new ground in point-of-care ultrasound with launch of Flash 5100 POC. https://www.philips.com/a-w/about/news/archive/standard/news/articles/2025/philips-breaks-new-ground-in-point-of-care-ultrasound-with-launch-of-flash-5100-poc.html
The bibliography is provided for reader reference and uses official company, regulatory, government, or institutional publications.
This Report Answers
- What is the projected value of the Ultrasound-on-Chip Licensing Market in 2026?
- What value is forecast for the Ultrasound-on-Chip Licensing Market by 2036?
- What CAGR is forecast for the Ultrasound-on-Chip Licensing Market from 2026 to 2036?
- What 2026 share is projected for Butterfly Embedded within the technology provider category?
- What 2026 share is projected for Medical within the application area category?
- Which demand factors support the Ultrasound-on-Chip Licensing Market outlook?
- Which restraints and opportunities affect adoption in the Ultrasound-on-Chip Licensing Market?
- How are country CAGR outlooks, including China at 16.8%, compared?
- Which companies and product developments are covered in the competitive analysis?
- What is included in the market scope, and how is the forecast validated?
Frequently Asked Questions
Why should executives track the Ultrasound-on-Chip Licensing Market?
Executives should track this market because it can affect capital allocation, supplier strategy, operating risk, and competitive positioning across commercial planning cycles.
What business problem does the Ultrasound-on-Chip Licensing Market address?
It helps executive teams judge where customer pain, supplier capability, compliance exposure, and implementation economics justify investment, procurement, or portfolio action.
What should procurement leaders evaluate before selecting suppliers?
Procurement leaders should assess evidence quality, integration fit, service coverage, compliance readiness, total cost of ownership, and supplier execution capability.
What can limit return on investment for buyers?
Return on investment can be limited by low utilization, integration delays, training gaps, unclear ownership, pricing pressure, or weak fit with existing workflows.
How can suppliers build executive confidence?
Suppliers can build confidence by proving implementation speed, risk reduction, support depth, reference use cases, and measurable outcomes for budget owners.
Preview the report firsthand - request a free sample
Get SampleGet the brochure for pricing and purchase details.
Get PDFTable of Content
- Key Takeaways
- Market Size and CAGR
- Top Growth Driver
- Fastest Growing Segment
- Leading Region
- Key Companies
- Emerging Opportunities
- Executive Summary
- Global Market Outlook
- Demand-side Trends
- Supply-side Trends
- Technology Roadmap Analysis
- Analysis and Recommendations
- Analyst Perspective (What is happening? Why now? What should investors know?)
- Key Questions Answered
- How large is the market?
- What is the CAGR?
- What are key trends?
- Which region dominates?
- Who are the leaders?
- Market Overview
- Market Coverage / Taxonomy
- Market Definition / Scope / Limitations
- Research Methodology
- Chapter Orientation
- Analytical Lens and Working Hypotheses
- Market Structure, Signals, and Trend Drivers
- Benchmarking and Cross-market Comparability
- Market Sizing, Forecasting, and Opportunity Mapping
- Research Design and Evidence Framework
- Desk Research Programme (Secondary Evidence)
- Expert Input and Fieldwork (Primary Evidence)
- Tooling, Models, and Reference Databases
- Data Engineering and Model Build
- Quality Assurance and Audit Trail
- Market Background
- Market Dynamics (Drivers, Restraints, Opportunity, Trends)
- Scenario Forecast (Optimistic, Likely, Conservative)
- Impact Analysis
- AI Impact
- Sustainability Impact
- Regulatory Impact
- Technology Impact
- Consumer / Buyer Analysis
- Purchase Drivers
- Adoption Barriers
- Buyer Journey
- Opportunity Map Analysis
- Product Life Cycle Analysis
- Supply Chain Analysis
- Investment Feasibility Matrix
- Value Chain Analysis
- PESTLE and Porter's Analysis
- Regulatory Landscape
- Regional Parent Market Outlook
- Production and Consumption Statistics
- Import and Export Statistics
- Global Market Analysis and Forecast, 2021 to 2036
- Historical Market Size Value (USD Million) & Volume (Unit) Analysis, 2021 to 2025
- Current and Future Market Size Value (USD Million) & Volume (Unit) Projections, 2026 to 2036
- Y-o-Y Growth Trend Analysis
- Absolute $ Opportunity Analysis
- Global Market Pricing Analysis, 2021 to 2036
- Global Market Analysis and Forecast, By Technology Provider, 2021 to 2036
- Introduction / Key Findings
- Historical Market Size Value (USD Million) & Volume (Unit) Analysis By Technology Provider, 2021 to 2025
- Current and Future Market Size Value (USD Million) & Volume (Unit) Analysis and Forecast By Technology Provider, 2026 to 2036
- Butterfly Embedded
- Third-Party Licensors
- Butterfly Embedded
- Y-o-Y Growth Trend Analysis By Technology Provider, 2021 to 2025
- Absolute $ Opportunity Analysis By Technology Provider, 2026 to 2036
- Global Market Analysis and Forecast, By Application Area, 2021 to 2036
- Introduction / Key Findings
- Historical Market Size Value (USD Million) & Volume (Unit) Analysis By Application Area, 2021 to 2025
- Current and Future Market Size Value (USD Million) & Volume (Unit) Analysis and Forecast By Application Area, 2026 to 2036
- Medical
- Industrial
- Consumer
- Medical
- Y-o-Y Growth Trend Analysis By Application Area, 2021 to 2025
- Absolute $ Opportunity Analysis By Application Area, 2026 to 2036
- Global Market Analysis and Forecast, By Licensing Model, 2021 to 2036
- Introduction / Key Findings
- Historical Market Size Value (USD Million) & Volume (Unit) Analysis By Licensing Model, 2021 to 2025
- Current and Future Market Size Value (USD Million) & Volume (Unit) Analysis and Forecast By Licensing Model, 2026 to 2036
- Co-Development
- Royalty-Based
- Per-Value (USD Million) & Volume (Unit) IP License
- Co-Development
- Y-o-Y Growth Trend Analysis By Licensing Model, 2021 to 2025
- Absolute $ Opportunity Analysis By Licensing Model, 2026 to 2036
- Global Market Analysis and Forecast, By End User, 2021 to 2036
- Introduction / Key Findings
- Historical Market Size Value (USD Million) & Volume (Unit) Analysis By End User, 2021 to 2025
- Current and Future Market Size Value (USD Million) & Volume (Unit) Analysis and Forecast By End User, 2026 to 2036
- Device OEMs
- Semiconductor Firms
- Research Institutes
- Device OEMs
- Y-o-Y Growth Trend Analysis By End User, 2021 to 2025
- Absolute $ Opportunity Analysis By End User, 2026 to 2036
- Global Market Analysis and Forecast, By Region, 2021 to 2036
- Introduction
- Historical Market Size Value (USD Million) & Volume (Unit) Analysis By Region, 2021 to 2025
- Current Market Size Value (USD Million) & Volume (Unit) Analysis and Forecast By Region, 2026 to 2036
- North America
- Latin America
- Western Europe
- Eastern Europe
- East Asia
- South Asia and Pacific
- Middle East & Africa
- Market Attractiveness Analysis By Region
- North America Market Analysis and Forecast, By Country, 2021 to 2036
- Historical Market Size Value (USD Million) & Volume (Unit) Trend Analysis By Market Taxonomy, 2021 to 2025
- Market Size Value (USD Million) & Volume (Unit) Forecast By Market Taxonomy, 2026 to 2036
- By Country
- USA
- Canada
- Mexico
- By Technology Provider
- By Application Area
- By Licensing Model
- By End User
- By Country
- Market Attractiveness Analysis
- By Country
- By Technology Provider
- By Application Area
- By Licensing Model
- By End User
- Key Takeaways
- Latin America Market Analysis and Forecast, By Country
- Historical Market Size Value (USD Million) & Volume (Unit) Trend Analysis By Market Taxonomy, 2021 to 2025
- Market Size Value (USD Million) & Volume (Unit) Forecast By Market Taxonomy, 2026 to 2036
- By Country
- Brazil
- Chile
- Rest of Latin America
- By Technology Provider
- By Application Area
- By Licensing Model
- By End User
- By Country
- Market Attractiveness Analysis
- By Country
- By Technology Provider
- By Application Area
- By Licensing Model
- By End User
- Key Takeaways
- Western Europe Market Analysis and Forecast, By Country
- Historical Market Size Value (USD Million) & Volume (Unit) Trend Analysis By Market Taxonomy, 2021 to 2025
- Market Size Value (USD Million) & Volume (Unit) Forecast By Market Taxonomy, 2026 to 2036
- By Country
- Germany
- UK
- Italy
- Spain
- France
- Nordic
- BENELUX
- Rest of Western Europe
- By Technology Provider
- By Application Area
- By Licensing Model
- By End User
- By Country
- Market Attractiveness Analysis
- By Country
- By Technology Provider
- By Application Area
- By Licensing Model
- By End User
- Key Takeaways
- Eastern Europe Market Analysis and Forecast, By Country
- Historical Market Size Value (USD Million) & Volume (Unit) Trend Analysis By Market Taxonomy, 2021 to 2025
- Market Size Value (USD Million) & Volume (Unit) Forecast By Market Taxonomy, 2026 to 2036
- By Country
- Russia
- Poland
- Hungary
- Balkan & Baltic
- Rest of Eastern Europe
- By Technology Provider
- By Application Area
- By Licensing Model
- By End User
- By Country
- Market Attractiveness Analysis
- By Country
- By Technology Provider
- By Application Area
- By Licensing Model
- By End User
- Key Takeaways
- East Asia Market Analysis and Forecast, By Country
- Historical Market Size Value (USD Million) & Volume (Unit) Trend Analysis By Market Taxonomy, 2021 to 2025
- Market Size Value (USD Million) & Volume (Unit) Forecast By Market Taxonomy, 2026 to 2036
- By Country
- China
- Japan
- South Korea
- By Technology Provider
- By Application Area
- By Licensing Model
- By End User
- By Country
- Market Attractiveness Analysis
- By Country
- By Technology Provider
- By Application Area
- By Licensing Model
- By End User
- Key Takeaways
- South Asia and Pacific Market Analysis and Forecast, By Country
- Historical Market Size Value (USD Million) & Volume (Unit) Trend Analysis By Market Taxonomy, 2021 to 2025
- Market Size Value (USD Million) & Volume (Unit) Forecast By Market Taxonomy, 2026 to 2036
- By Country
- India
- ASEAN
- Australia & New Zealand
- Rest of South Asia and Pacific
- By Technology Provider
- By Application Area
- By Licensing Model
- By End User
- By Country
- Market Attractiveness Analysis
- By Country
- By Technology Provider
- By Application Area
- By Licensing Model
- By End User
- Key Takeaways
- Middle East & Africa Market Analysis and Forecast, By Country
- Historical Market Size Value (USD Million) & Volume (Unit) Trend Analysis By Market Taxonomy, 2021 to 2025
- Market Size Value (USD Million) & Volume (Unit) Forecast By Market Taxonomy, 2026 to 2036
- By Country
- Kingdom of Saudi Arabia
- Other GCC Countries
- Türkiye
- South Africa
- Other African Union
- Rest of Middle East & Africa
- By Technology Provider
- By Application Area
- By Licensing Model
- By End User
- By Country
- Market Attractiveness Analysis
- By Country
- By Technology Provider
- By Application Area
- By Licensing Model
- By End User
- Key Takeaways
- Key Countries Market Analysis
- USA
- Pricing Analysis
- Market Share Analysis, 2025
- By Technology Provider
- By Application Area
- By Licensing Model
- By End User
- Canada
- Pricing Analysis
- Market Share Analysis, 2025
- By Technology Provider
- By Application Area
- By Licensing Model
- By End User
- Mexico
- Pricing Analysis
- Market Share Analysis, 2025
- By Technology Provider
- By Application Area
- By Licensing Model
- By End User
- Brazil
- Pricing Analysis
- Market Share Analysis, 2025
- By Technology Provider
- By Application Area
- By Licensing Model
- By End User
- Chile
- Pricing Analysis
- Market Share Analysis, 2025
- By Technology Provider
- By Application Area
- By Licensing Model
- By End User
- Germany
- Pricing Analysis
- Market Share Analysis, 2025
- By Technology Provider
- By Application Area
- By Licensing Model
- By End User
- UK
- Pricing Analysis
- Market Share Analysis, 2025
- By Technology Provider
- By Application Area
- By Licensing Model
- By End User
- Italy
- Pricing Analysis
- Market Share Analysis, 2025
- By Technology Provider
- By Application Area
- By Licensing Model
- By End User
- Spain
- Pricing Analysis
- Market Share Analysis, 2025
- By Technology Provider
- By Application Area
- By Licensing Model
- By End User
- France
- Pricing Analysis
- Market Share Analysis, 2025
- By Technology Provider
- By Application Area
- By Licensing Model
- By End User
- India
- Pricing Analysis
- Market Share Analysis, 2025
- By Technology Provider
- By Application Area
- By Licensing Model
- By End User
- ASEAN
- Pricing Analysis
- Market Share Analysis, 2025
- By Technology Provider
- By Application Area
- By Licensing Model
- By End User
- Australia & New Zealand
- Pricing Analysis
- Market Share Analysis, 2025
- By Technology Provider
- By Application Area
- By Licensing Model
- By End User
- China
- Pricing Analysis
- Market Share Analysis, 2025
- By Technology Provider
- By Application Area
- By Licensing Model
- By End User
- Japan
- Pricing Analysis
- Market Share Analysis, 2025
- By Technology Provider
- By Application Area
- By Licensing Model
- By End User
- South Korea
- Pricing Analysis
- Market Share Analysis, 2025
- By Technology Provider
- By Application Area
- By Licensing Model
- By End User
- Russia
- Pricing Analysis
- Market Share Analysis, 2025
- By Technology Provider
- By Application Area
- By Licensing Model
- By End User
- Poland
- Pricing Analysis
- Market Share Analysis, 2025
- By Technology Provider
- By Application Area
- By Licensing Model
- By End User
- Hungary
- Pricing Analysis
- Market Share Analysis, 2025
- By Technology Provider
- By Application Area
- By Licensing Model
- By End User
- Kingdom of Saudi Arabia
- Pricing Analysis
- Market Share Analysis, 2025
- By Technology Provider
- By Application Area
- By Licensing Model
- By End User
- Türkiye
- Pricing Analysis
- Market Share Analysis, 2025
- By Technology Provider
- By Application Area
- By Licensing Model
- By End User
- South Africa
- Pricing Analysis
- Market Share Analysis, 2025
- By Technology Provider
- By Application Area
- By Licensing Model
- By End User
- USA
- Market Structure Analysis
- Competition Dashboard
- Competition Benchmarking
- Market Share Analysis of Top Players
- By Regional
- By Technology Provider
- By Application Area
- By Licensing Model
- By End User
- Emerging Startups
- Innovation Benchmarking
- Competition Analysis
- Competition Deep Dive
- Butterfly Network
- Overview
- Product Portfolio
- Profitability by Market Segments (Product/Region/Sales Channel)
- Sales Footprint
- Strategy Overview
- Marketing Strategy
- Product Strategy
- Channel Strategy
- Exo
- GE HealthCare
- Siemens Healthineers
- Samsung Medison
- Philips
- Canon Medical Systems
- Fujifilm Healthcare
- Butterfly Network
- Case Studies
- Success Stories
- Recent Developments
- Competition Deep Dive
- Assumptions & Acronyms Used


