The Vibrating Screen Market Analysis and Opportunity Assessment in India is estimated to be valued at USD 4256.6 million in 2025 and is projected to reach USD 117103.8 million by 2035, registering a compound annual growth rate (CAGR) of 22.5% over the forecast period.
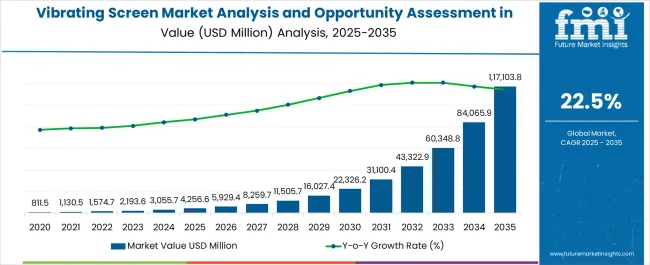
| Metric | Value |
|---|---|
| Vibrating Screen Market Analysis and Opportunity Assessment in India Estimated Value in (2025 E) | USD 4256.6 million |
| Vibrating Screen Market Analysis and Opportunity Assessment in India Forecast Value in (2035 F) | USD 117103.8 million |
| Forecast CAGR (2025 to 2035) | 22.5% |
The vibrating screen market in India is expanding steadily, fueled by rising demand from mining, construction, and aggregate processing industries. Vibrating screens play a critical role in material separation and sizing, supporting the operational efficiency of downstream processes.
Increased investment in mineral exploration, quarrying, and recycling industries has boosted demand for high-performance screening equipment. Current market dynamics are shaped by growing adoption of technologically advanced screens with enhanced durability, energy efficiency, and low maintenance requirements.
Manufacturers are focusing on improving vibration mechanisms and optimizing screen designs to meet diverse industrial needs. With ongoing infrastructure expansion and emphasis on productivity improvements in mining operations, the market outlook remains strong, ensuring long-term growth opportunities for both domestic and international manufacturers.
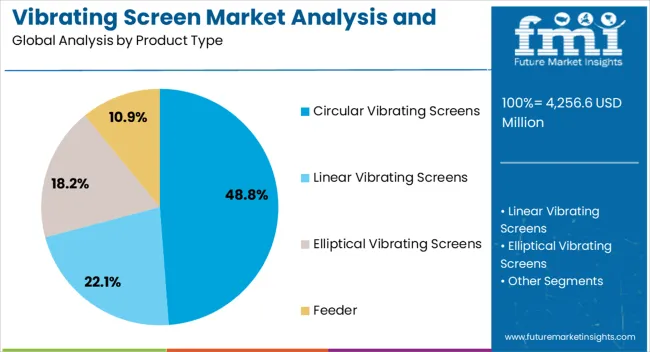
The circular vibrating screens segment dominates the product type category, accounting for approximately 48.80% share in the Indian market. This segment’s growth is supported by its versatility in handling a wide range of materials and its efficiency in delivering precise separation results.
Circular motion provides stable screening performance, making these screens suitable for aggregates, minerals, and recycling applications. Lower maintenance requirements and operational adaptability enhance their widespread use in Indian industries.
The segment’s leadership is reinforced by increasing demand from quarrying and construction activities, where uniform material sizing is essential for quality outcomes. With growing infrastructure projects and rising aggregate production, the circular vibrating screens segment is expected to maintain its leading share.
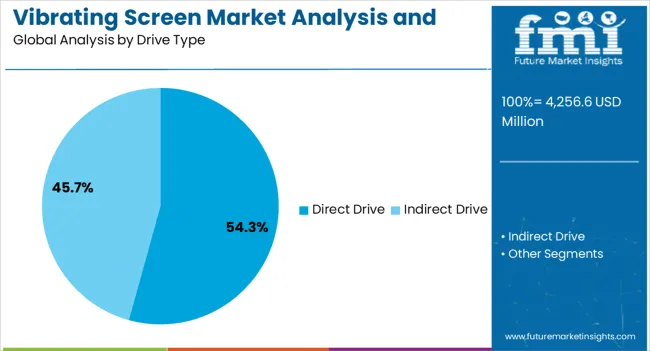
The direct drive segment holds approximately 54.30% share in the drive type category, reflecting its strong presence in the vibrating screen market in India. This drive type is preferred for its high energy efficiency, simplified mechanical design, and reduced maintenance requirements.
Direct drive technology ensures reliable power transmission and improved operational stability, contributing to enhanced productivity in demanding screening applications. Adoption has been supported by its cost-effectiveness and durability in heavy-duty environments.
The segment’s growth is also linked to its increasing use in mining and quarrying, where performance consistency is critical. With ongoing technological upgrades and industry preference for robust solutions, the direct drive segment is positioned to retain its dominant share.
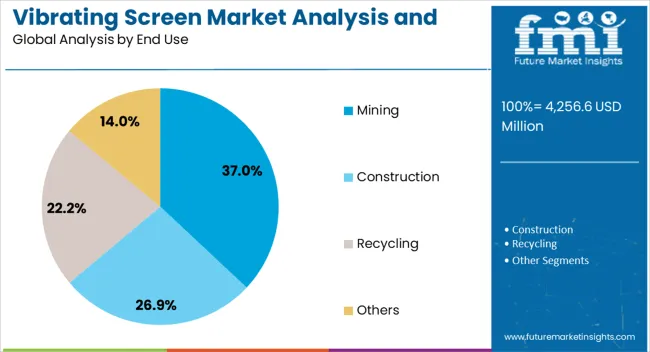
The mining segment leads the end-use category with approximately 37.00% share in the vibrating screen market in India. This dominance is attributed to the heavy reliance on vibrating screens for efficient separation and sizing of minerals in mining operations.
The segment’s growth is reinforced by rising investment in mineral extraction projects, supported by government initiatives to expand the domestic mining industry. Vibrating screens enhance the operational efficiency of crushing and grinding processes, making them indispensable in mining workflows.
The segment also benefits from growing demand for metallic and non-metallic minerals in construction, manufacturing, and energy sectors. With continued emphasis on mining sector growth, the mining segment is expected to sustain its leadership position in the Indian vibrating screen market.
East Asia Dictating the Course of the Global Vibrating Screen Market Growth
As per the latest analysis, East Asia is expected to lead the vibrating screen industry during the forecast period. It will likely hold around 35.6% of the global vibrating screen market share in 2035. This is attributed to the following factors:
Mining Sector Becoming Primary Target for Vibrating Screen Manufacturers
As per the report, the mining sector is expected to remain the leading end user of vibrating screens, holding a volume share of about 36.2% in 2025. This is attributable to the indispensable role of vibrating screens in the mining industry.
In the mining sector, vibrating screen machines are crucial in efficiently separating and classifying minerals and enhancing production processes. They also help to ensure optimal resource utilization and meet the rigorous standards for particle size distribution and material quality.
The robust demand for vibrating screens in mining applications is further fueled by the industry's continuous quest for technological advancements and operational excellence. As a result, leading vibrating screen manufacturers are targeting the mining industry for maximum sales.
On the other hand, the recycling segment is anticipated to witness higher demand, with a projected 7.3% CAGR during the forecast period. This is primarily due to the escalating emphasis on sustainable practices and environmental consciousness.
The growing need for effective waste management and implementation of stringent regulations promoting recycling initiatives are expected to propel the demand for vibrating screens. These solutions are essential for sorting, classifying, and processing recyclable materials.
Advancements in recycling technologies and a rising commitment to circular economies will also contribute to the anticipated higher demand. Similarly, the pivotal role of vibrating screens in fostering eco-friendly practices within the recycling industry will boost segment growth.
Since ancient times, industries have integrated novel technologies to separate materials quickly and efficiently. One such type that is gaining wider popularity is the vibrating screen.
Vibrating screens are widely used across industries like construction, mining, etc., to separate materials into various particle sizes through efficient and controlled screening processes. These mechanical equipment employ vibratory motion generated by an unbalanced flywheel or electromagnetic vibrator.
Separating material through vibrating screens is vital in numerous industries, including mining, where precise material sorting enhances operational efficiency. Vibrating screens play a pivotal role in processing diverse materials, facilitating optimal utilization, and contributing to producing high-quality end products. They ensure that particles are properly classified and distributed according to desired specifications.
The ongoing technological evolution within the mining industry is a significant driver shaping the vibratory screen market. With a relentless pursuit of operational efficiency, resource optimization, and safety improvements, mining operations are at the forefront of integrating cutting-edge technologies. Vibrating screens, critical in mineral processing, stand out as integral tools for efficient material separation and classification.
High adoption reflects the mining industry's recognition of the indispensable role played by advanced vibrating screens in optimizing mineral extraction processes. As mining practices evolve, the demand for technologically superior vibrating screens continues to grow.
Vibrating screens are positioned as crucial assets in modern mining operations striving for enhanced efficiency, productivity, and sustainability in mineral processing. The vibratory screen market, intertwined with the technological evolution in mining, emerges as a key facilitator in the industry's journey toward safer, more efficient, and sustainable mineral extraction processes.
Growing demand for vibrating screen machines from the thriving construction sector is expected to boost the market. The construction sector's demand for vibrating screens is propelled by a shift towards high-performance and specialty materials, necessitating precise sorting and screening in construction applications.
Industries seek innovative screen solutions for efficient material processing. As a result, the market responds with smart technologies, eco-friendly practices, and customized designs, reflecting a commitment to meeting evolving demands across construction, mining, and recycling sectors.
Sales of vibrating screens grew at a CAGR of 0.2% between 2020 and 2025. Total market revenue reached about USD 2,053.5 million in 2025. In the forecast period, the worldwide vibrating screen industry is set to thrive at a CAGR of 7.1%.
| Historical CAGR (2020 to 2025) | 0.2% |
|---|---|
| Forecast CAGR (2025 to 2035) | 7.1% |
The vibrating screen market recorded sluggish growth between 2020 and 2025. This was due to geopolitical tensions, economic uncertainties, and the impact of the COVID-19 pandemic, which led to disruptions in supply chains and delayed projects across multiple industries.
During the historical period, industries took a cautious approach towards capital expenditures. This reduced the demand for solutions like vibrating screen machines, resulting in the market experiencing slow growth.
The future outlook for the vibrating screen industry is optimistic, with an anticipated valuation of USD 4,350.2 million by 2035. This growth will likely be driven by the increasing demand for advanced screening solutions like circular vibrating sieves and linear motion vibrating screens across diverse industries, including mining, construction, and recycling.
The increasing focus on efficient mineral processing in mining operations will likely propel the demand for advanced vibrating screens. As mining activities evolve with technological advancements, the vibratory screen market is set to benefit from the industry's pursuit of heightened efficiency and sustainability.
The growing prominence of vibrating screens in recycling operations aligns with global initiatives for sustainable waste management. Vibratory screens play a pivotal role in sorting and processing recycled materials, contributing to environmental responsibility and driving market expansion.
Growing adoption of vibrating screens in emerging sectors such as pharmaceuticals and food processing will also facilitate market expansion. The continuous emphasis on efficiency, automation, and product quality is expected to fuel the demand for vibrating screens, with technological advancements further enhancing their capabilities.
Global Embrace of Sustainable Practices Driving Vibrating Screen Market
The shift toward sustainable practices is a paramount driver influencing the vibrating screen market. Industries, spurred by heightened environmental awareness, are actively embracing eco-friendly and energy-efficient solutions. This eco-conscious shift extends to vibrating screens, which are essential in the material processing landscape.
Manufacturers are responding by integrating advanced technologies into screen designs, aiming to reduce energy consumption and minimize the environmental footprint. Vibrating screens tailored for sustainability not only comply with rigorous environmental standards but also resonate with industries committed to responsible manufacturing.
The driver underscores the pivotal role of vibrating screens in facilitating the transition to greener operational practices. As integral contributors to sustainable and eco-conscious industrial processes, these screens are becoming vital assets in the broader commitment to environmental stewardship. They align with the global imperative for responsible and sustainable industrial practices.
Technological Advancements Fueling Demand for Smart Vibrating Screens
A driving force propelling the vibrating screen market forward is the relentless pace of technological advancements. Industries, in pursuit of operational excellence, are increasingly seeking intelligent solutions, driving the integration of smart features into vibrating screens.
The incorporation of real-time monitoring and predictive maintenance capabilities represents a paradigm shift in material processing efficiency. These features empower industries with immediate insights into screen performance, facilitating proactive maintenance and minimizing downtime.
The demand for technologically advanced vibrating screens underscores the industry's commitment to innovation and efficiency in material processing. As integral components in the journey toward Industry 4.0, smart vibrating screens are becoming indispensable assets.
Smart vibrating screens are poised to shape the future of material screening processes. This is due to their ability to provide real-time data-driven insights, enhance overall operational excellence, and meet the evolving demands of modern industries.
Growing Urbanization Fostering Vibrating Screen Market Expansion
Another key factor expected to boost the market is the unprecedented pace of urbanization. As urban areas expand at an unprecedented rate, the demand for construction materials, such as aggregates, surges. Vibrating screens emerge as indispensable components in this landscape, facilitating the efficient processing and sorting of materials crucial for infrastructure development.
Urbanization drives the need for high-quality construction materials to meet the demands of burgeoning construction projects in cities worldwide. Vibrating screens play a pivotal role in ensuring a streamlined and sustainable supply of aggregates, catering to the escalating demands of modern urban landscapes.
Maintenance Challenges in Harsh Operating Environments
The maintenance challenges in harsh operating environments present a substantial restraint in the vibrating screen market, particularly for industries such as mining and construction. In these sectors, vibrating screens often operate in environments characterized by dust, abrasion, and corrosive substances. The harsh conditions contribute to accelerated wear and tear of the screens, necessitating more frequent and extensive maintenance.
Regular maintenance is crucial to ensure the optimal performance of vibrating screens. However, performing maintenance tasks in challenging environments where dust, abrasive particles, or corrosive elements are prevalent becomes time-consuming and costly. Accessing and servicing equipment in such conditions often requires specialized efforts and protective measures, adding to the overall operational complexity.
The constraint is notable for end users as it directly impacts operational efficiency. Increased maintenance demands not only elevate operational costs but also have the potential to result in downtime, disrupting production schedules and impacting overall productivity.
Market Vulnerability to Raw Material Price Volatility
A significant restraint impacting the vibratory screen industry is its vulnerability to the volatility of raw material prices. The production of vibrating screens relies on various materials, including metals, polymers, and electronics.
Fluctuations in the prices of raw materials can significantly influence manufacturing costs, posing challenges for both manufacturers and end-users. Price volatility may lead to uncertainties in production planning, affecting profit margins and pricing strategies within the market.
Sudden increases in raw material costs can potentially hinder market growth, especially for smaller players or those with limited financial flexibility. Mitigating this restraint requires strategic sourcing practices, long-term supplier partnerships, and, in some cases, the exploration of alternative materials to ensure resilience against market fluctuations.
As the vibratory screen market strives for stability and sustained growth, managing the impact of raw material price volatility emerges as a critical consideration in maintaining competitiveness and industry stability. This price factor might limit market expansion to a certain extent through 2035.
Sales of vibrating screens in India are expected to rise rapidly during the assessment period, making it a highly lucrative pockets for Indian vibrating screen manufacturers. Factors such as rapid industrialization and urbanization, increasing usage of vibratory screen technology in mining sector, and growing demand for industrial screening equipment are expected to drive India vibrating screen industry growth.
The table below highlights the vibrating screen market revenue in different regions across India. Gujarat, Maharashtra, and Rajasthan are predicted to remain the top three consumers of vibrating screens, with expected valuations of USD 117103.8 million, USD 39.9 million, and USD 22.7 million, respectively, in 2035.
| Countries | Vibrating Screen Industry Revenue (2035) |
|---|---|
| Gujarat | USD 117103.8 million |
| Maharashtra | USD 39.9 million |
| Rajasthan | USD 22.7 million |
| Uttar Pradesh | USD 20.9 million |
| West Bengal | USD 17.0 million |
The below table shows the anticipated growth rates of the top five states. Goa, Tamil Nadu, and Bihar are set to record higher CAGRs of 8.3%, 8.2%, and 8.2%, respectively, through 2035.
| Countries | Projected Vibrating Screen CAGR (2025 to 2035) |
|---|---|
| Goa | 8.3% |
| Tamil Nadu | 8.2% |
| Bihar | 8.2% |
| Maharashtra | 8.0% |
| Karnataka | 7.6% |
Gujarat’s vibrating screen market is poised to exhibit a CAGR of 6.6% during the assessment period, totaling USD 117103.8 million by 2035. The expanding mining sector serves as a potent catalyst driving demand for vibrating screens in Gujarat.
Gujarat is experiencing a sharp rise in mining activities, fueled by the state's rich mineral reserves and increasing exploration and extraction operations. This, in turn, is expected to elevate vibrating screen demand in the region through 2035.
Vibrating screens play a critical role in mining, facilitating efficient material separation, sizing, and sorting. As a result, their adoption is growing significantly across Gujarat.
Gujarat's proactive approach towards industrial development further amplifies the demand for vibrating screens as essential equipment in the region. Similarly, supportive government policies and investments in mining infrastructure will enhance Gujarat’s vibrating screen market share.
Sales of vibrating screens in Maharashtra are projected to surge at a CAGR of around 8.0% during the assessment period. Total valuation in the state is anticipated to reach USD 39.9 million by 2035.
Maharashtra is poised to witness healthy growth due to several pivotal factors. The state is witnessing unprecedented industrialization, rapid urbanization, and a surge in infrastructure projects. This, in turn, is contributing to heightened demand for vibrating screens.
Maharashtra's robust economy, diverse industrial landscape, and strategic geographical location make it a key hub for manufacturing and production activities. This is further propelling the adoption of vibrating screens in the region.
The state's commitment to technological advancements and adherence to stringent quality standards position it as a frontrunner in the vibrating screen industry expansion. Hence, a robust CAGR has been predicted for the Maharashtra vibrating screen industry.
The vibrating screen market value in Rajasthan is anticipated to total USD 22.7 million by 2035. Over the assessment period, vibrating screen demand in the state is set to increase at a robust CAGR of 7.4%.
Rajasthan stands as a prominent hub for vibrating screen manufacturers. The state’s abundant mineral resources, particularly in mining-rich regions, position it as a pivotal player in the vibrating screen manufacturing landscape.
The flourishing mining sector in the state, coupled with the increasing demand for efficient material processing solutions, propels the need for high-quality vibrating screens. As the demand for these screens continues to grow in sectors like mining, construction, and agriculture, Rajasthan emerges as a promising destination for manufacturers looking to capitalize on the burgeoning opportunities within the screening machine market.
The below section shows the mining segment dominating the vibrating screen industry. It is forecast to thrive at a 7.1% CAGR between 2025 and 2035. Based on drive type, the direct drive segment is anticipated to progress at a CAGR of 6.9% during the forecast period.
| Top Segment (End-use) | Mining |
|---|---|
| Predicted CAGR (2025 to 2035) | 7.1% |
Based on end-use, the market is segmented into construction, mining, recycling & others. Among these, the mining industry is expected to remain leading consumer of vibrating screens.
The mining segment's dominance is underscored by the indispensable role of vibrating screens in mineral extraction and processing operations. The robust demand for raw materials and minerals, driven by global infrastructure development and industrialization, fuels the need for efficient material screening and sorting technologies, where vibrating screens play a pivotal role.
The stringent quality standards in the mining industry necessitate precision in material sizing. This makes vibrating screens the preferred choice for achieving accurate particle separation. The versatility of vibrating screens in handling various types of ores and minerals further solidifies their significance in the mining sector.
The continuous advancements in vibrating screen technologies, catering specifically to the demands of the mining industry, contribute to their widespread adoption. Enhanced durability, increased throughput, and adaptability to diverse mining applications make vibrating screens a preferred solution, amplifying their dominance in the global and Indian markets.
The mining segment held a significant volume share of 36.2% in 2025. Over the forecast period, demand for vibrating screens in the mining sector is set to rise at a CAGR of 7.1%.
| Top Segment (Drive Type) | Direct Drive |
|---|---|
| Projected CAGR (2025 to 2035) | 6.9% |
The vibrating screen industry is segmented into direct drive and indirect drive. Among these, the direct drive category is emerging as a preferred choice. The target segment is set to thrive at 6.9% CAGR during the forecast period, totaling USD 2,506.3 million by 2035.
The demand for vibrating screens with direct drive is propelled by its inherent advantages in terms of efficiency, simplicity, and reduced maintenance requirements. The direct drive mechanism eliminates the need for additional components like belts and pulleys, resulting in a more straightforward and energy-efficient design.
The preference for direct drive vibrating screens is also attributed to their higher reliability and lower susceptibility to wear and tear than indirect drive counterparts. The elimination of transmission elements minimizes power losses, ensuring a more direct and responsive operation and ultimately enhancing the overall performance of the vibrating screen.
The direct drive category aligns well with the increasing focus on sustainability and energy efficiency in industrial processes. Its streamlined design not only reduces energy consumption but also contributes to a lower environmental footprint, aligning with the industry's growing emphasis on eco-friendly practices.
As the industry continues to prioritize efficiency, reliability, and sustainability, the direct drive segment is expected to maintain its preferred status in the market. This reflects a continual shift towards more advanced and resource-efficient technologies.
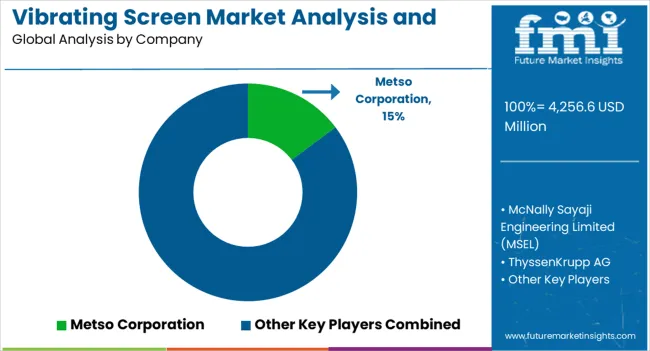
The vibrating screen market is fragmented, with leading players accounting for about 20% to 25% share. ThyssenKrupp AG, Metso Corporation, FLSmidth, Terex Corporation, Schenck Process, Haver & Boecker Niagara, JOST GmbH + Co. KG, McLanahan Corporation & McNally Sayaji. are the leading manufacturers of vibrating screens listed in the report.
Top vibrating screen companies are investing in continuous research to develop novel solutions with enhanced features. They also employ strategies like facility expansions, collaborations, partnerships, acquisitions, and mergers to expand their customer base and global footprint.
Recent Developments in Vibrating Screen Market
| Attribute | Details |
|---|---|
| Estimated Market Size (2025) | USD 2,193.6 million |
| Projected Market Size (2035) | USD 4,350.2 million |
| Anticipated Growth Rate (2025 to 2035) | 7.1% |
| Historical Data | 2020 to 2025 |
| Forecast Period | 2025 to 2035 |
| Quantitative Units | Value (USD million) and Volume (Units) |
| Report Coverage | Revenue Forecast, Volume Forecast, Company Ranking, Competitive Landscape, Growth Factors, Trends, and Pricing Analysis |
| Market Segments Covered | Product Type, Drive Type, End Use, Region |
| Regions Covered | North America; Latin America; Western Europe; Eastern Europe; East Asia; South Asia & Pacific; Middle East & Africa; North India; East India; West India; South India |
| Key States Covered | Goa, Tamil Nadu, Bihar, Maharashtra, Rest of East India, Karnataka, Rajasthan, Jharkhand, Andhra Pradesh, Punjab, West Bengal, Rest of North India, Gujarat, Telangana, Haryana, Uttar Pradesh, Rest of South India |
| Key Companies Profiled | McNally Sayaji Engineering Limited (MSEL); Metso Corporation; ThyssenKrupp AG; Sandvik AB (Kwatani); FLSmidth; Terex Corporation; Haver & Boecker Niagara; Schenck Process Europe GmbH; JOST GmbH + Co. KG; McLanahan Corporation; Elgin Equipment Group; Galaxy Sivtek Pvt. Ltd.; ETA Engineering Services; Nishi Techno-Sys; Vibromag Industries; Star Trace Private Limited; Amarshiva Engineering Company; Magwell Industries; Mitool Equipments Pvt. Ltd.; Nesans Mining and Automation Pvt. Ltd.; Mewar Hitech Engineering Ltd.; Ecoman India; Xinxiang Zhenying Mechanical Equipment Co., Ltd.; Aury Australia Pty. Ltd.; Carrier Vibrating Equipment, Inc. |
The global vibrating screen market analysis and opportunity assessment in india is estimated to be valued at USD 4,256.6 million in 2025.
The market size for the vibrating screen market analysis and opportunity assessment in india is projected to reach USD 117,103.8 million by 2035.
The vibrating screen market analysis and opportunity assessment in india is expected to grow at a 22.5% CAGR between 2025 and 2035.
The key product types in vibrating screen market analysis and opportunity assessment in india are circular vibrating screens, linear vibrating screens, elliptical vibrating screens and feeder.
In terms of drive type, direct drive segment to command 54.3% share in the vibrating screen market analysis and opportunity assessment in india in 2025.


Full Research Suite comprises of:
Market outlook & trends analysis
Interviews & case studies
Strategic recommendations
Vendor profiles & capabilities analysis
5-year forecasts
8 regions and 60+ country-level data splits
Market segment data splits
12 months of continuous data updates
DELIVERED AS:
PDF EXCEL ONLINE
Vibrating Gravity Feeder Market Size and Share Forecast Outlook 2025 to 2035
Vibrating Conveyer Market Size and Share Forecast Outlook 2025 to 2035
Vibrating Feed Conveyors Market
Vibrating Screen Market Size and Share Forecast Outlook 2025 to 2035
Screen Cleaner Market Analysis by Type, Application and Region from 2025 to 2035
Screenless Display Market
Screen Printing Mesh Market Size and Share Forecast Outlook 2025 to 2035
Windscreen Adhesives Market Size and Share Forecast Outlook 2025 to 2035
Rainscreen Cladding Market Growth - Trends & Forecast 2025 to 2035
Lab Screening Test Kit Market
Dual Screen Laptops Market Size and Share Forecast Outlook 2025 to 2035
Touchscreen Controller Market Growth - Trends & Outlook 2025 to 2035
Touchscreen Gloves Market
Drug Screening Market Overview - Trends, Demand & Forecast 2025 to 2035
Oral Screening Systems Market
Sand Screens Market Analysis - Size, Growth, and Forecast 2025 to 2035
Multi-Screen Super Glass Market Size and Share Forecast Outlook 2025 to 2035
Touch Screen Film Market Size and Share Forecast Outlook 2025 to 2035
Touch Screen Module Market
Sleep Screening Devices Market Trends and Forecast 2025 to 2035

Thank you!
You will receive an email from our Business Development Manager. Please be sure to check your SPAM/JUNK folder too.
Chat With
MaRIA