
- Market Size (2026)
- USD 122.1 Bn
- Forecast (2036)
- USD 404.1 Bn
- CAGR (2026 to 2036)
- 12.7%
How big is the Wine Tourism Market in 2026?
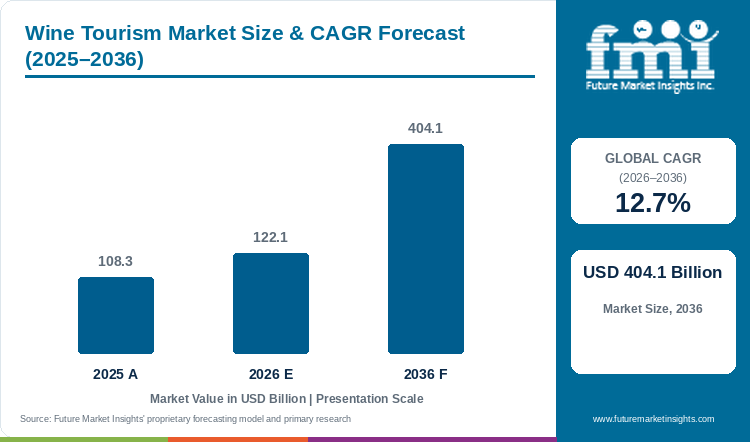
The Wine Tourism Market is projected to expand at a CAGR of 12.7% between 2026 and 2036. Market value rises from USD 108.3 billion in 2025 to USD 122.1 billion in 2026 and USD 404.1 billion by 2036.
The wine tourism market was valued at USD 108.3 Billion in 2025. Winery visits and tastings held a 38.7% share by activity, while travelers aged 30–40 accounted for 26.8% of revenue by age group in 2025. Guided tastings, food pairings and vineyard stays give operators several ways to earn from a visit. The wine tourism market is estimated at USD 122.1 Billion in 2026 and forecast at USD 404.1 Billion by 2036, with 12.7% CAGR over 2026 to 2036. Winery visits and tastings held 38.7% of activity revenue in 2025, while the 30–40 age group accounted for 26.8% of spending by age.
Visitor purchases determine the value of a wine-region trip. A cellar tour has a different price and service requirement from a day that includes dining, guided tastings and transport. The Global Wine Tourism Report found that two-thirds of surveyed wineries considered wine tourism profitable or very profitable. Its findings covered 1,310 wineries across 47 countries, illustrating the role of visitor experiences within the participating businesses. This market is intrinsically linked to the wider tourism market and the wine market. Wine tourism revenue is assessed through travel and visitor experiences. Ordinary retail wine demand follows a separate purchasing pattern and is excluded from this market's boundary.
Key Market Trends & Insights
- Winery visits and tastings held 38.7% of activity revenue in 2025.
- Travelers aged 30-40 accounted for 26.8% of age-group revenue in 2025.
- The Global Wine Tourism Report found tourism generated around one-quarter of participating wineries’ revenue on average.
- Tastings, food pairings, trails and educational visits require clear schedules, inclusions and reservation arrangements.
Regional Highlights
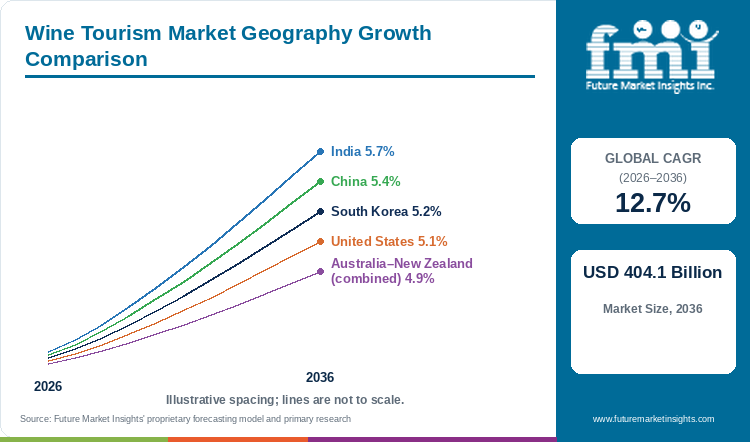
- India leads the profiled forecasts at 5.7% CAGR through 2036, followed by China at 5.4%.
- South Korea is forecast at 5.2% CAGR and the United States at 5.1%.
- The combined Australia–New Zealand market has a 4.9% CAGR outlook; this is a combined profile rather than a separate rate for either country.
Market Size & Forecast
Table 1: Market Size and Forecast for the Wine Tourism Market (USD billion and percentage), 2025 to 2036
| Metric | Value |
|---|---|
| 2025 Market Size | USD 108.3 billion |
| Estimated Market Size in 2026 | USD 122.1 billion |
| Projected Market Size by 2036 | USD 404.1 billion |
| CAGR, 2026 to 2036 | 12.7% |
| Added Revenue, 2026 to 2036 | USD 282.0 billion |
| Market Expansion Multiple | 3.3x |
The market is forecast to expand at 12.7% CAGR over 2026 to 2036. The visitor offer ranges from a short cellar tasting to a multi-estate journey with dining, transport and accommodation. Revenue depends on the experiences purchased during the trip; ordinary retail wine sales follow a separate purchasing pattern.
Wine Tourism Market Industry and Operating Indicators
Published product, supplier and service developments describe the operating choices within this market.
Table 2: Industry Indicators for the Wine Tourism Market, 2025 to 2026
| Indicator | Data Point | Why It Matters | Source |
|---|---|---|---|
| Winery tourism survey | The Global Wine Tourism Report covered 1,310 wineries in 47 countries; two-thirds considered tourism profitable or very profitable. | Documents tourism’s role within participating wineries rather than all wine businesses. | |
| French wine visitor infrastructure | Atout France identified 12 million wine tourists in 2023 and more than 10,000 cellars open to visitors. | Shows the scale of a documented destination’s visitor offer and access points. | |
| Australian winery-visit trips | Tourism Research Australia recorded 7.7 million trips involving winery visits and AUD 9.6 billion in total trip spending in its 2024 survey. | Measures the wider trip, including spending outside wineries, when evaluating destination demand. | |
| Napa destination activity | Visit Napa Valley reported 3.8 million visitors and USD 2.8 billion in total economic impact for its latest reported year. | Describes the wider destination economy serving wine-region visitors, rather than wine-tour receipts alone. |
Analyst Perspective
A vineyard visit becomes easier to purchase when the tasting, dining, transport and accommodation arrangements fit together. Operators can use clear schedules and inclusions to help guests compare a short cellar visit with a longer wine-region stay. Destination partnerships can extend the visit beyond one estate, provided local suppliers can deliver the activities and hospitality included in the itinerary.
- Ronak Shah, Principal Consultant, Future Market Insights.
How is the Wine Tourism Market segmented?
Wine Tourism Market is segmented by Activity Type, Age Group, Demography, Tourism Type, Tour Type.
By Activity Type: Winery Visits and Tasting, Wine Trails, Wine Festivals and Events, Wine Education and Workshops, Other Activities.
By Age Group: Less than 20 years, 20-30 years, 30-40 years, 40-50 years, Over 50 years.
By Demography: Men, Women.
By Tourism Type: Domestic Tourists, International Tourists.
By Tour Type: Individual, Group.
By Region: North America, Latin America, Western Europe, Eastern Europe, East Asia, South Asia and Pacific, Middle East and Africa.
The market is analyzed by Activity Type, Age Group, Demography, Tourism Type, Tour Type and Region.
Why do winery visits and tastings lead demand by activity type?
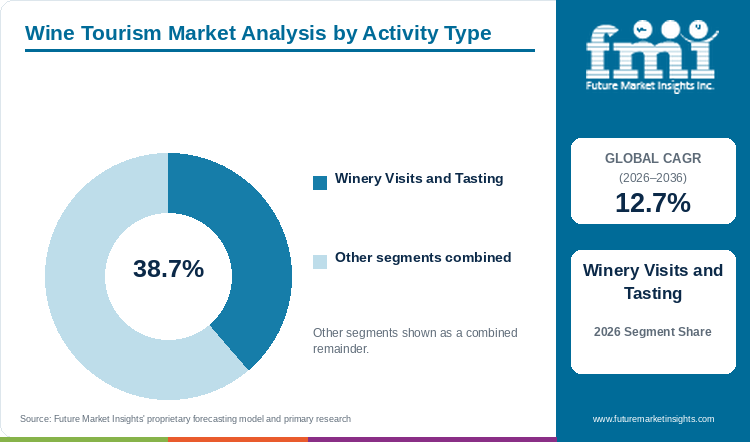
Winery visits and tastings held 38.7% of activity revenue in 2025. Hosted visits connect tasting, estate interpretation and on-site hospitality within a bookable experience. [3]
Table 3: Activity Type Share for the Wine Tourism Market (percentage share), 2025
| Activity Type | Share (2025) |
|---|---|
| Winery visits and tastings | 38.7% |
| All other activities combined | 61.3% |
| Total | 100.0% |
Table 4: Activity Type Focus and Market Growth for the Wine Tourism Market, 2026 to 2036
| Metric | Value |
|---|---|
| Global CAGR (2026 to 2036) | 12.7% |
| Leading Segment | Winery Visits and Tasting |
Winery visits and tastings account for 38.7% of wine tourism revenue by activity type in 2025. Guided estate visits remain the main entry point for a paid wine experience. A winery visit gives travelers a structured activity that can be easily fitted into a weekend or day trip. It also gives the operator several ways to earn revenue through a tasting fee, a guided tour, or a paired meal. French tourism agency Atout France reported more than 10,000 cellars open to visitors, showing how important the visit itself has become to the wine-region offer. The next challenge is converting an initial tasting into a longer relationship, where a visitor returns for a seasonal event or books a higher-priced private session.
- Leading Share: Winery visits and tastings hold a 38.7% share of activity revenue in 2025.
- Revenue Multiplicity: The category benefits from paid admissions, hosted tastings, and on-site hospitality, creating multiple revenue streams from a single visitor.
Why does the 30-40 age group hold the leading revenue share?
Travelers aged 30-40 accounted for 26.8% of age-group revenue in 2025. Timed tastings, independent stays and small-group packages provide different ways to fit a winery visit into the trip.
Travelers aged 30-40 accounted for 26.8% of wine tourism revenue by age group in 2025. Independent trips and small-group packages give these customers several ways to visit an estate. Wineries can sell timed tastings within a birthday celebration, weekend break or food-focused itinerary. Clear online availability helps visitors compare destinations and coordinate their schedule. The 26.8% figure measures revenue by age group.
- Leading Share: The 30-40 age group accounts for 26.8% of revenue in 2025.
- Itinerary Integration: Experiences that combine tasting, food, and a manageable travel schedule suit the short, planned trips favored by this demographic.
How are domestic and international visitors influencing demand?
Domestic and international tourists form separate demand categories. Domestic travel can support repeat visits, while international tourists often need a complete destination itinerary. Domestic visitors can return to nearby wine regions several times during a year, purchasing shorter tastings and attending seasonal events. International tourists usually need clearer information on travel time, language support, and booking policies. French tourism research recorded both local and overseas demand, with foreign visitors accounting for about 45% of the country’s wine tourists. Trip design also differs by region; Australia recorded 7.7 million trips involving winery visits in its 2024 survey, measuring spending on the entire trip, which includes services outside the winery.
- Domestic Tourism: Generates repeated bookings at accessible travel distances, supporting seasonal and event-based revenue.
- International Tourism: Places greater weight on transport logistics, language information, and confirmed reservations well in advance.
How do individual and group tours differ in commercial value?
Individual tours allow visitors to set their own itinerary, while group tours depend on coordinated transport, fixed schedules, and enough capacity at each winery. Independent travelers may book several wineries directly and adjust their plans around dining or accommodation. Group operators can assemble multi-estate circuits with one purchase decision. Each route has a different operating cost. A private visit needs more staff time per customer, while a large group can strain tasting-room space and arrival slots. FMI profiles BKWine Tours and Gourmet Touring among specialist travel organizers, alongside estate-led providers such as CVNE and Delaire Graff Estate.
- Individual Tours: Create demand for bookable time slots, flexible itinerary design, and direct-to-consumer digital booking platforms.
- Group Packages: Require coordinated timing, reliable transport logistics, and clear, high-volume group pricing structures.
What are the drivers, restraints, and opportunities in the Wine Tourism Market?
The main growth driver is demand for guided wine-region experiences. Staffing, seasonality, and trip costs limit expansion. Combined tasting, dining, and accommodation packages offer a revenue opportunity.
- Driver: Wineries can earn from guided visits, tasting sessions, and food experiences alongside on-site wine sales.
- Restraint: Rural travel access, trained hospitality labor, peak-season congestion, and alcohol-service rules can restrict capacity.
- Opportunity: Pre-booked itineraries and partnerships with hotels or restaurants can combine tasting with a longer stay.
Guided Experiences Create More Visitor Revenue
A visitor who books a hosted tasting usually needs more service than someone purchasing a bottle at a shop. Operators must provide a guide, tasting space, and an agreed schedule. Those costs can be recovered through ticket pricing when the experience is clear and delivered consistently. The global winery survey found that wine tourism was profitable or very profitable for about two-thirds of its respondents. Food pairings and themed walks can support a higher ticket value when they fit the venue, though wineries must protect the core tasting experience from overly complex, hard-to-staff additions.
Capacity and Seasonality Restrict Operating Growth
Wine destinations often face uneven demand across weekends and harvest periods. Tours need trained people who can explain production and serve visitors responsibly. The rural location of many estates creates an additional need for transport planning. These practical limits matter when operators promise fixed times for groups. The global wine tourism survey identified economic pressure, weaker wine consumption, and staffing shortages as industry challenges that strong online promotion alone cannot solve.
Regional Partnerships Create More Complete Itineraries
Wine destinations can increase their appeal by making the trip easier to organize. A coordinated route can link a vineyard with a hotel and a local restaurant. Official visitor research from Australia shows that winery trips involve substantial activity outside the cellar door, with regional Australia accounting for most winery-visit trips. Booking systems can help estates control arrival times, but operators must ensure digital bookings translate into confirmed attendance and workable staffing schedules.
Which country CAGRs are profiled in the Wine Tourism Market?
The following country CAGRs cover 2026 to 2036.
Table 5: Country and Combined-Market CAGR Comparison for the Wine Tourism Market (%), 2026 to 2036
| Country / Combined Market | CAGR |
|---|---|
| India | 5.7% |
| China | 5.4% |
| South Korea | 5.2% |
| United States | 5.1% |
| Australia–New Zealand (combined) | 4.9% |
How do country-level CAGRs compare in the wine tourism market?
The country outlook gives India the highest growth rate among the five profiled markets at 5.7% from 2026 to 2036. China is projected at 5.4% and South Korea at 5.2%. The USA is forecast at 5.1%, while Australia–New Zealand is shown as a combined market at 4.9%. These forecasts describe different visitor bases and operating conditions.
India: Nashik provides a domestic weekend-trip base with winery tours and tasting programs. China: Ningxia has a large concentration of estates and an established visitor circuit. South Korea: Yeongdong offers wine-focused events and a permanent visitor attraction. United States: Napa Valley combines winery activity with hotels, dining, and organized trips. Australia–New Zealand: Established regional wine routes support leisure and international visits.
Country-wise Analysis
India
India wine tourism is projected to increase at a 5.7% CAGR from 2026 to 2036. Maharashtra Tourism identifies Nashik as a wine destination and lists guided visits at Sula Vineyards. Vineyard trips can be sold as a short break from nearby urban markets. Commercial growth will depend on reliable tasting slots, accommodation choices, and travel access rather than visitor interest alone.
China
China wine tourism is projected to expand at a 5.4% CAGR through 2036. Ningxia’s regional development agency reported 261 wineries and roughly 3 million annual visitors. This provides an existing group of operators and venues that can offer organized visits. The main challenge is converting the regional wine identity into bookable experiences that justify the journey and visitor spend.
South Korea
South Korean wine tourism is forecast to grow at a 5.2% CAGR during the assessment period. The Korea Tourism Organization lists the Yeongdong Wine Tunnel as a permanent attraction with exhibitions and tasting activities. Yeongdong also hosted a national wine festival in June 2026. Operators can use these established venues to reach domestic visitors seeking a planned day trip or wine event.
United States
The United States wine tourism market is expected to rise at a 5.1% CAGR from 2026 to 2036. Visit Napa Valley reported 3.8 million visitors and USD 2.8 Billion in total economic impact for its latest reported year. The estimate measures the wider destination economy rather than wine tour receipts alone. Hotels, restaurants, and winery services are important parts of this visitor offer.
Australia-New Zealand
Australia-New Zealand is profiled as a combined market with a 4.9% CAGR through 2036. Tourism Research Australia recorded 7.7 million trips involving winery visits and AUD 9.6 Billion in total spending across those trips. The 2026 Great Wine Capitals awards recognized a wine tourism operator in Hawke’s Bay, New Zealand. The two markets offer different routes and visitor profiles, so the combined CAGR should not be presented as a separate forecast for either country.
Other major wine destinations have established visitor infrastructure even where this report does not provide a country CAGR. Atout France identifies 12 million wine tourists and more than 10,000 visitable cellars in France. Italy’s tourism agency has documented the role of food-and-wine experiences in foreign tourism spending.
Who are the notable companies in the Wine Tourism Market?
BKWine Tours, Gourmet Touring, González Byass, Villa Melnik Winery, Vergelegen Estate, CVNE, Viña Matetic, Napa Valley Wine Train, Delaire Graff Estate and Robert Mondavi Winery are among the notable participants profiled in this market.
Wine tourism has no single delivery model. Tour organizers assemble itineraries across multiple estates. Winery groups earn from visits at their own properties. Destination experiences such as the Napa Valley Wine Train provide a separate way to package local wine and hospitality. These differences make direct comparison by revenue difficult. The named companies compete through the quality of the booked visit and the strength of the destination.
- Tour planners and organized itineraries: BKWine Tours and Gourmet Touring.
- Winery and estate visitor programs: González Byass, Villa Melnik Winery, Vergelegen Estate, CVNE, Viña Matetic, Delaire Graff Estate, and Robert Mondavi Winery.
- Wine-themed destination travel: Napa Valley Wine Train.
Competitive Benchmarking: Wine Tourism Market
Table 6: Competitive Benchmarking for the Wine Tourism Market (documented business models), 2026
| Participant | Business Model | Visitor Offer | Market Position |
|---|---|---|---|
| BKWine Tours | Specialist tour organizer | Multi-estate wine itineraries | Tour planning |
| Gourmet Touring | Tour organizer | Guided wine and food journeys | Tour planning |
| González Byass | Wine producer and estate | Wine cellar and producer visits | Estate-based |
| Villa Melnik Winery | Winery | Local winery visits | Estate-based |
| Vergelegen Estate | Estate and hospitality | Wine, dining and garden visits | Estate-based |
| CVNE | Winery group | Winery and cellar experiences | Estate-based |
| Viña Matetic | Winery and hospitality | Sustainability-led estate tours | Estate-based |
| Napa Valley Wine Train | Destination experience operator | Rail-based wine-country visits | Destination-based |
| Delaire Graff Estate | Wine estate and hospitality | Wine, dining and accommodation | Estate-based |
| Robert Mondavi Winery | Winery | Hosted tastings and winery visits | Estate-based |
Key Developments in the Wine Tourism Market
- In April 2026, Constellation Brands completed the reopening of the transformed Robert Mondavi Winery estate in Oakville, Napa Valley, following a three-year renovation exceeding USD 100 million. The revamped estate introduced an expanded wine tourism offering comprising private vineyard tours, curated tasting experiences, and food-and-wine pairings priced between USD 60 and USD 180 per person, reinforcing the estate’s positioning at the premium end of Napa Valley hospitality [1].
- In October 2025, Delaire Graff Estate in Stellenbosch reopened its winery building, Delaire Graff Restaurant, Wine Lounge, Lorenzo’s Cucina Italiana, and retail boutiques following an extensive refurbishment by David Collins Studio. The restored complex strengthened the estate’s standing as a luxury wine tourism destination across the Cape Winelands, underpinned by its recognition on The World’s 50 Best Vineyards 2025 list at number 79 [2].
- In September 2026, González Byass hosted the Sherrymaster by Tío Pepe event at Jerez de la Frontera on 2 and 3 September, combining culinary demonstrations, sherry tastings across historic Tío Pepe cellars, and winemaker sessions. The event was part of the estate’s programming under Jerez’s designation as Spain’s Capital of Gastronomy 2026 and reflected González Byass’s continued investment in experiential wine tourism at its Jerez bodega, one of Spain’s most visited wine destinations with over 200,000 annual visitors [3].
Key Players in the Wine Tourism Market
Specialist Tour Companies
- BKWine Tours
- Gourmet Touring
Winery and Estate Operators
- González Byass
- Villa Melnik Winery
- Vergelegen Estate
- Compañía Vinícola del Norte de España (CVNE)
- Viña Matetic
- Delaire Graff Estate
- Robert Mondavi Winery
Destination Experience Operators
- Napa Valley Wine Train
Wine Tourism Market - Report Scope
Table 7: Report Scope for the Wine Tourism Market (coverage and definitions), 2026 to 2036
| Coverage Field | Report Scope |
|---|---|
| Market breakdown | Activity type; age group; demography; tourism type; tour type; region |
| Quantitative units | USD Billion for market value; CAGR and market shares in percent |
| Market definition | Travel experiences built around visits to wineries and vineyards, tastings, wine routes, festivals or wine-related workshops. General wine retail sales unrelated to a visit are outside the activity definition. |
| Activity categories | Winery visits and tastings; wine trails; wine festivals and events; wine education and workshops; other activities |
| Regions covered | North America; Latin America; Western Europe; Eastern Europe; East Asia; South Asia and Pacific; Middle East and Africa |
| Country CAGR coverage | India; China; South Korea; United States; Australia–New Zealand (combined) |
| Key companies profiled | BKWine Tours; Gourmet Touring; González Byass; Villa Melnik; Vergelegen; CVNE; Viña Matetic; Napa Valley Wine Train; Delaire Graff; Robert Mondavi |
| Forecast period | 2026 to 2036 |
| Approach | Market forecast with segment and country outlook, informed by official tourism research and industry operating evidence |
Wine Tourism Market - Research Methodology
Table 8: Research Methodology for the Wine Tourism Market (methods and approach), 2026 edition
| Method | Approach |
|---|---|
| Operator and Visitor Analysis | Winery tours, organized itineraries, destination services and hospitality arrangements are examined through documented offers and public visitor research. |
| Desk research | The evidence review draws on tourism agencies, public visitor surveys, academic research, destination bodies and documented company services. Sources are evaluated for geographic and activity coverage. |
| Market sizing and forecasting | The wine tourism outlook covers 2026 to 2036. Activity and age-group revenue shares describe 2025. |
| Data validation | Trip-spend statistics and winery-revenue data are kept distinct from market-size estimates. Regional growth rates are not assumed for countries without a published rate. |
Wine Tourism Market by Segments
Wine Tourism Market segmented by Activity Type:
- Winery Visits and Tasting
- Wine Trails
- Wine Festivals and Events
- Wine Education and Workshops
- Other Activities
Wine Tourism Market segmented by Age Group:
- Less than 20 years
- 20-30 years
- 30-40 years
- 40-50 years
- Over 50 years
Wine Tourism Market segmented by Demography:
- Men
- Women
Wine Tourism Market segmented by Tourism Type:
- Domestic Tourists
- International Tourists
Wine Tourism Market segmented by Tour Type:
- Individual
- Group
Wine Tourism Market by Region:
- North America
- United States
- Canada
- Latin America
- Brazil
- Argentina
- Chile
- Western Europe
- France
- Germany
- Italy
- Spain
- United Kingdom
- Portugal
- Benelux
- Nordics
- Eastern Europe
- Bulgaria
- Romania
- Hungary
- Poland
- East Asia
- China
- Japan
- South Korea
- South Asia and Pacific
- India
- Australia
- New Zealand
- ASEAN
- Middle East and Africa
- South Africa
- GCC Countries
- Türkiye
- Israel
Research Sources and Bibliography
- [1] Wine Industry Advisor, 17 April 2026: “Constellation Opens Transformed Robert Mondavi Estate In Oakville” (wineindustryadvisor.com); Drinks-Intel.com, April 2026: “Constellation Brands reopens Robert Mondavi Winery to visitors.”
- [2] Delaire Graff Estate official website (delaire.co.za): “Delaire Graff Estate re-opens – A Jewel Re-Imagined,” 1 October 2025; Wesgro.co.za: “New and Renovated Wine Estates to Explore in the Western Cape: 2025–2026
- [3] Vinetur.com, 20 May 2026: “Sherrymaster by Tío Pepe vuelve a Jerez en septiembre” (vinetur.com/amp/20260520101038); González Byass official communications confirmed via gonzalezbyass.com/en-gb/wine-tourism
- [4] Atout France. (2025, February). L’œnotourisme en France en pleine croissance: 12 millions de visiteurs en 2023.
- [5] Tourism Research Australia, Australian Trade and Investment Commission. (2025, October update). Agritourism in Australia: Wineries in 2024 fact sheet.
- [6] Visit Napa Valley. (2026, September 28). Visit Napa Valley 2026 Destination Symposium Highlights Tourism’s Role as an Economic Driver.
- [7] Government of Maharashtra, Department of Tourism. Nashik: Wineries and wine-tourism attractions.
- [8] Ningxia Hui Autonomous Region Development and Reform Commission. (2025, June 3). Development of the Ningxia wine industry and visitor infrastructure.
- [9] Korea Tourism Organization. (2026). Korea Wine Festival in Yeongdong and Yeongdong Wine Tunnel visitor information.
- [10] Great Wine Capitals Global Network. (2025, November 7). Global 2026 Best Of Wine Tourism Award Winners Announced in Bordeaux.
- [11] Great Wine Capitals Global Network. (2023, June 1). Matetic Winery: An innovator at the forefront of sustainable wine tourism practices.
- [12] ENIT, Italian National Tourist Board. (2025, March 4). ENIT presents data on Italian tourism trends at ITB Berlin.
This Report Answers
- How large is the wine tourism market in 2026 and what value is projected by 2036?
- What CAGR is forecast for the wine tourism market from 2026 to 2036?
- Which activity type leads market revenue in 2025?
- Which age group accounts for the largest stated revenue share in 2025?
- How do individual and group wine tours differ?
- What supports winery visits and tasting revenue?
- Which profiled markets have the highest country CAGRs?
- What limits growth in wine regions?
- Which companies participate in the wine tourism market?
Table of Content
- Key Takeaways
- Market Size and CAGR
- Top Growth Driver
- Fastest Growing Segment
- Leading Region
- Key Companies
- Emerging Opportunities
- Executive Summary
- Global Market Outlook
- Demand-side Trends
- Supply-side Trends
- Technology Roadmap Analysis
- Analysis and Recommendations
- Analyst Perspective (What is happening? Why now? What should investors know?)
- Key Questions Answered
- How large is the market?
- What is the CAGR?
- What are key trends?
- Which region dominates?
- Who are the leaders?
Read More...
- Market Overview
- Market Coverage / Taxonomy
- Market Definition / Scope / Limitations
- Research Methodology
- Chapter Orientation
- Analytical Lens and Working Hypotheses
- Market Structure, Signals, and Trend Drivers
- Benchmarking and Cross-market Comparability
- Market Sizing, Forecasting, and Opportunity Mapping
- Research Design and Evidence Framework
- Desk Research Programme (Secondary Evidence)
- Expert Input and Fieldwork (Primary Evidence)
- Tooling, Models, and Reference Databases
- Data Engineering and Model Build
- Quality Assurance and Audit Trail
- Market Background
- Market Dynamics (Drivers, Restraints, Opportunity, Trends)
- Scenario Forecast (Optimistic, Likely, Conservative)
- Impact Analysis
- AI Impact
- Sustainability Impact
- Regulatory Impact
- Technology Impact
- Consumer / Buyer Analysis
- Purchase Drivers
- Adoption Barriers
- Buyer Journey
- Opportunity Map Analysis
- Product Life Cycle Analysis
- Supply Chain Analysis
- Investment Feasibility Matrix
- Value Chain Analysis
- PESTLE and Porter's Analysis
- Regulatory Landscape
- Regional Parent Market Outlook
- Production and Consumption Statistics
- Import and Export Statistics
- Global Market Analysis and Forecast, 2021 to 2036
- Historical Market Size Value (USD Billion) Analysis, 2021 to 2025
- Current and Future Market Size Value (USD Billion) Projections, 2026 to 2036
- Y-o-Y Growth Trend Analysis
- Absolute $ Opportunity Analysis
- Global Market Pricing Analysis, 2021 to 2036
- Global Market Analysis and Forecast, By Activity Type, 2021 to 2036
- Introduction / Key Findings
- Historical Market Size Value (USD Billion) Analysis By Activity Type, 2021 to 2025
- Current and Future Market Size Value (USD Billion) Analysis and Forecast By Activity Type, 2026 to 2036
- Winery Visits and Tasting
- Wine Trails
- Wine Festivals and Events
- Wine Education and Workshops
- Other Activities
- Y-o-Y Growth Trend Analysis By Activity Type, 2021 to 2025
- Absolute $ Opportunity Analysis By Activity Type, 2026 to 2036
- Global Market Analysis and Forecast, By Age Group, 2021 to 2036
- Introduction / Key Findings
- Historical Market Size Value (USD Billion) Analysis By Age Group, 2021 to 2025
- Current and Future Market Size Value (USD Billion) Analysis and Forecast By Age Group, 2026 to 2036
- Less than 20 years
- 20-30 years
- 30-40 years
- 40-50 years
- Over 50 years
- Y-o-Y Growth Trend Analysis By Age Group, 2021 to 2025
- Absolute $ Opportunity Analysis By Age Group, 2026 to 2036
- Global Market Analysis and Forecast, By Demography, 2021 to 2036
- Introduction / Key Findings
- Historical Market Size Value (USD Billion) Analysis By Demography, 2021 to 2025
- Current and Future Market Size Value (USD Billion) Analysis and Forecast By Demography, 2026 to 2036
- Men
- Women
- Y-o-Y Growth Trend Analysis By Demography, 2021 to 2025
- Absolute $ Opportunity Analysis By Demography, 2026 to 2036
- Global Market Analysis and Forecast, By Tourism Type, 2021 to 2036
- Introduction / Key Findings
- Historical Market Size Value (USD Billion) Analysis By Tourism Type, 2021 to 2025
- Current and Future Market Size Value (USD Billion) Analysis and Forecast By Tourism Type, 2026 to 2036
- Domestic Tourists
- International Tourists
- Y-o-Y Growth Trend Analysis By Tourism Type, 2021 to 2025
- Absolute $ Opportunity Analysis By Tourism Type, 2026 to 2036
- Global Market Analysis and Forecast, By Tour Type, 2021 to 2036
- Introduction / Key Findings
- Historical Market Size Value (USD Billion) Analysis By Tour Type, 2021 to 2025
- Current and Future Market Size Value (USD Billion) Analysis and Forecast By Tour Type, 2026 to 2036
- Individual
- Group
- Y-o-Y Growth Trend Analysis By Tour Type, 2021 to 2025
- Absolute $ Opportunity Analysis By Tour Type, 2026 to 2036
- Global Market Analysis and Forecast, By Region, 2021 to 2036
- Introduction
- Historical Market Size Value (USD Billion) Analysis By Region, 2021 to 2025
- Current Market Size Value (USD Billion) Analysis and Forecast By Region, 2026 to 2036
- North America
- Latin America
- Western Europe
- Eastern Europe
- East Asia
- South Asia and Pacific
- Middle East and Africa
- Market Attractiveness Analysis By Region
- North America Market Analysis and Forecast, By Country, 2021 to 2036
- Historical Market Size Value (USD Billion) Trend Analysis By Market Taxonomy, 2021 to 2025
- Market Size Value (USD Billion) Forecast By Market Taxonomy, 2026 to 2036
- By Country
- United States
- Canada
- By Activity Type
- By Age Group
- By Demography
- By Tourism Type
- By Tour Type
- By Country
- Market Attractiveness Analysis
- By Country
- By Activity Type
- By Age Group
- By Demography
- By Tourism Type
- By Tour Type
- Key Takeaways
- Latin America Market Analysis and Forecast, By Country
- Historical Market Size Value (USD Billion) Trend Analysis By Market Taxonomy, 2021 to 2025
- Market Size Value (USD Billion) Forecast By Market Taxonomy, 2026 to 2036
- By Country
- Brazil
- Argentina
- Chile
- By Activity Type
- By Age Group
- By Demography
- By Tourism Type
- By Tour Type
- By Country
- Market Attractiveness Analysis
- By Country
- By Activity Type
- By Age Group
- By Demography
- By Tourism Type
- By Tour Type
- Key Takeaways
- Western Europe Market Analysis and Forecast, By Country
- Historical Market Size Value (USD Billion) Trend Analysis By Market Taxonomy, 2021 to 2025
- Market Size Value (USD Billion) Forecast By Market Taxonomy, 2026 to 2036
- By Country
- France
- Germany
- Italy
- Spain
- United Kingdom
- Portugal
- Benelux
- Nordics
- By Activity Type
- By Age Group
- By Demography
- By Tourism Type
- By Tour Type
- By Country
- Market Attractiveness Analysis
- By Country
- By Activity Type
- By Age Group
- By Demography
- By Tourism Type
- By Tour Type
- Key Takeaways
- Eastern Europe Market Analysis and Forecast, By Country
- Historical Market Size Value (USD Billion) Trend Analysis By Market Taxonomy, 2021 to 2025
- Market Size Value (USD Billion) Forecast By Market Taxonomy, 2026 to 2036
- By Country
- Bulgaria
- Romania
- Hungary
- Poland
- By Activity Type
- By Age Group
- By Demography
- By Tourism Type
- By Tour Type
- By Country
- Market Attractiveness Analysis
- By Country
- By Activity Type
- By Age Group
- By Demography
- By Tourism Type
- By Tour Type
- Key Takeaways
- East Asia Market Analysis and Forecast, By Country
- Historical Market Size Value (USD Billion) Trend Analysis By Market Taxonomy, 2021 to 2025
- Market Size Value (USD Billion) Forecast By Market Taxonomy, 2026 to 2036
- By Country
- China
- Japan
- South Korea
- By Activity Type
- By Age Group
- By Demography
- By Tourism Type
- By Tour Type
- By Country
- Market Attractiveness Analysis
- By Country
- By Activity Type
- By Age Group
- By Demography
- By Tourism Type
- By Tour Type
- Key Takeaways
- South Asia and Pacific Market Analysis and Forecast, By Country
- Historical Market Size Value (USD Billion) Trend Analysis By Market Taxonomy, 2021 to 2025
- Market Size Value (USD Billion) Forecast By Market Taxonomy, 2026 to 2036
- By Country
- India
- Australia
- New Zealand
- ASEAN
- By Activity Type
- By Age Group
- By Demography
- By Tourism Type
- By Tour Type
- By Country
- Market Attractiveness Analysis
- By Country
- By Activity Type
- By Age Group
- By Demography
- By Tourism Type
- By Tour Type
- Key Takeaways
- Middle East and Africa Market Analysis and Forecast, By Country
- Historical Market Size Value (USD Billion) Trend Analysis By Market Taxonomy, 2021 to 2025
- Market Size Value (USD Billion) Forecast By Market Taxonomy, 2026 to 2036
- By Country
- South Africa
- GCC Countries
- Türkiye
- Israel
- By Activity Type
- By Age Group
- By Demography
- By Tourism Type
- By Tour Type
- By Country
- Market Attractiveness Analysis
- By Country
- By Activity Type
- By Age Group
- By Demography
- By Tourism Type
- By Tour Type
- Key Takeaways
- Key Countries Market Analysis
- United States
- Pricing Analysis
- Market Share Analysis, 2025
- By Activity Type
- By Age Group
- By Demography
- By Tourism Type
- By Tour Type
- Canada
- Pricing Analysis
- Market Share Analysis, 2025
- By Activity Type
- By Age Group
- By Demography
- By Tourism Type
- By Tour Type
- Brazil
- Pricing Analysis
- Market Share Analysis, 2025
- By Activity Type
- By Age Group
- By Demography
- By Tourism Type
- By Tour Type
- Chile
- Pricing Analysis
- Market Share Analysis, 2025
- By Activity Type
- By Age Group
- By Demography
- By Tourism Type
- By Tour Type
- Germany
- Pricing Analysis
- Market Share Analysis, 2025
- By Activity Type
- By Age Group
- By Demography
- By Tourism Type
- By Tour Type
- United Kingdom
- Pricing Analysis
- Market Share Analysis, 2025
- By Activity Type
- By Age Group
- By Demography
- By Tourism Type
- By Tour Type
- Italy
- Pricing Analysis
- Market Share Analysis, 2025
- By Activity Type
- By Age Group
- By Demography
- By Tourism Type
- By Tour Type
- Spain
- Pricing Analysis
- Market Share Analysis, 2025
- By Activity Type
- By Age Group
- By Demography
- By Tourism Type
- By Tour Type
- France
- Pricing Analysis
- Market Share Analysis, 2025
- By Activity Type
- By Age Group
- By Demography
- By Tourism Type
- By Tour Type
- India
- Pricing Analysis
- Market Share Analysis, 2025
- By Activity Type
- By Age Group
- By Demography
- By Tourism Type
- By Tour Type
- ASEAN
- Pricing Analysis
- Market Share Analysis, 2025
- By Activity Type
- By Age Group
- By Demography
- By Tourism Type
- By Tour Type
- China
- Pricing Analysis
- Market Share Analysis, 2025
- By Activity Type
- By Age Group
- By Demography
- By Tourism Type
- By Tour Type
- Japan
- Pricing Analysis
- Market Share Analysis, 2025
- By Activity Type
- By Age Group
- By Demography
- By Tourism Type
- By Tour Type
- South Korea
- Pricing Analysis
- Market Share Analysis, 2025
- By Activity Type
- By Age Group
- By Demography
- By Tourism Type
- By Tour Type
- Poland
- Pricing Analysis
- Market Share Analysis, 2025
- By Activity Type
- By Age Group
- By Demography
- By Tourism Type
- By Tour Type
- Hungary
- Pricing Analysis
- Market Share Analysis, 2025
- By Activity Type
- By Age Group
- By Demography
- By Tourism Type
- By Tour Type
- Türkiye
- Pricing Analysis
- Market Share Analysis, 2025
- By Activity Type
- By Age Group
- By Demography
- By Tourism Type
- By Tour Type
- South Africa
- Pricing Analysis
- Market Share Analysis, 2025
- By Activity Type
- By Age Group
- By Demography
- By Tourism Type
- By Tour Type
- Australia–New Zealand (combined)
- Pricing Analysis
- Market Share Analysis, 2025
- By Activity Type
- By Age Group
- By Demography
- By Tourism Type
- By Tour Type
- United States
- Market Structure Analysis
- Competition Dashboard
- Competition Benchmarking
- Market Share Analysis of Top Players
- By Regional
- By Activity Type
- By Age Group
- By Demography
- By Tourism Type
- By Tour Type
- Emerging Startups
- Innovation Benchmarking
- Competition Analysis
- Competition Deep Dive
- BKWine Tours
- Overview
- Product Portfolio
- Profitability by Market Segments
- Sales Footprint
- Strategy Overview
- Marketing Strategy
- Product Strategy
- Channel Strategy
- Gourmet Touring
- González Byass
- Villa Melnik Winery
- Vergelegen Estate
- CVNE
- Viña Matetic
- Napa Valley Wine Train
- Delaire Graff Estate
- Robert Mondavi Winery
- Compañía Vinícola del Norte de España (CVNE)
- BKWine Tours
- Case Studies
- Success Stories
- Recent Developments
- Competition Deep Dive
- Assumptions & Acronyms Used
List of Tables
- Table 1: Global Market Value (USD Billion) Forecast by Region, 2021 to 2036
- Table 2: Global Market Value (USD Billion) Forecast by Activity Type, 2021 to 2036
- Table 3: Global Market Value (USD Billion) Forecast by Age Group, 2021 to 2036
- Table 4: Global Market Value (USD Billion) Forecast by Demography, 2021 to 2036
- Table 5: Global Market Value (USD Billion) Forecast by Tourism Type, 2021 to 2036
- Table 6: Global Market Value (USD Billion) Forecast by Tour Type, 2021 to 2036
- Table 7: North America Market Value (USD Billion) Forecast by Country, 2021 to 2036
- Table 8: North America Market Value (USD Billion) Forecast by Activity Type, 2021 to 2036
- Table 9: North America Market Value (USD Billion) Forecast by Age Group, 2021 to 2036
- Table 10: North America Market Value (USD Billion) Forecast by Demography, 2021 to 2036
- Table 11: North America Market Value (USD Billion) Forecast by Tourism Type, 2021 to 2036
- Table 12: North America Market Value (USD Billion) Forecast by Tour Type, 2021 to 2036
- Table 13: Latin America Market Value (USD Billion) Forecast by Country, 2021 to 2036
- Table 14: Latin America Market Value (USD Billion) Forecast by Activity Type, 2021 to 2036
- Table 15: Latin America Market Value (USD Billion) Forecast by Age Group, 2021 to 2036
- Table 16: Latin America Market Value (USD Billion) Forecast by Demography, 2021 to 2036
- Table 17: Latin America Market Value (USD Billion) Forecast by Tourism Type, 2021 to 2036
- Table 18: Latin America Market Value (USD Billion) Forecast by Tour Type, 2021 to 2036
- Table 19: Western Europe Market Value (USD Billion) Forecast by Country, 2021 to 2036
- Table 20: Western Europe Market Value (USD Billion) Forecast by Activity Type, 2021 to 2036
- Table 21: Western Europe Market Value (USD Billion) Forecast by Age Group, 2021 to 2036
- Table 22: Western Europe Market Value (USD Billion) Forecast by Demography, 2021 to 2036
- Table 23: Western Europe Market Value (USD Billion) Forecast by Tourism Type, 2021 to 2036
- Table 24: Western Europe Market Value (USD Billion) Forecast by Tour Type, 2021 to 2036
- Table 25: Eastern Europe Market Value (USD Billion) Forecast by Country, 2021 to 2036
- Table 26: Eastern Europe Market Value (USD Billion) Forecast by Activity Type, 2021 to 2036
- Table 27: Eastern Europe Market Value (USD Billion) Forecast by Age Group, 2021 to 2036
- Table 28: Eastern Europe Market Value (USD Billion) Forecast by Demography, 2021 to 2036
- Table 29: Eastern Europe Market Value (USD Billion) Forecast by Tourism Type, 2021 to 2036
- Table 30: Eastern Europe Market Value (USD Billion) Forecast by Tour Type, 2021 to 2036
- Table 31: East Asia Market Value (USD Billion) Forecast by Country, 2021 to 2036
- Table 32: East Asia Market Value (USD Billion) Forecast by Activity Type, 2021 to 2036
- Table 33: East Asia Market Value (USD Billion) Forecast by Age Group, 2021 to 2036
- Table 34: East Asia Market Value (USD Billion) Forecast by Demography, 2021 to 2036
- Table 35: East Asia Market Value (USD Billion) Forecast by Tourism Type, 2021 to 2036
- Table 36: East Asia Market Value (USD Billion) Forecast by Tour Type, 2021 to 2036
- Table 37: South Asia and Pacific Market Value (USD Billion) Forecast by Country, 2021 to 2036
- Table 38: South Asia and Pacific Market Value (USD Billion) Forecast by Activity Type, 2021 to 2036
- Table 39: South Asia and Pacific Market Value (USD Billion) Forecast by Age Group, 2021 to 2036
- Table 40: South Asia and Pacific Market Value (USD Billion) Forecast by Demography, 2021 to 2036
- Table 41: South Asia and Pacific Market Value (USD Billion) Forecast by Tourism Type, 2021 to 2036
- Table 42: South Asia and Pacific Market Value (USD Billion) Forecast by Tour Type, 2021 to 2036
- Table 43: Middle East and Africa Market Value (USD Billion) Forecast by Country, 2021 to 2036
- Table 44: Middle East and Africa Market Value (USD Billion) Forecast by Activity Type, 2021 to 2036
- Table 45: Middle East and Africa Market Value (USD Billion) Forecast by Age Group, 2021 to 2036
- Table 46: Middle East and Africa Market Value (USD Billion) Forecast by Demography, 2021 to 2036
- Table 47: Middle East and Africa Market Value (USD Billion) Forecast by Tourism Type, 2021 to 2036
- Table 48: Middle East and Africa Market Value (USD Billion) Forecast by Tour Type, 2021 to 2036
List of Figures
- Figure 1: Global Market Pricing Analysis
- Figure 2: Global Market Value (USD Billion) Forecast 2021-2036
- Figure 3: Global Market Value Share and BPS Analysis by Activity Type, 2026 and 2036
- Figure 4: Global Market Y-o-Y Growth Comparison by Activity Type, 2026-2036
- Figure 5: Global Market Attractiveness Analysis by Activity Type
- Figure 6: Global Market Value Share and BPS Analysis by Age Group, 2026 and 2036
- Figure 7: Global Market Y-o-Y Growth Comparison by Age Group, 2026-2036
- Figure 8: Global Market Attractiveness Analysis by Age Group
- Figure 9: Global Market Value Share and BPS Analysis by Demography, 2026 and 2036
- Figure 10: Global Market Y-o-Y Growth Comparison by Demography, 2026-2036
- Figure 11: Global Market Attractiveness Analysis by Demography
- Figure 12: Global Market Value Share and BPS Analysis by Tourism Type, 2026 and 2036
- Figure 13: Global Market Y-o-Y Growth Comparison by Tourism Type, 2026-2036
- Figure 14: Global Market Attractiveness Analysis by Tourism Type
- Figure 15: Global Market Value Share and BPS Analysis by Tour Type, 2026 and 2036
- Figure 16: Global Market Y-o-Y Growth Comparison by Tour Type, 2026-2036
- Figure 17: Global Market Attractiveness Analysis by Tour Type
- Figure 18: Global Market Value (USD Billion) Share and BPS Analysis by Region, 2026 and 2036
- Figure 19: Global Market Y-o-Y Growth Comparison by Region, 2026-2036
- Figure 20: Global Market Attractiveness Analysis by Region
- Figure 21: North America Market Incremental Dollar Opportunity, 2026-2036
- Figure 22: Latin America Market Incremental Dollar Opportunity, 2026-2036
- Figure 23: Western Europe Market Incremental Dollar Opportunity, 2026-2036
- Figure 24: Eastern Europe Market Incremental Dollar Opportunity, 2026-2036
- Figure 25: East Asia Market Incremental Dollar Opportunity, 2026-2036
- Figure 26: South Asia and Pacific Market Incremental Dollar Opportunity, 2026-2036
- Figure 27: Middle East and Africa Market Incremental Dollar Opportunity, 2026-2036
- Figure 28: North America Market Value Share and BPS Analysis by Country, 2026 and 2036
- Figure 29: North America Market Value Share and BPS Analysis by Activity Type, 2026 and 2036
- Figure 30: North America Market Y-o-Y Growth Comparison by Activity Type, 2026-2036
- Figure 31: North America Market Attractiveness Analysis by Activity Type
- Figure 32: North America Market Value Share and BPS Analysis by Age Group, 2026 and 2036
- Figure 33: North America Market Y-o-Y Growth Comparison by Age Group, 2026-2036
- Figure 34: North America Market Attractiveness Analysis by Age Group
- Figure 35: North America Market Value Share and BPS Analysis by Demography, 2026 and 2036
- Figure 36: North America Market Y-o-Y Growth Comparison by Demography, 2026-2036
- Figure 37: North America Market Attractiveness Analysis by Demography
- Figure 38: North America Market Value Share and BPS Analysis by Tourism Type, 2026 and 2036
- Figure 39: North America Market Y-o-Y Growth Comparison by Tourism Type, 2026-2036
- Figure 40: North America Market Attractiveness Analysis by Tourism Type
- Figure 41: North America Market Value Share and BPS Analysis by Tour Type, 2026 and 2036
- Figure 42: North America Market Y-o-Y Growth Comparison by Tour Type, 2026-2036
- Figure 43: North America Market Attractiveness Analysis by Tour Type
- Figure 44: Latin America Market Value Share and BPS Analysis by Country, 2026 and 2036
- Figure 45: Latin America Market Value Share and BPS Analysis by Activity Type, 2026 and 2036
- Figure 46: Latin America Market Y-o-Y Growth Comparison by Activity Type, 2026-2036
- Figure 47: Latin America Market Attractiveness Analysis by Activity Type
- Figure 48: Latin America Market Value Share and BPS Analysis by Age Group, 2026 and 2036
- Figure 49: Latin America Market Y-o-Y Growth Comparison by Age Group, 2026-2036
- Figure 50: Latin America Market Attractiveness Analysis by Age Group
- Figure 51: Latin America Market Value Share and BPS Analysis by Demography, 2026 and 2036
- Figure 52: Latin America Market Y-o-Y Growth Comparison by Demography, 2026-2036
- Figure 53: Latin America Market Attractiveness Analysis by Demography
- Figure 54: Latin America Market Value Share and BPS Analysis by Tourism Type, 2026 and 2036
- Figure 55: Latin America Market Y-o-Y Growth Comparison by Tourism Type, 2026-2036
- Figure 56: Latin America Market Attractiveness Analysis by Tourism Type
- Figure 57: Latin America Market Value Share and BPS Analysis by Tour Type, 2026 and 2036
- Figure 58: Latin America Market Y-o-Y Growth Comparison by Tour Type, 2026-2036
- Figure 59: Latin America Market Attractiveness Analysis by Tour Type
- Figure 60: Western Europe Market Value Share and BPS Analysis by Country, 2026 and 2036
- Figure 61: Western Europe Market Value Share and BPS Analysis by Activity Type, 2026 and 2036
- Figure 62: Western Europe Market Y-o-Y Growth Comparison by Activity Type, 2026-2036
- Figure 63: Western Europe Market Attractiveness Analysis by Activity Type
- Figure 64: Western Europe Market Value Share and BPS Analysis by Age Group, 2026 and 2036
- Figure 65: Western Europe Market Y-o-Y Growth Comparison by Age Group, 2026-2036
- Figure 66: Western Europe Market Attractiveness Analysis by Age Group
- Figure 67: Western Europe Market Value Share and BPS Analysis by Demography, 2026 and 2036
- Figure 68: Western Europe Market Y-o-Y Growth Comparison by Demography, 2026-2036
- Figure 69: Western Europe Market Attractiveness Analysis by Demography
- Figure 70: Western Europe Market Value Share and BPS Analysis by Tourism Type, 2026 and 2036
- Figure 71: Western Europe Market Y-o-Y Growth Comparison by Tourism Type, 2026-2036
- Figure 72: Western Europe Market Attractiveness Analysis by Tourism Type
- Figure 73: Western Europe Market Value Share and BPS Analysis by Tour Type, 2026 and 2036
- Figure 74: Western Europe Market Y-o-Y Growth Comparison by Tour Type, 2026-2036
- Figure 75: Western Europe Market Attractiveness Analysis by Tour Type
- Figure 76: Eastern Europe Market Value Share and BPS Analysis by Country, 2026 and 2036
- Figure 77: Eastern Europe Market Value Share and BPS Analysis by Activity Type, 2026 and 2036
- Figure 78: Eastern Europe Market Y-o-Y Growth Comparison by Activity Type, 2026-2036
- Figure 79: Eastern Europe Market Attractiveness Analysis by Activity Type
- Figure 80: Eastern Europe Market Value Share and BPS Analysis by Age Group, 2026 and 2036
- Figure 81: Eastern Europe Market Y-o-Y Growth Comparison by Age Group, 2026-2036
- Figure 82: Eastern Europe Market Attractiveness Analysis by Age Group
- Figure 83: Eastern Europe Market Value Share and BPS Analysis by Demography, 2026 and 2036
- Figure 84: Eastern Europe Market Y-o-Y Growth Comparison by Demography, 2026-2036
- Figure 85: Eastern Europe Market Attractiveness Analysis by Demography
- Figure 86: Eastern Europe Market Value Share and BPS Analysis by Tourism Type, 2026 and 2036
- Figure 87: Eastern Europe Market Y-o-Y Growth Comparison by Tourism Type, 2026-2036
- Figure 88: Eastern Europe Market Attractiveness Analysis by Tourism Type
- Figure 89: Eastern Europe Market Value Share and BPS Analysis by Tour Type, 2026 and 2036
- Figure 90: Eastern Europe Market Y-o-Y Growth Comparison by Tour Type, 2026-2036
- Figure 91: Eastern Europe Market Attractiveness Analysis by Tour Type
- Figure 92: East Asia Market Value Share and BPS Analysis by Country, 2026 and 2036
- Figure 93: East Asia Market Value Share and BPS Analysis by Activity Type, 2026 and 2036
- Figure 94: East Asia Market Y-o-Y Growth Comparison by Activity Type, 2026-2036
- Figure 95: East Asia Market Attractiveness Analysis by Activity Type
- Figure 96: East Asia Market Value Share and BPS Analysis by Age Group, 2026 and 2036
- Figure 97: East Asia Market Y-o-Y Growth Comparison by Age Group, 2026-2036
- Figure 98: East Asia Market Attractiveness Analysis by Age Group
- Figure 99: East Asia Market Value Share and BPS Analysis by Demography, 2026 and 2036
- Figure 100: East Asia Market Y-o-Y Growth Comparison by Demography, 2026-2036
- Figure 101: East Asia Market Attractiveness Analysis by Demography
- Figure 102: East Asia Market Value Share and BPS Analysis by Tourism Type, 2026 and 2036
- Figure 103: East Asia Market Y-o-Y Growth Comparison by Tourism Type, 2026-2036
- Figure 104: East Asia Market Attractiveness Analysis by Tourism Type
- Figure 105: East Asia Market Value Share and BPS Analysis by Tour Type, 2026 and 2036
- Figure 106: East Asia Market Y-o-Y Growth Comparison by Tour Type, 2026-2036
- Figure 107: East Asia Market Attractiveness Analysis by Tour Type
- Figure 108: South Asia and Pacific Market Value Share and BPS Analysis by Country, 2026 and 2036
- Figure 109: South Asia and Pacific Market Value Share and BPS Analysis by Activity Type, 2026 and 2036
- Figure 110: South Asia and Pacific Market Y-o-Y Growth Comparison by Activity Type, 2026-2036
- Figure 111: South Asia and Pacific Market Attractiveness Analysis by Activity Type
- Figure 112: South Asia and Pacific Market Value Share and BPS Analysis by Age Group, 2026 and 2036
- Figure 113: South Asia and Pacific Market Y-o-Y Growth Comparison by Age Group, 2026-2036
- Figure 114: South Asia and Pacific Market Attractiveness Analysis by Age Group
- Figure 115: South Asia and Pacific Market Value Share and BPS Analysis by Demography, 2026 and 2036
- Figure 116: South Asia and Pacific Market Y-o-Y Growth Comparison by Demography, 2026-2036
- Figure 117: South Asia and Pacific Market Attractiveness Analysis by Demography
- Figure 118: South Asia and Pacific Market Value Share and BPS Analysis by Tourism Type, 2026 and 2036
- Figure 119: South Asia and Pacific Market Y-o-Y Growth Comparison by Tourism Type, 2026-2036
- Figure 120: South Asia and Pacific Market Attractiveness Analysis by Tourism Type
- Figure 121: South Asia and Pacific Market Value Share and BPS Analysis by Tour Type, 2026 and 2036
- Figure 122: South Asia and Pacific Market Y-o-Y Growth Comparison by Tour Type, 2026-2036
- Figure 123: South Asia and Pacific Market Attractiveness Analysis by Tour Type
- Figure 124: Middle East and Africa Market Value Share and BPS Analysis by Country, 2026 and 2036
- Figure 125: Middle East and Africa Market Value Share and BPS Analysis by Activity Type, 2026 and 2036
- Figure 126: Middle East and Africa Market Y-o-Y Growth Comparison by Activity Type, 2026-2036
- Figure 127: Middle East and Africa Market Attractiveness Analysis by Activity Type
- Figure 128: Middle East and Africa Market Value Share and BPS Analysis by Age Group, 2026 and 2036
- Figure 129: Middle East and Africa Market Y-o-Y Growth Comparison by Age Group, 2026-2036
- Figure 130: Middle East and Africa Market Attractiveness Analysis by Age Group
- Figure 131: Middle East and Africa Market Value Share and BPS Analysis by Demography, 2026 and 2036
- Figure 132: Middle East and Africa Market Y-o-Y Growth Comparison by Demography, 2026-2036
- Figure 133: Middle East and Africa Market Attractiveness Analysis by Demography
- Figure 134: Middle East and Africa Market Value Share and BPS Analysis by Tourism Type, 2026 and 2036
- Figure 135: Middle East and Africa Market Y-o-Y Growth Comparison by Tourism Type, 2026-2036
- Figure 136: Middle East and Africa Market Attractiveness Analysis by Tourism Type
- Figure 137: Middle East and Africa Market Value Share and BPS Analysis by Tour Type, 2026 and 2036
- Figure 138: Middle East and Africa Market Y-o-Y Growth Comparison by Tour Type, 2026-2036
- Figure 139: Middle East and Africa Market Attractiveness Analysis by Tour Type
- Figure 140: Global Market - Tier Structure Analysis
- Figure 141: Global Market - Company Share Analysis
Frequently Asked Questions
How large is the wine tourism market in 2026?
The wine tourism market is estimated at USD 122.1 Billion in 2026 and forecast at USD 404.1 Billion by 2036. [1]
What CAGR is expected in the wine tourism market through 2036?
The wine tourism market is projected to grow at a 12.7% CAGR between 2026 and 2036. The forecast covers winery visits, tastings, and other travel experiences linked to wine regions. [1]
Which activity type led the wine tourism market in 2025?
Winery visits and tastings held 38.7% of activity-type revenue in 2025. They are a central paid experience offered by wineries. [1]
Which age group held a notable market share in 2025?
Travelers aged 30–40 accounted for 26.8% of revenue by age group in 2025. The figure measures spending across those categories. [1]
Which country has the highest stated growth rate?
India has the highest CAGR among the five profiled markets at 5.7% from 2026 to 2036. China follows at 5.4% and South Korea at 5.2%. [1]
Who are the prominent companies in the wine tourism market?
Notable participants include BKWine Tours, Gourmet Touring, González Byass, Villa Melnik Winery, Vergelegen Estate, CVNE, Viña Matetic, Napa Valley Wine Train, Delaire Graff Estate, and Robert Mondavi Winery.
Preview the report firsthand - request a free sample
Get SampleGet the brochure for pricing and purchase details.
Get PDF
