

- Market Size (2026)
- USD 4.4 Bn
- Forecast (2036)
- USD 6.9 Bn
- CAGR (2026 to 2036)
- 4.6%
Yeast Market Size, Market Forecast and Outlook By FMI
The yeast market was valued at USD 4.2 billion in 2025. The market is set to reach USD 4.4 billion by 2026-end and expand at a CAGR of 4.6% between 2026 and 2036 to reach USD 6.9 billion by 2036. Baker Yeast is anticipated to lead with a 39.1% product share. Fresh Yeast is forecast to lead the form segment with a 38.0% share.
Summary of the Yeast Market
- Demand and Growth Drivers
- Bakery production needs reinforce demand for yeast as industrial bread makers require predictable proofing and dough strength.
- Beverage fermentation lifts strain-specific yeast use as brewers and wineries require controlled flavor and batch repeatability.
- Biofuel fermentation adds industrial volume as ethanol producers require yeast strains with stable sugar conversion performance.
- Product and Segment View
- Baker Yeast is expected to lead the product segment with 39.1% share in 2026, reflecting its central role in bread production.
- Fresh Yeast is expected to lead the form segment with 38.0% share in 2026, reflecting faster activity in industrial bakery lines.
- Saccharomyces Cerevisiae is expected to hold high-value strain use as bakery and brewing users require proven fermentation behavior.
- Geography and Competitive Outlook
- China is expected to record a CAGR of 5.9% through 2036 as bakery and fermentation capacity expand.
- India is projected to expand at 5.5% CAGR through 2036 as food processing and ethanol programs increase yeast use.
- Companies combining strain development with large fermentation capacity are protecting their market position during the forecast period.
- Analyst Opinion
- Nandini Roy Choudhury, Associate Vice President at FMI says, “Yeast acts as a process control ingredient for industrial fermentation users managing output consistency across production cycles. Food processors and ethanol producers need stable performance with dependable supply across planned production schedules. Cost pressure comes from feedstock prices and logistics expenses across high-volume yeast production. Manufacturer selection should assess strain capability and technical service depth before long-term contracts are finalized.”
- Yeast Market Value Analysis
- The yeast market is forecast to move from USD 4.4 billion in 2026 to USD 6.9 billion by 2036.
- Baker Yeast leads as bread manufacturers need steady leavening performance across daily production cycles.
- Food and Beverages is the largest demand base as bakery and brewing use yeast at high volume.
- Direct sales carry more weight as industrial buyers require planned supply and technical contact.
- Feed and biofuel applications create price pressure as buyers compare yeast cost with process yield.
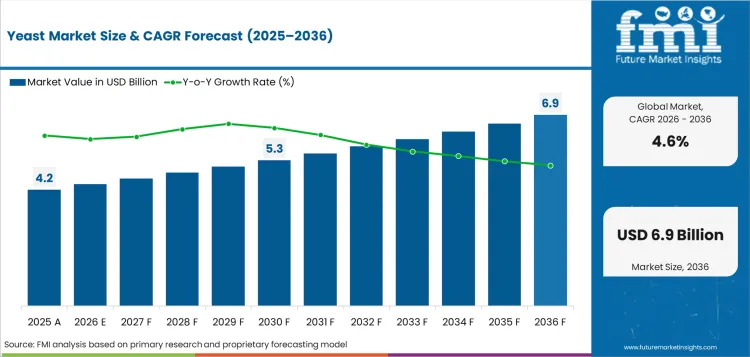
Key Takeaways, Market Size, and Forecast
| Metric | Value |
|---|---|
| Market Size (2025) | USD 4.2 Billion |
| Market Size (2036) | USD 6.9 Billion |
| CAGR (2026–2036) | 4.6% |
| Incremental Opportunity (2026–2036) | USD 2.5 Billion |
| Leading Product (2026) | Baker Yeast |
| Baker Yeast Share (2026) | 39.1% |
| Fastest-Growing Country | China |
| China CAGR | 5.9% |
| 2nd Fastest-Growing Country | India |
| India CAGR | 5.5% |
Yeast demand is being shaped by both core bakery use and higher-value flavor applications. dsm-firmenich stated in October 2024 that it completed the sale of its yeast extract business to Lesaffre. The transfer of 46 employees strengthens Lesaffre’s savory ingredient depth. AB Mauri's parent company stated in November 2024 that AB Mauri delivered higher sales in yeast and bakery ingredients. Ingredients operating profit increased 12%. That shows bakery yeast remains a stable commercial anchor. Biospringer stated in August 2024 that yeast extracts can reduce sugar by 20% in sweet soy sauce applications.
Taste improvement and sugar reduction create new formulation value beyond fermentation. AB Mauri's parent company also states that yeast and specialty ingredients serve food, nutrition, feed, and pharmaceutical markets. Application diversity is likely to help yeast suppliers reduce dependence on one end-use category. Biospringer’s sensory application panel adds another signal that customer support is becoming central to yeast-derived ingredient sales.
Yeast Market Definition
The yeast market includes commercial yeast products cultivated for leavening and fermentation. These products serve nutrition and industrial conversion. Products covered include baker yeast and brewer yeast. They include wine yeast, feed yeast, industrial yeast, and specialty yeast. The scope excludes finished bakery products and alcoholic drinks. It excludes animal feed blends, ethanol fuel, and retail food products containing yeast.
Yeast Market Inclusions
Market scope covers commercially traded yeast products by product type, form, distribution channel, strain, and application. Product type includes baker yeast, brewer yeast, wine yeast, feed yeast, bioethanol and industrial yeast, and specialty yeast products. Form includes fresh yeast, dry yeast, and liquid yeast. Distribution channel includes direct sales, indirect sales, and retail channels. Strain includes Saccharomyces cerevisiae and non-Saccharomyces strains. Applications include food and beverages, animal feed, biofuel production, and pharmaceutical and biotechnology uses. Revenue scope covers 2026 to 2036. The main participants include yeast manufacturers, fermentation technology providers, bakery manufacturers, breweries, wineries, animal feed producers, ethanol plants, pharmaceutical companies, nutraceutical producers, ingredient distributors, research institutes and regulatory bodies. Industrial fermentation users are included as a separate buyer group.
Yeast Market Exclusions
Scope does not include finished bread, beer, wine, complete feed, ethanol fuel, molasses, or sugar. Packaged food products that use yeast as an ingredient are excluded.
Yeast Market Research Methodology
- Primary Research: FMI analysts talked to bakery manufacturers, beverage producers, feed ingredient users, ethanol producers, and yeast distributors in major markets.
- Desk Research: FMI combined data from food production statistics, fermentation references, company product portfolios, and ingredient supply-chain records.
- Market sizing and forecasting: Built yeast use across bakery, beverage, feed, biofuel, and specialty applications from the bottom up.
- Data validation: Cross-checked every three months against application demand, country-level production signals, and company portfolio coverage.
Why is the Yeast Market Growing?
- Industrial bakeries are using yeast to control dough rise and reduce batch variation across high-volume production.
- Breweries are selecting yeast strains to manage flavor output and alcohol yield across repeat production runs.
- Feed producers are using yeast products for animal nutrition programs with digestibility and gut-health claims.
Rising bakery demand is enabling yeast suppliers a steady base across mature and developing markets. FAO forecast global cereal production at 3,036 million tonnes in 2025. This volume gives flour millers and bakery users a broad raw material base for yeast-led production. This cereal base keeps bread and bakery manufacturing supplied during normal crop cycles. Demand for dry yeast is strongest in accounts needing longer storage and easier transport. Suppliers with reliable activity control can protect contracts across bakery plants.
Industrial fermentation adds another demand layer beyond bakery use. India reported 16.23% ethanol blending as of December 2024 and more than 17,400 E20 outlets under its ethanol program. The fuel blending program increases the need for stable fermentation inputs in grain and molasses-based ethanol production. Yeast suppliers serving bioethanol producers must focus on strain tolerance and sugar conversion. Associated demand in brewer's yeast and yeast extract reflects higher fermentation use.
Market Segmentation Analysis
- Baker Yeast is projected to capture 39.1% of product value in 2026 as bread producers need dependable leavening across routine production.
- Fresh Yeast is anticipated to represent 38.0% of form sales in 2026, supported by fast activity needs in industrial bakeries.
- Direct Sales are expected to hold 52.0% of distribution share in 2026 as large-volume buyers prefer planned supply and technical contact.
- Saccharomyces Cerevisiae is forecast to make up 71.0% of strain use in 2026 since food processors value predictable fermentation behavior.
- Food and Beverages are estimated to lead application revenue at 64.0% in 2026, reflecting broad yeast use across bakery and beverage production.
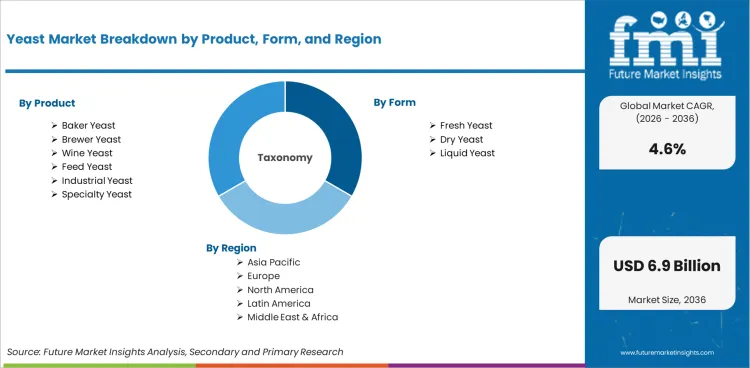
The yeast market is divided into five primary segment groups based on product, form, distribution channel, strain, and application. Product includes Baker Yeast, Brewer Yeast, Wine Yeast, Feed Yeast, Industrial Yeast, and Specialty Yeast. Form includes Fresh Yeast, Dry Yeast, and Liquid Yeast. Distribution Channel includes Direct Sales, Indirect Sales, and Retail Channels. Strain includes Saccharomyces Cerevisiae and Non Saccharomyces Strains. Application includes Food and Beverages, Animal Feed, Biofuel Production, and Pharmaceutical and Biotechnology.
Insights into the Baker Yeast Product Segment
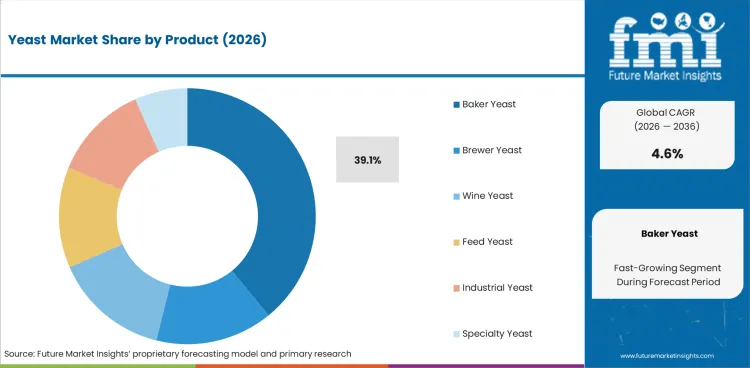
- In 2026, Baker Yeast is expected to make up 39.1% of the product segment within the global market. Bread manufacturers need dependable leavening performance across packaged bread and routine bakery production.
- Brewer Yeast and Wine Yeast serve selected fermentation needs across beverage production. Their value improves in applications requiring flavor control and repeatable alcohol yield.
Insights into the Fresh Yeast Form Segment
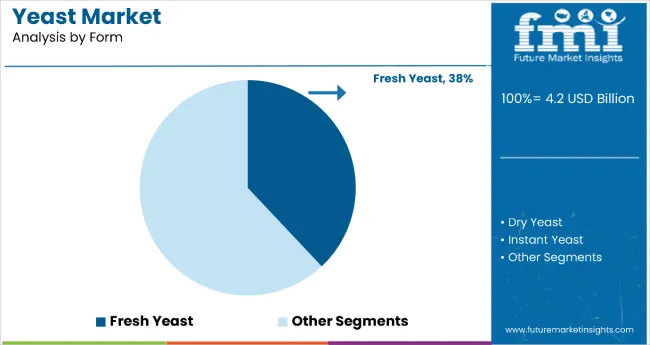
- Fresh Yeast is projected to account for 38.0% of the form segment in 2026. Industrial bakeries prefer fresh formats for faster activity and consistent dough development.
- Dry Yeast addresses storage-sensitive and long-distance supply needs across bakery and retail channels. Liquid Yeast supports selected beverage and industrial fermentation users.
Insights into the Direct Sales Distribution Channel Segment
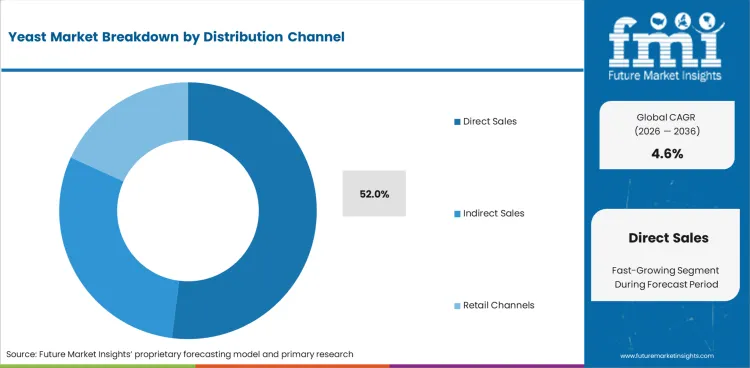
- In 2026, Direct Sales are estimated to represent a 52.0% share of the distribution channel segment. Large bakery and beverage producers prefer direct sourcing for supply planning and quality control.
- Indirect Sales serves smaller buyers requiring distributor access and flexible order volumes. Retail channels serve home baking and small commercial users with packaged yeast formats.
Insights into the Saccharomyces Cerevisiae Strain Segment
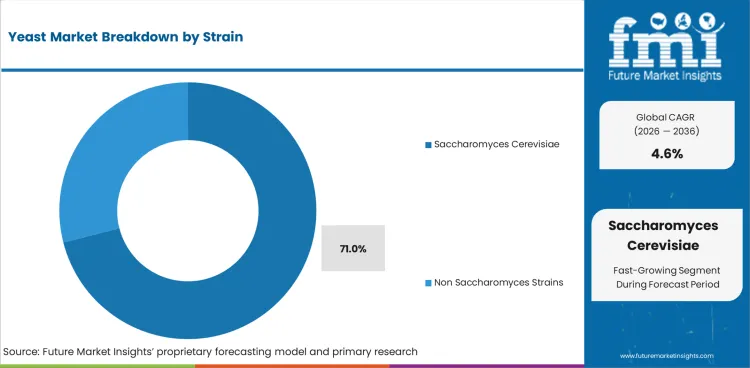
- In 2026, Saccharomyces Cerevisiae is forecast to hold 71.0% of the strain segment. Food processors prefer this strain for proven fermentation behavior across bakery and beverage applications.
- Non-Saccharomyces Strains address selective fermentation needs in specialty beverage and biotechnology applications. Their value improves when aroma profile or strain performance guides buyer choice.
Insights into the Food and Beverages Application Segment
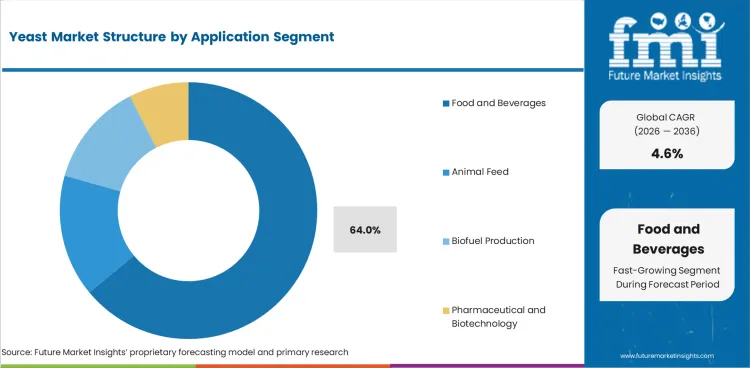
- Food and Beverages are projected to account for 64.0% of the application segment in 2026. Bakery and beverage producers use yeast as a core production input for volume manufacturing.
- Animal Feed and Biofuel Production create additional demand outside mainstream food use. Feed users value yeast nutrition benefits while ethanol producers focus on fermentation yield.
Yeast Market Drivers, Restraints, and Opportunities
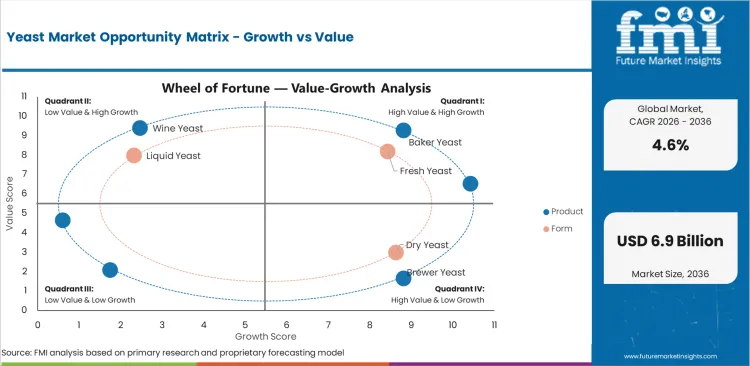
- Bakery proofing needs lead to a structured demand for yeast across bread and pastry production.
- Beverage fermentation raises demand for strain-specific yeast with controlled flavor and alcohol output.
- High energy and feedstock costs add pricing pressure for smaller yeast producers.
Yeast products for bakery and beverage applications keep rising. Industrial fermentation applications rise as producers need stable leavening and predictable batch performance across daily production. Cost pressure from molasses energy and logistics can slow the use of premium yeast formats. Expansion continues through dry yeast specialty strains and ethanol fermentation applications.
Molasses Tightness Keeps Fermentation Costs Sticky
Yeast pricing is being pulled by carbohydrate economics instead of only packaging or distribution. USDA ERS reported in April 2026 that USA 2025/26 beet sugar production was lowered by 33,000 STRV to 5.060 million STRV, over 300,000 STRV or 6% below the previous year. USDA ERS linked the change to larger sugarbeet pile shrink and lower sucrose recovery, only partly offset by more sugar from desugared molasses. For baker’s yeast and yeast extract producers, this matters because molasses and sugar streams shape fermentation substrate availability. The pricing signal is reduced supplier willingness to absorb raw-material volatility in annual contracts. Buyers should expect firmer cost pass-through language in industrial yeast supply agreements.
Brewing Yeast Faces Volume-Led Price Discipline
Brewer’s yeast pricing is facing a different pressure: weaker batch volumes reduce replenishment frequency and make small-lot supply less efficient. In April 2026, the Brewers Association reported total USA craft production of 21,859,000 barrels fell 5% in 2025, while 60% of breweries reported declines. For yeast suppliers serving breweries, this shifts the market away from volume-led pricing power. Suppliers may protect margins by setting minimum order quantities and applying strain banking fees. Suppliers may add expedited shipping charges or reduce price concessions for seasonal strains. This approach avoids relying only on headline price increases to sustain profitability. Breweries should negotiate yeast procurement based on forecast accuracy and reuse protocols. Breweries should focus on inventory planning rather than only evaluating the per-pack price.
Analysis of Yeast Market By Key Countries
.webp "Top Country Growth Comparison Yeast Market Cagr (2026 2036)")
| Country | CAGR |
|---|---|
| China | 5.9% |
| India | 5.5% |
| Germany | 5.0% |
| Brazil | 4.6% |
| USA | 4.2% |
| UK | 3.7% |
| Japan | 3.3% |
Source: Future Market Insights, 2026.
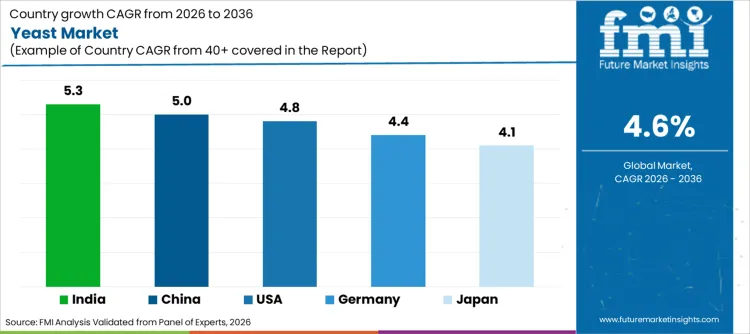
Yeast Market CAGR Analysis By Country
- China leads with a 5.9% CAGR through 2036 as bakery and packaged food production expand.
- India is projected to record 5.5% CAGR as food processing capacity expands and ethanol fermentation gains a larger role in domestic production.
- Germany’s yeast market is expected to grow at 5.0% CAGR during the assessment period, supported by bakery depth and beer production requirements.
- Brazil is forecast to advance at 4.6% CAGR, with ethanol fermentation creating steady demand alongside food processing use.
- USA demand is expected to grow at 4.2% CAGR between 2026 and 2036 as mature bakery production keeps yeast consumption stable across large buyers.
- UK yeast sales are projected to rise at 3.7% CAGR, reflecting bakery demand under stronger cost control pressure.
- Japan is forecast at 3.3% CAGR over the forecast years, supported by stable bakery use and selective beverage fermentation demand.
Demand for yeast is forecast to rise at 4.6% CAGR from 2026 to 2036. Country-level analysis covers the countries contributing to this forecast. The listed markets appear below.
Demand Outlook for Yeast Market in China
China’s yeast industry is projected to record a CAGR of 5.9% through 2036. China’s large grain production base gives yeast manufacturers stronger supply conditions for bakery and fermentation applications. Food processors and industrial fermentation users benefit from a broad raw material base that sustains yeast use across bread production and other fermentation-led processes. Local producers gain from packaged bakery expansion and industrial fermentation needs. Yeast suppliers with larger capacity and application service can protect share across food plants.
- Local grain supply helps bakery manufacturers plan yeast buying across large production runs.
- Packaged food plants require reliable fermentation inputs for bread and processed bakery products.
- Industrial fermentation users create additional demand for strains with stable sugar conversion.
Sales Analysis of Yeast Market in India
India’s yeast sector is expected to expand at a CAGR of 5.5% during the assessment period. India achieved 15% ethanol blending in 2024 and targeted 20% blending by 2025. This fuel program supports yeast demand in India across grain and molasses fermentation. Bakery demand adds a second base as urban packaged food channels expand. Suppliers serving bakeries and ethanol producers can improve account depth.
- Bakery manufacturers need yeast with predictable proofing across packaged bread and bun production.
- Ethanol plants require fermentation strains to protect yield across feedstock changes.
- Food processors benefit from suppliers offering dry formats with stronger storage performance.
Demand Outlook for Yeast Market in Germany
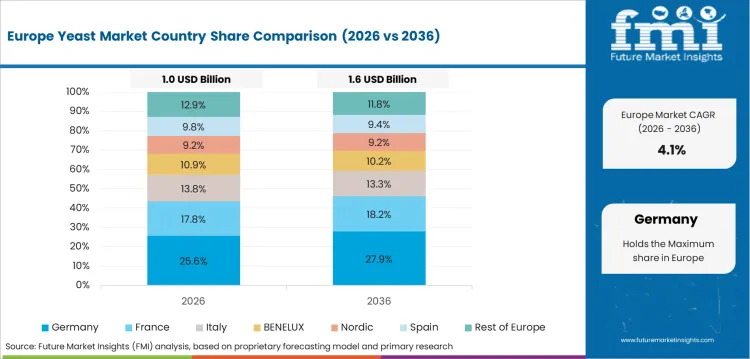
The Germany yeast industry is forecast to grow at a CAGR of 5.0% by 2036. Eurostat reported Germany produced 7.2 billion litres of beer with over 0.5% alcohol in 2024. This made Germany the largest EU beer producer with 22.2% of total EU production. Brewing scale reinforces demand for brewer yeast and technical strain service. Bakery demand remains relevant across industrial bread and specialty formats.
- Breweries need yeast strains to protect flavor output and repeat fermentation performance.
- Bakery producers maintain steady yeast buying through bread and specialty bakery production.
- Ingredient suppliers with technical support can benefit from mature but specification-heavy demand.
Opportunity Analysis of Yeast Market in Brazil
The yeast segment in Brazil is forecast to advance at 4.6% CAGR over the forecast years. Brazil’s fermentation base is shaped by sugarcane and corn ethanol production. USDA FAS estimated total cellulosic ethanol production at 51 million liters in 2024. This output supports yeast demand in Brazil in industrial fermentation alongside food processing. Suppliers must match strain performance with ethanol yield and plant operating conditions.
- Ethanol producers need yeast strains that tolerate variable sugar streams and process stress.
- Bakery demand adds routine volume across retail bread and industrial baked goods.
- Industrial users favor suppliers with fermentation troubleshooting and local supply reliability.
Future Outlook for Yeast Market in the United States
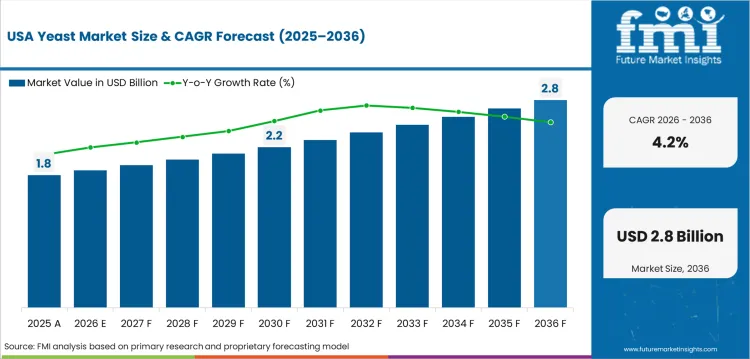
The USA yeast industry is expected to post 4.2% CAGR through 2036. USA flour milling capacity gives yeast suppliers a large bakery-facing customer base. USDA reported whole wheat flour production of 4.40 million hundredweight during the fourth quarter of 2025. This flour output supports yeast demand across bread and bakery manufacturing. Suppliers with reliable dry yeast and fresh yeast logistics can protect recurring orders.
- Industrial bakeries need activity consistency across high-volume flour-based production.
- Ethanol producers add fermentation demand through grain-based biofuel manufacturing.
- Retail and foodservice buyers create channel demand for convenient yeast formats.
Demand Outlook for Yeast Market in the UK
The UK yeast industry is projected to record 3.7% CAGR through 2036. UK manufacturing data show beer made from malt increased by GBP 793 million in 2024 to GBP 5.4 billion. Bakery demand remains relevant. Cost pressure limits premium uptake among smaller producers. Suppliers with stable quality and flexible delivery can retain key accounts.
- Breweries require fermentation strains suited to repeat beer styles and batch control.
- Bakeries need dependable yeast activity as ingredient and labor costs pressure margins.
- Distributors remain relevant for smaller buyers who cannot contract directly with manufacturers.
In-depth Analysis of Yeast Market in Japan
Japan’s yeast industry is expected to post 3.3% CAGR through 2036. Japan’s liquor export activity provides a data point for fermentation-linked demand. National Tax Agency data show Japan-produced liquor exports reached JPY 133.7 billion in 2024. Beverage producers need reliable yeast strains for sake and beer production processes. Wine and other fermented drink producers require consistent strains for manufacturing quality. Mature food demand keeps growth moderate compared with China and India.
- Beverage producers need strain consistency for controlled aroma and alcohol output.
- Bakery demand is stable as packaged bread and convenience channels keep routine yeast use.
- Premium applications favor suppliers with technical documentation and strong quality control.
Competitive Landscape and Strategic Positioning
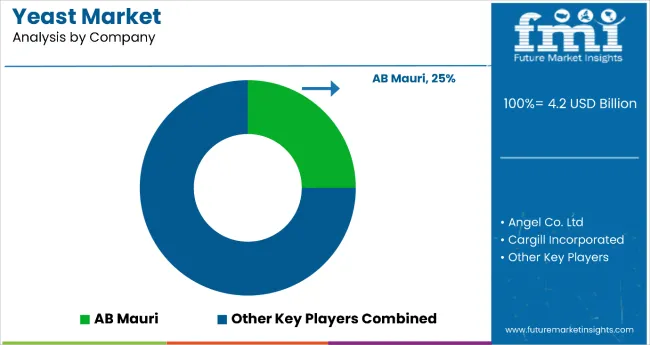
- Lesaffre Group leads through broad strain depth and bakery application coverage across large industrial accounts.
- Angel Yeast Co., Ltd. and Lallemand Inc. compete on fermentation scale and product range across food and feed uses.
- Specialist providers concentrate on nutrition yeast and brewer yeast formats for buyers with specific formulation needs.
Competition in the yeast market centers on strain performance and application reach across bakery and fermentation users. Lesaffre Group holds a leading position through integrated yeast production and bakery service depth. Angel Yeast Co., Ltd. brings large fermentation capacity and broad product coverage across food and feed uses. Lallemand Inc. maintains its position through brewing expertise and nutritional yeast capability across selected industrial applications. AB Mauri serves bakery customers through ingredient networks and established buyer access.
Competitive pressure is shaped by feedstock cost and energy use across large fermentation operations. Strain performance affects supplier selection across industrial accounts with strict process requirements. Application service and dry yeast stability remain priorities for long-distance supply. Buyers favor suppliers offering fermentation reliability and practical guidance during product changeovers. Companies with broader yeast portfolios and dependable customer service are better placed to secure repeat business.
Key Companies in the Yeast Market
Global companies active in the yeast market include:
- Lesaffre Group, Angel Yeast Co., Ltd., and Lallemand Inc. operate large fermentation infrastructure for strain development and international service delivery.
- AB Mauri, Oriental Yeast India Pvt. Ltd., and Ohly GmbH serve manufacturers through bakery ingredient coverage, yeast extracts, and direct customer relationships.
- Novonesis A/S, Kerry Group plc, Leiber GmbH, and Kothari Fermentation and Biochem Ltd. hold specialist roles across food ingredients and functional yeast applications.
Competitive Benchmarking: Yeast Market
| Company | Strain Portfolio Depth | Bakery Application Reach | Fermentation Scale | Geographic Footprint |
|---|---|---|---|---|
| Lesaffre Group | High | High | Strong | Global |
| Angel Yeast Co., Ltd. | High | High | Strong | Global with strong Asia base |
| Lallemand Inc. | High | Medium | Strong | Global |
| Ohly GmbH | Medium | High | Strong | Global |
| AB Mauri | Medium | High | Strong | Global |
| Oriental Yeast India Pvt. Ltd. | Medium | High | Moderate | India and Asia focused |
| Novonesis A/S | High | Medium | Strong | Global |
| Kerry Group plc | Medium | Medium | Strong | Global |
| Kothari Fermentation and Biochem Ltd. | High | Medium | Strong | Global |
| Leiber GmbH | Medium | Medium | Moderate | Europe with export reach |
Source: Future Market Insights, 2026.
Key Developments in Yeast Market
- In August 2025, Angel Yeast began material feeding for an 8,500-ton specialty yeast facility in Baiyang Biotechnology Park.
- In July 2025, Lallemand announced the acquisition of Solyve through its Bio-Ingredients business unit.
Key Players in the Yeast Market
Major Global Players:
- Lesaffre Group
- Angel Yeast Co., Ltd.
- Lallemand Inc.
- Ohly GmbH
- AB Mauri
- Oriental Yeast India Pvt. Ltd.
- Novonesis A/S
- Kerry Group plc
- Leiber GmbH
- Kothari Fermentation and Biochem Ltd.
Report Scope and Coverage
| Parameter | Details |
|---|---|
| Quantitative Units | USD 4.4 billion to USD 6.9 billion, at a CAGR of 4.6% |
| Market Definition | The yeast market encompasses commercial yeast products used for leavening, fermentation, nutrition, and industrial conversion. |
| Regions Covered | North America, Latin America, Western Europe, Eastern Europe, East Asia, South Asia and Pacific, Middle East and Africa |
| Countries Covered | USA, UK, Germany, China, India, Japan, South Korea, Brazil, and 30 plus countries |
| Key Companies Profiled | Lesaffre Group, Angel Yeast Co., Ltd., Lallemand Inc., AB Mauri, Oriental Yeast India Pvt. Ltd., Novonesis A/S, Kerry Group plc, Ohly GmbH, Leiber GmbH, Kothari Fermentation and Biochem Ltd. |
| Forecast Period | 2026 to 2036 |
| Approach | Hybrid bottom-up and top-down methodology starting with yeast use across food, beverage, feed, and industrial fermentation demand. |
Source: Future Market Insights, 2026.
Yeast Market by Segments
Yeast Market Segmented by Product:
- Baker Yeast
- Brewer Yeast
- Wine Yeast
- Feed Yeast
- Industrial Yeast
- Specialty Yeast
Yeast Market Segmented by Form:
- Fresh Yeast
- Dry Yeast
- Liquid Yeast
Yeast Market Segmented by Distribution Channel:
- Direct Sales
- Indirect Sales
- Retail Channels
Yeast Market Segmented by Strain:
- Saccharomyces Cerevisiae
- Non Saccharomyces Strains
Yeast Market Segmented by Application:
- Food and Beverages
- Animal Feed
- Biofuel Production
- Pharmaceutical and Biotechnology
Yeast Market by Region:
- North America
- USA
- Canada
- Mexico
- Latin America
- Brazil
- Chile
- Rest of Latin America
- Western Europe
- Germany
- UK
- Italy
- Spain
- France
- Rest of Western Europe
- Eastern Europe
- Russia
- Poland
- Hungary
- Rest of Eastern Europe
- East Asia
- China
- Japan
- South Korea
- South Asia and Pacific
- India
- ASEAN
- Australia & New Zealand
- Rest of South Asia and Pacific
- Middle East and Africa
- Saudi Arabia
- Other GCC Countries
- South Africa
- Rest of Middle East and Africa
Research Sources and Bibliography
- USA Department of Agriculture, Economic Research Service. (2026, April 15). Sugar and sweeteners outlook: April 2026 (SSS-M-452).Sugar and Sweeteners Outlook: April 2026
- Brewers Association. (2026, April 14). A year of correction for craft beer, with early signals of recovery. A Year of Correction for Craft Beer, With Early Signals of Recovery - Brewers Association
- Food and Agriculture Organization of the United Nations. (2026, May). Cereal supply and demand brief. FAO
- Press Information Bureau. (2025, January 7). Year End Review 2024: Ministry of Petroleum and Natural Gas. Government of India.
- USA Department of Agriculture, National Agricultural Statistics Service. (2026, February). Flour Milling Products. USDA NASS.
- Press Information Bureau. (2024, October). Achieving 15% ethanol blending in 2024, India targets 20% by 2025. Government of India.
- Eurostat. (2025, August). Beer production increases to 34.7 billion litres. European Commission.
- USA Department of Agriculture, Foreign Agricultural Service. (2024, August). Biofuels Annual: Brazil. USDA FAS.
- Office for National Statistics. (2025, July). UK manufacturers’ sales by product: 2024. ONS.
- National Tax Agency. (2025, June). National Tax Agency Report 2025: Liquor Administration. Government of Japan.
This Report Answers
- What is the current and future size of the yeast market?
- How fast is the yeast market expected to expand between 2026 and 2036?
- Which product segment is expected to lead the market by 2026?
- Which form segment is expected to account for the highest demand by 2026?
- What factors are driving demand for yeast globally?
- How are bakery and beverage producers influencing yeast demand?
- Why is Saccharomyces Cerevisiae the main strain base for yeast users?
- How are biofuel programs creating demand for industrial yeast?
- Which countries are projected to record faster expansion through 2036?
- What is driving market expansion in China and India?
- Who are the key companies active in the yeast market?
- How does FMI estimate and validate the yeast market forecast?
Frequently Asked Questions
What is the global market demand for Yeast in 2026?
In 2026, the global market for yeast is expected to be worth USD 4.4 billion.
How big will the market for Yeast be in 2036?
By 2036, the market for yeast is expected to be worth USD 6.9 billion.
How much is demand for Yeast expected to expand between 2026 and 2036?
Between 2026 and 2036, demand for yeast is expected to expand at a CAGR of 4.6%.
Which product segment is expected to lead yeast sales globally by 2026?
Baker Yeast will make up 39.1% of the product segment in 2026.
What is causing yeast demand to rise in China?
The China yeast market is projected to record 5.9% CAGR through 2036, backed by bakery output and fermentation capacity.
What is causing yeast demand to rise in India?
The India yeast market is projected to expand at 5.5% CAGR through 2036, backed by food processing and ethanol fermentation.
What does this report mean by Yeast Market definition?
The yeast market includes commercial yeast products used for leavening, fermentation, feed nutrition, and industrial conversion.
How does FMI make the Yeast forecast and check it?
Forecasting models use a hybrid bottom-up and top-down approach, starting with application demand and checking it against country use patterns.
Preview the report firsthand - request a free sample
Get SampleGet the brochure for pricing and purchase details.
Get PDFTable of Content
- Executive Summary
- Global Market Outlook
- Demand-side Trends
- Supply-side Trends
- Technology Roadmap Analysis
- Analysis and Recommendations
- Market Overview
- Market Coverage / Taxonomy
- Market Definition / Scope / Limitations
- Research Methodology
- Chapter Orientation
- Analytical Lens and Working Hypotheses
- Market Structure, Signals, and Trend Drivers
- Benchmarking and Cross-market Comparability
- Market Sizing, Forecasting, and Opportunity Mapping
- Research Design and Evidence Framework
- Desk Research Programme (Secondary Evidence)
- Company Annual and Sustainability Reports
- Peer-reviewed Journals and Academic Literature
- Corporate Websites, Product Literature, and Technical Notes
- Earnings Decks and Investor Briefings
- Statutory Filings and Regulatory Disclosures
- Technical White Papers and Standards Notes
- Trade Journals, Industry Magazines, and Analyst Briefs
- Conference Proceedings, Webinars, and Seminar Materials
- Government Statistics Portals and Public Data Releases
- Press Releases and Reputable Media Coverage
- Specialist Newsletters and Curated Briefings
- Sector Databases and Reference Repositories
- FMI Internal Proprietary Databases and Historical Market Datasets
- Subscription Datasets and Paid Sources
- Social Channels, Communities, and Digital Listening Inputs
- Additional Desk Sources
- Expert Input and Fieldwork (Primary Evidence)
- Primary Modes
- Qualitative Interviews and Expert Elicitation
- Quantitative Surveys and Structured Data Capture
- Blended Approach
- Why Primary Evidence is Used
- Field Techniques
- Interviews
- Surveys
- Focus Groups
- Observational and In-context Research
- Social and Community Interactions
- Stakeholder Universe Engaged
- C-suite Leaders
- Board Members
- Presidents and Vice Presidents
- R&D and Innovation Heads
- Technical Specialists
- Domain Subject-matter Experts
- Scientists
- Physicians and Other Healthcare Professionals
- Governance, Ethics, and Data Stewardship
- Research Ethics
- Data Integrity and Handling
- Primary Modes
- Tooling, Models, and Reference Databases
- Desk Research Programme (Secondary Evidence)
- Data Engineering and Model Build
- Data Acquisition and Ingestion
- Cleaning, Normalisation, and Verification
- Synthesis, Triangulation, and Analysis
- Quality Assurance and Audit Trail
- Market Background
- Market Dynamics
- Drivers
- Restraints
- Opportunity
- Trends
- Scenario Forecast
- Demand in Optimistic Scenario
- Demand in Likely Scenario
- Demand in Conservative Scenario
- Opportunity Map Analysis
- Product Life Cycle Analysis
- Supply Chain Analysis
- Investment Feasibility Matrix
- Value Chain Analysis
- PESTLE and Porter’s Analysis
- Regulatory Landscape
- Regional Parent Market Outlook
- Production and Consumption Statistics
- Import and Export Statistics
- Market Dynamics
- Global Market Analysis 2021 to 2025 and Forecast, 2026 to 2036
- Historical Market Size Value (USD Million) Analysis, 2021 to 2025
- Current and Future Market Size Value (USD Million) Projections, 2026 to 2036
- Y-o-Y Growth Trend Analysis
- Absolute $ Opportunity Analysis
- Global Market Pricing Analysis 2021 to 2025 and Forecast 2026 to 2036
- Global Market Analysis 2021 to 2025 and Forecast 2026 to 2036, By Product
- Introduction / Key Findings
- Historical Market Size Value (USD Million) Analysis By Product , 2021 to 2025
- Current and Future Market Size Value (USD Million) Analysis and Forecast By Product , 2026 to 2036
- Baker Yeast
- Brewer Yeast
- Wine Yeast
- Feed Yeast
- Industrial Yeast
- Specialty Yeast
- Baker Yeast
- Y-o-Y Growth Trend Analysis By Product , 2021 to 2025
- Absolute $ Opportunity Analysis By Product , 2026 to 2036
- Global Market Analysis 2021 to 2025 and Forecast 2026 to 2036, By Form
- Introduction / Key Findings
- Historical Market Size Value (USD Million) Analysis By Form, 2021 to 2025
- Current and Future Market Size Value (USD Million) Analysis and Forecast By Form, 2026 to 2036
- Fresh Yeast
- Dry Yeast
- Liquid Yeast
- Fresh Yeast
- Y-o-Y Growth Trend Analysis By Form, 2021 to 2025
- Absolute $ Opportunity Analysis By Form, 2026 to 2036
- Global Market Analysis 2021 to 2025 and Forecast 2026 to 2036, By Distribution Channel
- Introduction / Key Findings
- Historical Market Size Value (USD Million) Analysis By Distribution Channel, 2021 to 2025
- Current and Future Market Size Value (USD Million) Analysis and Forecast By Distribution Channel, 2026 to 2036
- Direct Sales
- Indirect Sales
- Retail Channels
- Direct Sales
- Y-o-Y Growth Trend Analysis By Distribution Channel, 2021 to 2025
- Absolute $ Opportunity Analysis By Distribution Channel, 2026 to 2036
- Global Market Analysis 2021 to 2025 and Forecast 2026 to 2036, By Strain
- Introduction / Key Findings
- Historical Market Size Value (USD Million) Analysis By Strain, 2021 to 2025
- Current and Future Market Size Value (USD Million) Analysis and Forecast By Strain, 2026 to 2036
- Saccharomyces Cerevisiae
- Non Saccharomyces Strains
- Saccharomyces Cerevisiae
- Y-o-Y Growth Trend Analysis By Strain, 2021 to 2025
- Absolute $ Opportunity Analysis By Strain, 2026 to 2036
- Global Market Analysis 2021 to 2025 and Forecast 2026 to 2036, By Application
- Introduction / Key Findings
- Historical Market Size Value (USD Million) Analysis By Application, 2021 to 2025
- Current and Future Market Size Value (USD Million) Analysis and Forecast By Application, 2026 to 2036
- Food and Beverages
- Animal Feed
- Biofuel Production
- Pharmaceutical and Biotechnology
- Food and Beverages
- Y-o-Y Growth Trend Analysis By Application, 2021 to 2025
- Absolute $ Opportunity Analysis By Application, 2026 to 2036
- Global Market Analysis 2021 to 2025 and Forecast 2026 to 2036, By Region
- Introduction
- Historical Market Size Value (USD Million) Analysis By Region, 2021 to 2025
- Current Market Size Value (USD Million) Analysis and Forecast By Region, 2026 to 2036
- North America
- Latin America
- Western Europe
- Eastern Europe
- East Asia
- South Asia and Pacific
- Middle East & Africa
- Market Attractiveness Analysis By Region
- North America Market Analysis 2021 to 2025 and Forecast 2026 to 2036, By Country
- Historical Market Size Value (USD Million) Trend Analysis By Market Taxonomy, 2021 to 2025
- Market Size Value (USD Million) Forecast By Market Taxonomy, 2026 to 2036
- By Country
- USA
- Canada
- Mexico
- By Product
- By Form
- By Distribution Channel
- By Strain
- By Application
- By Country
- Market Attractiveness Analysis
- By Country
- By Product
- By Form
- By Distribution Channel
- By Strain
- By Application
- Key Takeaways
- Latin America Market Analysis 2021 to 2025 and Forecast 2026 to 2036, By Country
- Historical Market Size Value (USD Million) Trend Analysis By Market Taxonomy, 2021 to 2025
- Market Size Value (USD Million) Forecast By Market Taxonomy, 2026 to 2036
- By Country
- Brazil
- Chile
- Rest of Latin America
- By Product
- By Form
- By Distribution Channel
- By Strain
- By Application
- By Country
- Market Attractiveness Analysis
- By Country
- By Product
- By Form
- By Distribution Channel
- By Strain
- By Application
- Key Takeaways
- Western Europe Market Analysis 2021 to 2025 and Forecast 2026 to 2036, By Country
- Historical Market Size Value (USD Million) Trend Analysis By Market Taxonomy, 2021 to 2025
- Market Size Value (USD Million) Forecast By Market Taxonomy, 2026 to 2036
- By Country
- Germany
- UK
- Italy
- Spain
- France
- Nordic
- BENELUX
- Rest of Western Europe
- By Product
- By Form
- By Distribution Channel
- By Strain
- By Application
- By Country
- Market Attractiveness Analysis
- By Country
- By Product
- By Form
- By Distribution Channel
- By Strain
- By Application
- Key Takeaways
- Eastern Europe Market Analysis 2021 to 2025 and Forecast 2026 to 2036, By Country
- Historical Market Size Value (USD Million) Trend Analysis By Market Taxonomy, 2021 to 2025
- Market Size Value (USD Million) Forecast By Market Taxonomy, 2026 to 2036
- By Country
- Russia
- Poland
- Hungary
- Balkan & Baltic
- Rest of Eastern Europe
- By Product
- By Form
- By Distribution Channel
- By Strain
- By Application
- By Country
- Market Attractiveness Analysis
- By Country
- By Product
- By Form
- By Distribution Channel
- By Strain
- By Application
- Key Takeaways
- East Asia Market Analysis 2021 to 2025 and Forecast 2026 to 2036, By Country
- Historical Market Size Value (USD Million) Trend Analysis By Market Taxonomy, 2021 to 2025
- Market Size Value (USD Million) Forecast By Market Taxonomy, 2026 to 2036
- By Country
- China
- Japan
- South Korea
- By Product
- By Form
- By Distribution Channel
- By Strain
- By Application
- By Country
- Market Attractiveness Analysis
- By Country
- By Product
- By Form
- By Distribution Channel
- By Strain
- By Application
- Key Takeaways
- South Asia and Pacific Market Analysis 2021 to 2025 and Forecast 2026 to 2036, By Country
- Historical Market Size Value (USD Million) Trend Analysis By Market Taxonomy, 2021 to 2025
- Market Size Value (USD Million) Forecast By Market Taxonomy, 2026 to 2036
- By Country
- India
- ASEAN
- Australia & New Zealand
- Rest of South Asia and Pacific
- By Product
- By Form
- By Distribution Channel
- By Strain
- By Application
- By Country
- Market Attractiveness Analysis
- By Country
- By Product
- By Form
- By Distribution Channel
- By Strain
- By Application
- Key Takeaways
- Middle East & Africa Market Analysis 2021 to 2025 and Forecast 2026 to 2036, By Country
- Historical Market Size Value (USD Million) Trend Analysis By Market Taxonomy, 2021 to 2025
- Market Size Value (USD Million) Forecast By Market Taxonomy, 2026 to 2036
- By Country
- Kingdom of Saudi Arabia
- Other GCC Countries
- Turkiye
- South Africa
- Other African Union
- Rest of Middle East & Africa
- By Product
- By Form
- By Distribution Channel
- By Strain
- By Application
- By Country
- Market Attractiveness Analysis
- By Country
- By Product
- By Form
- By Distribution Channel
- By Strain
- By Application
- Key Takeaways
- Key Countries Market Analysis
- USA
- Pricing Analysis
- Market Share Analysis, 2025
- By Product
- By Form
- By Distribution Channel
- By Strain
- By Application
- Canada
- Pricing Analysis
- Market Share Analysis, 2025
- By Product
- By Form
- By Distribution Channel
- By Strain
- By Application
- Mexico
- Pricing Analysis
- Market Share Analysis, 2025
- By Product
- By Form
- By Distribution Channel
- By Strain
- By Application
- Brazil
- Pricing Analysis
- Market Share Analysis, 2025
- By Product
- By Form
- By Distribution Channel
- By Strain
- By Application
- Chile
- Pricing Analysis
- Market Share Analysis, 2025
- By Product
- By Form
- By Distribution Channel
- By Strain
- By Application
- Germany
- Pricing Analysis
- Market Share Analysis, 2025
- By Product
- By Form
- By Distribution Channel
- By Strain
- By Application
- UK
- Pricing Analysis
- Market Share Analysis, 2025
- By Product
- By Form
- By Distribution Channel
- By Strain
- By Application
- Italy
- Pricing Analysis
- Market Share Analysis, 2025
- By Product
- By Form
- By Distribution Channel
- By Strain
- By Application
- Spain
- Pricing Analysis
- Market Share Analysis, 2025
- By Product
- By Form
- By Distribution Channel
- By Strain
- By Application
- France
- Pricing Analysis
- Market Share Analysis, 2025
- By Product
- By Form
- By Distribution Channel
- By Strain
- By Application
- India
- Pricing Analysis
- Market Share Analysis, 2025
- By Product
- By Form
- By Distribution Channel
- By Strain
- By Application
- ASEAN
- Pricing Analysis
- Market Share Analysis, 2025
- By Product
- By Form
- By Distribution Channel
- By Strain
- By Application
- Australia & New Zealand
- Pricing Analysis
- Market Share Analysis, 2025
- By Product
- By Form
- By Distribution Channel
- By Strain
- By Application
- China
- Pricing Analysis
- Market Share Analysis, 2025
- By Product
- By Form
- By Distribution Channel
- By Strain
- By Application
- Japan
- Pricing Analysis
- Market Share Analysis, 2025
- By Product
- By Form
- By Distribution Channel
- By Strain
- By Application
- South Korea
- Pricing Analysis
- Market Share Analysis, 2025
- By Product
- By Form
- By Distribution Channel
- By Strain
- By Application
- Russia
- Pricing Analysis
- Market Share Analysis, 2025
- By Product
- By Form
- By Distribution Channel
- By Strain
- By Application
- Poland
- Pricing Analysis
- Market Share Analysis, 2025
- By Product
- By Form
- By Distribution Channel
- By Strain
- By Application
- Hungary
- Pricing Analysis
- Market Share Analysis, 2025
- By Product
- By Form
- By Distribution Channel
- By Strain
- By Application
- Kingdom of Saudi Arabia
- Pricing Analysis
- Market Share Analysis, 2025
- By Product
- By Form
- By Distribution Channel
- By Strain
- By Application
- Turkiye
- Pricing Analysis
- Market Share Analysis, 2025
- By Product
- By Form
- By Distribution Channel
- By Strain
- By Application
- South Africa
- Pricing Analysis
- Market Share Analysis, 2025
- By Product
- By Form
- By Distribution Channel
- By Strain
- By Application
- USA
- Market Structure Analysis
- Competition Dashboard
- Competition Benchmarking
- Market Share Analysis of Top Players
- By Regional
- By Product
- By Form
- By Distribution Channel
- By Strain
- By Application
- Competition Analysis
- Competition Deep Dive
- Lesaffre Group
- Overview
- Product Portfolio
- Profitability by Market Segments (Product/Age /Sales Channel/Region)
- Sales Footprint
- Strategy Overview
- Marketing Strategy
- Product Strategy
- Channel Strategy
- Angel Yeast Co., Ltd.
- Lallemand Inc.
- AB Mauri
- Oriental Yeast India Pvt. Ltd.
- Novonesis A/S
- Kerry Group plc
- Ohly GmbH
- Leiber GmbH
- Kothari Fermentation and Biochem Ltd.
- Lesaffre Group
- Competition Deep Dive
- Assumptions & Acronyms Used


