This site uses cookies, including third-party cookies, that help us to provide and improve our services.

Privacy Policy
- Global Locations -
Headquarters
Future Market Insights, Inc.
Christiana Corporate, 200 Continental Drive, Suite 401, Newark, Delaware - 19713, United States
T: +1-845-579-5705
MEA
Market Access DMCC

1602-6 Jumeirah Bay X2 Tower, Plot No: JLT-PH2-X2A,

Jumeirah Lakes Towers, Dubai,

United Arab Emirates

Americas
Future Market Insights
616 Corporate Way, Suite 2-9018,
Valley Cottage, NY 10989,
United States
T: +1-347-918-3531
Europe
Future Market Insights
3rd Floor, 207 Regent Street,
London W1B 3HH
United Kingdom
T: + 44 (0) 20 8123 9659
D: +44 (0) 20 3287 4268
APAC
Future Market Insights
Office No. 401-A, 4th Floor,
VANTAGE 9, S.No. 36/1/1,
Baner, Pune 411045 India

Accounts Payable Automation Market

Market Insights on Accounts Payable Automation covering sales outlook, demand forecast & up-to-date key trends

Accounts Payable Automation Market By Component, Deployment Type, Organization Size, Vertical & Region - Forecast 2022-2032

Accounts Payable Automation Market Outlook (2022-2032)

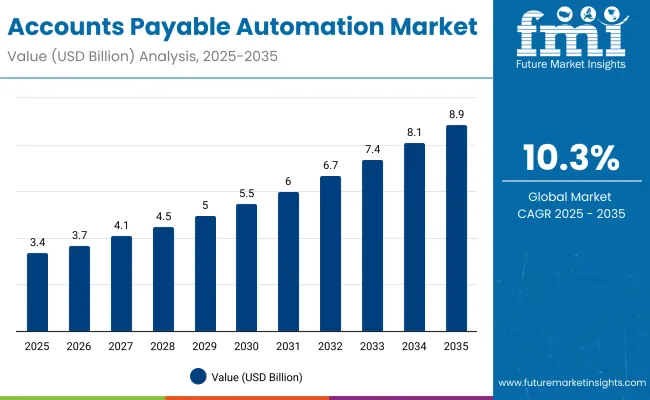
[299 Pages Report] The global accounts payable automation market size was valued at US$ 2.3 Billion in 2021 and is projected to grow at a compound annual growth rate of 10% in the forecast period of 2022 to 2032. The market is expected to reach US$ 2.6 Billion by 2022 and US$ 6.7 Billion by 2032.

Attributes

Details

Accounts Payable Automation Market CAGR (2022-2032)

10%

Accounts Payable Automation Market (2032)

US$ 6.7 Billion

Accounts Payable Automation Market Attraction

With 24/7 access to invoice status and real-time reporting capabilities, the AP automation software helps businesses make data-driven decisions for the growth of this market.

Furthermore, factors such as the ability to utilize AP automation solutions can enable enterprises to gain a greater level of visibility and control over their business operations, enabling AP departments to focus on more strategic tasks such as identifying more opportunities for cost reductions and facilitating their organizations' growth will be contributing to the growth of the Accounts Payable Automation Market.

“The widespread adoption of on-premises and cloud-based accounts payable solutions, both by small and large businesses, will further boost the prospects of accounts payable automation in upcoming years.”

An account payable (AP) automation solution refers to the technology that assists organizations in streamlining and automating the accounts payable process. An AP automation system makes the work easier by incorporating the easy processing of invoices from suppliers and implementing a digital workflow to facilitate every step in the process. In addition, AP automation can be applied to any software program or process that automates the entire accounts payable process by utilizing its background elements.

The use of technology is the main driver behind how businesses are carried out across the globe. Multiple industries such as finance are being impacted by this push for technological innovation. Developing a digital strategy for businesses is becoming a standard practice for companies in an ever-more technologically advanced world.

In any company, accounts payable is an integral part of its financial operations, which is responsible for ensuring that all of its obligations are handled appropriately. Traditionally performed through manual processes and paper documentation, digital solutions are facilitating evolution in this domain. Many companies have already developed and implemented software for automating a variety of tasks with great success, so it will only take a matter of time before more companies will adopt this implementation approach.

Customize this Report

Let us know your requirement to get
100% FREE customization

What are the Factors Driving the Growth of Accounts Payable Automation in the Market?

As a result of reducing fraudulent activities, accounting payables automation has become one of the best options for businesses wanting to mitigate their risk exposure in the market. The automation of business processes can further enhance the efficiency of the business by using technology in the process. An increasing need to reduce the amount of paper used for invoices and in order to be more environmentally friendly in the future, as well as a demand for accounts payable bill generations, should further boost the market for automated accounts payable processing.

Additionally, the upsurge of demand for faster payment processes and one-time payment methods will continue to stimulate growth of the accounts payable automation market in the near future. The federal government's initiatives to drive automation and digitalization are contributing to the increase in market growth for accounts payable automation in the market..

Business-to-business transactions are used by companies and businesses to pay suppliers and clients. In turn, this should help companies adhere to their purchasing policies in the market. All of these factors have led more companies to automate their accounts payable processes in the market. In order to improve the payment process and reduce the invoice processing time, the market for accounts payable automation is expected to grow at a rapid pace. Moreover, the increasing demand for companies to reduce the number of delays in completing their payments is also expected to increase the growth of the market.

One of the major factors driving the growth of this market is the growing need for controlled user access to reduce payments-related frauds. Developing automation platforms for accounts payable with the help of financial entities and banks has created a wide range of opportunities in the global market. Increasing market demand for AP automation has also been fueled by the increasing adoption of digitization and the growing need for error-free payment processes.

Accounts Payable Automation Market Download Report Brochure

What are the Challenges in the Market for Accounts Payable Automation?

Although organizations invest significant time and money in new technology, their accounts payable departments still face many challenges that result in high costs and inefficient processes. In the emerging economies, there is little understanding of the benefits of AP automation, as well as little awareness of the virtues of AP automation so this will act as a challenge to the market. The global accounts payable automation market is expected to be hindered by a lack of awareness about the digital world and literacy of the benefits of accounts payable automation in the emerging market during the forecast period.

This market growth is limited by increasing concerns over data encryption and security, which are among the major factors limiting the growth of this market. An insufficient number of skilled professionals and complicated software are keeping the market from growing. Growing numbers of non-standard invoicing, as well as a lack of specific structures information, have further contributed to the decline of this market's growth.

Comparative View of Accounts Payable Automation Market

Accounts Payable Automation Market:

Attributes

Accounts Payable Automation Market

CAGR (2022-2032)

10%

Market Value (2025)

US$ 2.6 Bn

Growth Factor

In order to stimulate growth, there is an increasing need to speed up the payment process and reduce the number of invoice processing times. This will stimulate the growth of the AP market.

Opportunity

New technologies such as ML and RPA are emerging to address time-consuming and repetitive tasks, opening up opportunities in the market.

Key Trends

As the market grows, paper invoice volumes will reduce, costs will be reduced, eco-friendly invoicing will become more prevalent, and workflow will be adopted more widely in the coming markets.

Solution Accounts Payable Automation Market:

Attributes

Solution Accounts Payable Automation Market

CAGR (2022-2032)

10%

Market Value (2025)

US$ 1.3 Bn

Growth Factor

AP automation solutions helps automate all payment processes since manual methods are time-consuming, expensive, and subject to error which is likely to grow the market for solutions in the market.

Opportunity

Despite the fact that ERPs integrate easily with them, they are a great solution for businesses. It will improve the ability to adapt to changes and increase the efficiency of the payment process which will provide an opportunity for vendors in the market to incorporate their solutions into the automation process of AP.

Key Trends

Data from invoices will play a significant role in providing end users with a more excellent experience for their business. AP automation solution providers are expected to increase their investments in AI and ML as a result of this transition from Accounts Payable to Business Intelligence Hub.

On-Premises Accounts Payable Automation Market:

Attributes

On-Premises Accounts Payable Automation Market

CAGR (2022-2032)

9.6%

Market Value (2025)

US$ 1.6 Bn

Growth Factor

Pre-installed servers in organizations with lucense to likely stimulate market growth for AP automation in the market.

Opportunity

To give an element of control over access and users, many vendors host all their applications on a dedicated server. Consequently, they are also responsible for implementing appropriate security measures. Implementation and maintenance of an information security system require in-house expertise and resources. This will further provide an opportunity for various clients on the market.

Key Trends

On-premises accounts payable automation will be used further for its marketability through industry-specific trends and regulations that monitor systems, create incidents procedures, and encrypt data. These trends will further provide a market for on-premises accounts payable automation.

With the introduction of robotic process automation, organizations will enjoy significant benefits from their Accounts Payable Automation, reducing transaction costs substantially and reducing errors at the accounts payable level. Invoice matching workflows can be done quickly and accurately with Accounts Payable Automation, removing any concern about fraud and ensuring that payments are not over or under the amount expected.

The trend of remote working has become increasingly prevalent across many industries in 2022, largely due to the worldwide lockdown. A growing number of companies are turning to remotely based or hybrid modes of working, and this is equally true in the realm of financial and AP-related industries. Companies have pushed for digitization which resulted in a time of flux where some parts of the business are digital and others aren't. Companies that are not ready for a fully digital landscape are vulnerable to data security breaches since cybercriminals will target them. Therefore, 2022 will be looking to push for strong security measures for companies ensuring that the AP team remains secure.

In the global digitization world, the U.S. region will remain the leading market for AP Automation. The continuous technological advancements and high investments in R&D by various companies in this region have driven the growth of accounts payable automation in the global market. Further fueled by growth in demand for digitization, faster payment methods, and secure electronic invoices, the accounts payable automation market continues to grow.

Sudip Saha
Sudip Saha
Principal Consultant
LinkedIn
Talk to Analyst

Find your sweet spots for generating winning opportunities in this market.

Talk to Analyst

What Component is likely to drive the Accounts Payable Automation Market?

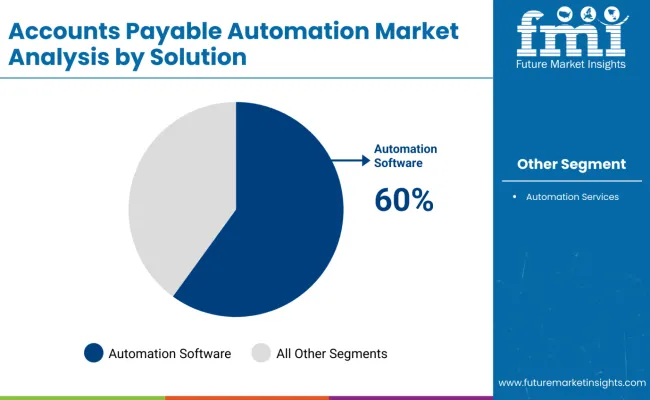
Based on component type the account payable automation market is segmented into solutions and services. Solution sales for accounts payable automation are expected to increase at a CAGR of 10% during the forecast period. The solution segment is projected to hold the largest share of the market during the forecast period.

Invoicing to receipt generation, the AP automation solution provides visibility throughout the entire AP process from approval, allocation, and payment. A payment gateway can also easily be integrated with Enterprise Resource Planning (ERP), enhancing flexibility and improving efficiency. With access to invoice status in real-time and the ability to run on-demand reports, AP automation solutions enable businesses to make strategic decisions based on data. Further, the solution provides various stakeholders in an organization a means to perform their tasks effectively, in the payment process, thereby reducing the number of errors associated with payments. All these factors have contributed to the growth of AP automated solution in the market.

How are On-premises Applications Driving Accounts Payable Automation Markets?

On-premises AP automation solutions are installed at the premises of the client business, however, a license must be acquired by the customer in order to take advantage of the customizable solution.  Market research reports predict that the On-premises accounts payable automation market will grow at a CAGR of 9.6% in 2032.

Automate payables workflows using on-premises AP automation solutions and define rules for automation of invoice approvals. Vendors provide integration and implementation services so that the solution can be conveniently and effectively set up at a client's facility for optimal performance. As these applications need large investments and ongoing development, the percentage of on-premises solutions is decreasing. All these factors are contributing to the growth of accounts payable automation in the market.

Customers are offered all features and functionalities available at the time they purchase on-premises accounts payable automation solution. To gain access to the latest updates, corrections, and news, users need to initiate regular upgrade tasks on a regular basis. A traditional on-premise solution would very soon be outdated due to the rapid technological progress of the modern age.

MarketNage
Become a MarketNgage Insider

A unified Market Research Subscription Platform, built for today's disparate research needs.

What is the Regional Outlook for Accounts Payable Automation?

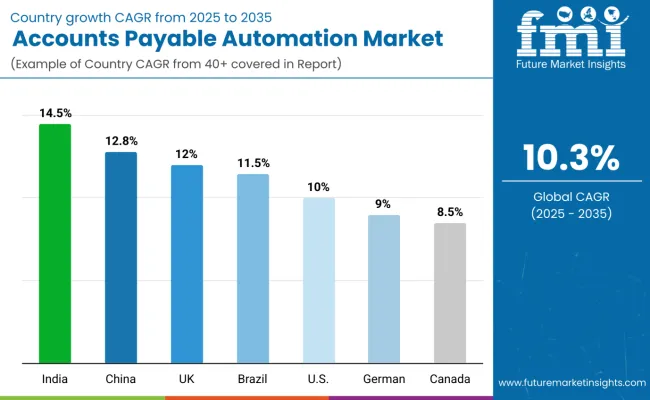
With increasing industry impact, the AP automation market is steadily growing in the United States. Several providers of products and services are available in the market, resulting in an extremely competitive market. As the U.S. tech industry continues to thrive and the business transaction through mobile continues to grow, the region has achieved a dominant position in the global accounts payable automation market. Market growth in the U.S. is expected to reach 9.7% CAGR during the forecast period. As the region's businesses expand their IT investments, financial operations will become more automated. To ensure the correct and timely completion of transactions, companies with a large volume of data and transactions are beginning to realize the importance of AP automation solutions.

Asia Pacific is expected to grow at the highest CAGR during the forecast period. As part of their strategy to reduce the rate of errors, organizations in the Asia-Pacific region have focused on automating their business processes. Within the forecast period, China is expected to achieve a market value of US$ 458.3 Million with a compound annual growth rate of 9.3%. Several organizations in China have discovered that automating the payable process will improve transparency, streamline operations, reduce costs, and provide protection against payment frauds. There are a bunch of companies working on business-specific automated payables solutions in this region, which is expanding the reach of the company and exploring potential business opportunities in the market.

Over the forecast period, Japan is projected to achieve a CAGR of 8.7% in 2032. Market size is anticipated to reach US$ 384.4 Million during the forecast period. With government initiatives to modify services and invoices in the region, the demand for accounts payable automation is increasing.  For instance, Japan has introduced a national e-invoicing network based on the PEPPOL standard. To improve government services in Japan, the administration announced plans to launch a digital agency in 2021 to standardize e-invoicing. South Korea is expected to register a market value of US$ 236.5 Million during the forecast period. Moreover, the market will reach a CAGR of 7.8% over the forecast period. With increasing advancements in technology and the use of cost-effective automated payable solutions on the market, the market demand for AP automation in this region will increase in the near future.

During the forecast period, the accounts payable automation market in the UK is expected to grow at a compound annual growth rate of 9%.  Several investments have been made in R&D development in the UK market, which will lead to rapid growth in the account payable automation market. As growth strategies, such as acquisitions and mergers, and partnerships, are increasing in this region, the market for account payable automation is predicted to grow in the near future.

What is the Level of Competition for Accounts Payable Automation in the Market?

Through strategic partnerships, manufacturers can increase production and meet consumer demand, increasing both their revenues and market share. The introduction of new products and technologies will allow end-users to reap the benefits of new technologies. Increasing the company's production capacity is one of the potential benefits of a strategic partnership.

Recent Developments in the Accounts Payable Automation Market:

  • For an undisclosed sum, Medius announced its acquisition of OnPay Solutions, an invoice payment provider, in April of 2021.  As a result of the agreement, Medius will be able to integrate their payment processing, AP automation's 'last mile', directly into their source-to-pay platforms, improving the operational efficiency of their customers and enhancing their ability to detect anomalies, fraud and risks.
  • In June 2021, Repay Holdings Corporation announced the acquisition of Kontrol Payables with a purchase price of up to $11 million, of which $8 million was paid at the closing of the transaction. This deal will be financed by cash on hand. With their expertise in Accounts Payable (AP) automation and extensive supplier networks, Kontrol is an ideal partner to help the firm to grow its AP automation business and expand our B2B services. Technology-first B2B automation and payment solutions continue to be in high demand, as enterprises strive to reduce costs and streamline back-office processes in an increasingly digital world. As a result of the acquisition, Kontrol will leverage REPAY's B2B technology resources, reach a larger virtual card market, and better target the $2.2 trillion total addressable market for our B2B AP automation services.
  • In November 2021, Cantec, a leading technology provider in Ireland, plans to double the size of the company by the year 2025 after acquiring accounts payable automation start-up Inship. While Cantec did not disclose the financial details of its acquisition, it said the acquisition will help it expand in Ireland. By 2025, the company plans to almost double its headcount to 100. In the last 18 months, the company has grown from 39 to 52 employees.
  • In January 2022, our SAP Partner Nimbl published its winning use case illustrating innovative technology after participating in the Hack2Build SAP S/4HANA Cloud Side-by-Side Extensions last year. They worked closely with the SAP Co-Innovation Lab and SAP product team throughout the process. A firm has announced that the Hack2Build winner has achieved an SAP-qualified partner-packaged solution for SAP S/4HANA and SAP Business Technology Platform, named Intelligent Accounts Payable Solution, gaining formal recognition as an SAP-qualified partner-packaged solution for SAP S/4HANA.
  • In April 2022, Stacks Pharmacy Group is integrating Seamless Smart Office AP automation software to facilitate their automated accounts payable processes. Smart Office AP replaced the manual invoice processing workflow of the Stack Pharmacy Group in order to simplify the processing of 7,000 paper invoices per month. A fully integrated online solution, Smart Office AP enables the Group's Sage 50c accounting system to fully automate the entire accounts payable process.

Key Players

  • SAP
  • Sage
  • Tipalti
  • Freshbooks
  • FIS
  • Zycus
  • Bottomline Technologies
  • Coupa Software
  • Comarch
  • Financial Force

Key Segments Covered in the Accounts Payable Automation Market

By Component:

  • Solution
  • Services
    • Professional Services
    • Implementation and Integration Services
    • Advisory Services
    • Support and Maintenance Services
    • Managed Services

By Deployment Type:

  • On-premises
  • Cloud

By Organization Size:

  • SMEs
  • Large Enterprises

By Vertical:

  • Consumer Goods and Retail
  • BFSI
  • Information Technology (IT) and Telecom
  • Manufacturing
  • Healthcare
  • Energy and Utilities
  • Others

By Region:

  • North America
  • Europe
  • Asia Pacific
  • The Middle East and Africa
  • Latin America

Frequently Asked Questions

The accounts payable automation market is expected to grow at a steady CAGR of 10% over the forecast period.

The global market for accounts payable automation was valued at US$ 2.3 Bn in 2021.

Solutions are projected to have the highest market with a CAGR of 10% during the forecast period.

U.S leads the global accounts payable automation market with a CAGR of 9.7% during the forecast period.

The market for accounts payable automation is expected to grow by nearly US$ 6.7 Bn by 2032.

The on-premises market is expected to grow at a CAGR of more than 9.6% over the next five years.

Growth in the use of electronic invoices, a decline in fraud, and an increase in demand for paperless invoices are key factors for the growth of the accounts payable automation market.

Table of Content

1. Executive Summary

    1.1. Global Market Outlook

    1.2. Summary of Statistics

    1.3. Key Market Characteristics & Attributes

    1.4. FMI Analysis and Recommendations

2. Market Overview

    2.1. Market Coverage

    2.2. Market Definition

3. Market Risks and Trends Assessment

    3.1. Risk Assessment

        3.1.1. COVID-19 Crisis and Impact on Accounts Payable Automation

        3.1.2. COVID-19 Impact Benchmark with Previous Crisis

        3.1.3. Impact on Market Value (US$ Mn)

        3.1.4. Assessment by Key Countries

        3.1.5. Assessment by Key Market Segments

        3.1.6. Action Points and Recommendation for Suppliers

    3.2. Key Trends Impacting the Market

    3.3. Formulation and Product Development Trends

4. Market Background

    4.1. Accounts Payable Automation Market, by Key Countries

    4.2. Accounts Payable Automation Market Opportunity Assessment (US$ Mn)

        4.2.1. Total Available Market

        4.2.2. Serviceable Addressable Market

        4.2.3. Serviceable Obtainable Market

    4.3. Market Scenario Forecast

        4.3.1. Demand in optimistic Scenario

        4.3.2. Demand in Likely Scenario

        4.3.3. Demand in Conservative Scenario

    4.4. Investment Feasibility Analysis

        4.4.1. Investment in Established Markets

            4.4.1.1. In Short Term

            4.4.1.2. In Long Term

        4.4.2. Investment in Emerging Markets

            4.4.2.1. In Short Term

            4.4.2.2. In Long Term

    4.5. Forecast Factors - Relevance & Impact

        4.5.1. Top Companies Historical Growth

        4.5.2. Growth in Automation, By Country

        4.5.3. Accounts Payable Automation Adoption Rate, By Country

    4.6. Market Dynamics

        4.6.1. Market Driving Factors and Impact Assessment

        4.6.2. Prominent Market Challenges and Impact Assessment

        4.6.3. Accounts Payable Automation Market Opportunities

        4.6.4. Prominent Trends in the Global Market & Their Impact Assessment

5. Key Success Factors

    5.1. Manufacturers’ Focus on Low Penetration High Growth Markets

    5.2. Banking on with Segments High Incremental Opportunity

    5.3. Peer Benchmarking

6. Global Accounts Payable Automation Market Demand Analysis 2015-2021 and Forecast, 2022-2032

    6.1. Historical Market Analysis, 2015-2021

    6.2. Current and Future Market Projections, 2022-2032

    6.3. Y-o-Y Growth Trend Analysis

7. Global Accounts Payable Automation Market Value Analysis 2015-2021 and Forecast, 2022-2032

    7.1. Historical Market Value (US$ Mn) Analysis, 2015-2021

    7.2. Current and Future Market Value (US$ Mn) Projections, 2022-2032

        7.2.1. Y-o-Y Growth Trend Analysis

        7.2.2. Absolute $ Opportunity Analysis

8. Global Accounts Payable Automation Market Analysis 2015-2021 and Forecast 2022-2032, By Organization Size

    8.1. Introduction / Key Findings

    8.2. Historical Market Size (US$ Mn) Analysis By Organization Size, 2015-2021

    8.3. Current and Future Market Size (US$ Mn) Analysis and Forecast By Organization Size, 2022-2032

        8.3.1. SMEs

        8.3.2. Large Enterprises

    8.4. Market Attractiveness Analysis By Organization Size

9. Global Accounts Payable Automation Market Analysis 2015-2021 and Forecast 2022-2032, By Vertical

    9.1. Introduction / Key Findings

    9.2. Historical Market Size (US$ Mn) Analysis By Vertical, 2015-2021

    9.3. Current and Future Market Size (US$ Mn) Analysis and Forecast By Vertical, 2022-2032

        9.3.1. Consumer Goods and Retail

        9.3.2. BFSI

        9.3.3. Information Technology (IT) and Telecom

        9.3.4. Manufacturing

        9.3.5. Healthcare

        9.3.6. Energy and Utilities

        9.3.7. Others

    9.4. Market Attractiveness Analysis By Vertical

10. Global Accounts Payable Automation Market Analysis 2015-2021 and Forecast 2022-2032, By Deployment Type

    10.1. Introduction / Key Findings

    10.2. Historical Market Size (US$ Mn) Analysis By Deployment Type, 2015-2021

    10.3. Current and Future Market Size (US$ Mn) Analysis and Forecast By Deployment Type, 2022-2032

        10.3.1. On-premises

        10.3.2. Cloud

    10.4. Market Attractiveness Analysis By Deployment Type

11. Global Accounts Payable Automation Market Analysis 2015-2021 and Forecast 2022-2032, By Component

    11.1. Introduction / Key Findings

    11.2. Historical Market Size (US$ Mn) Analysis By Component, 2015-2021

    11.3. Current and Future Market Size (US$ Mn) Analysis and Forecast By Component, 2022-2032

        11.3.1. Solution

        11.3.2. Services

            11.3.2.1. Professional Services

                11.3.2.1.1. Implementation and Integration Services

                11.3.2.1.2. Advisory Services

                11.3.2.1.3. Support and Maintenance Services

            11.3.2.2. Managed Services

    11.4. Market Attractiveness Analysis By Component

12. Global Accounts Payable Automation Market Analysis 2015-2021 and Forecast 2022-2032, By Region

    12.1. Introduction

    12.2. Historical Market Size (US$ Mn) Analysis By Region, 2015-2021

    12.3. Current Market Size (US$ Mn) & Analysis and Forecast By Region, 2022-2032

        12.3.1. North America

        12.3.2. Latin America

        12.3.3. Europe

        12.3.4. Asia Pacific

        12.3.5. Middle East and Africa (MEA)

    12.4. Market Attractiveness Analysis By Region

13. North America Accounts Payable Automation Market Analysis 2015-2021 and Forecast 2022-2032

    13.1. Introduction

    13.2. Pricing Analysis

    13.3. Historical Market Value (US$ Mn) Trend Analysis By Market Taxonomy, 2015-2021

    13.4. Market Value (US$ Mn) & Forecast By Market Taxonomy, 2022-2032

        13.4.1. By Country

            13.4.1.1. U.S.

            13.4.1.2. Canada

            13.4.1.3. Rest of North America

        13.4.2. By Organization Size

        13.4.3. By Vertical

        13.4.4. By Component

        13.4.5. By Deployment Type

    13.5. Market Attractiveness Analysis

        13.5.1. By Country

        13.5.2. By Organization Size

        13.5.3. By Vertical

        13.5.4. By Component

        13.5.5. By Deployment Type

14. Latin America Accounts Payable Automation Market Analysis 2015-2021 and Forecast 2022-2032

    14.1. Introduction

    14.2. Pricing Analysis

    14.3. Historical Market Value (US$ Mn) Trend Analysis By Market Taxonomy, 2015-2021

    14.4. Market Value (US$ Mn) & Forecast By Market Taxonomy, 2022-2032

        14.4.1. By Country

            14.4.1.1. Brazil

            14.4.1.2. Mexico

            14.4.1.3. Rest of Latin America

        14.4.2. By Organization Size

        14.4.3. By Vertical

        14.4.4. By Component

        14.4.5. By Deployment Type

    14.5. Market Attractiveness Analysis

        14.5.1. By Country

        14.5.2. By Organization Size

        14.5.3. By Vertical

        14.5.4. By Component

        14.5.5. By Deployment Type

15. Europe Accounts Payable Automation Market Analysis 2015-2021 and Forecast 2022-2032

    15.1. Introduction

    15.2. Pricing Analysis

    15.3. Historical Market Value (US$ Mn) Trend Analysis By Market Taxonomy, 2015-2021

    15.4. Market Value (US$ Mn) & Forecast By Market Taxonomy, 2022-2032

        15.4.1. By Country

            15.4.1.1. Germany

            15.4.1.2. France

            15.4.1.3. U.K.

            15.4.1.4. Italy

            15.4.1.5. Benelux

            15.4.1.6. Nordic Countries

            15.4.1.7. Rest of Europe

        15.4.2. By Organization Size

        15.4.3. By Vertical

        15.4.4. By Component

        15.4.5. By Deployment Type

    15.5. Market Attractiveness Analysis

        15.5.1. By Country

        15.5.2. By Organization Size

        15.5.3. By Vertical

        15.5.4. By Component

        15.5.5. By Deployment Type

16. Asia Pacific Accounts Payable Automation Market Analysis 2015-2021 and Forecast 2022-2032

    16.1. Introduction

    16.2. Pricing Analysis

    16.3. Historical Market Value (US$ Mn) Trend Analysis By Market Taxonomy, 2015-2021

    16.4. Market Value (US$ Mn) & Forecast By Market Taxonomy, 2022-2032

        16.4.1. By Country

            16.4.1.1. China

            16.4.1.2. Japan

            16.4.1.3. South Korea

            16.4.1.4. Rest of Asia Pacific

        16.4.2. By Organization Size

        16.4.3. By Vertical

        16.4.4. By Component

        16.4.5. By Deployment Type

    16.5. Market Attractiveness Analysis

        16.5.1. By Country

        16.5.2. By Organization Size

        16.5.3. By Vertical

        16.5.4. By Component

        16.5.5. By Deployment Type

17. Middle East and Africa Accounts Payable Automation Market Analysis 2015-2021 and Forecast 2022-2032

    17.1. Introduction

    17.2. Pricing Analysis

    17.3. Historical Market Value (US$ Mn) Trend Analysis By Market Taxonomy, 2015-2021

    17.4. Market Value (US$ Mn) & Forecast By Market Taxonomy, 2022-2032

        17.4.1. By Country

            17.4.1.1. GCC Countries

            17.4.1.2. South Africa

            17.4.1.3. Turkey

            17.4.1.4. Rest of Middle East and Africa

        17.4.2. By Organization Size

        17.4.3. By Vertical

        17.4.4. By Component

        17.4.5. By Deployment Type

    17.5. Market Attractiveness Analysis

        17.5.1. By Country

        17.5.2. By Organization Size

        17.5.3. By Vertical

        17.5.4. By Component

        17.5.5. By Deployment Type

18. Key Countries Accounts Payable Automation Market Analysis 2015-2021 and Forecast 2022-2032

    18.1. Introduction

        18.1.1. Market Value Proportion Analysis, By Key Countries

        18.1.2. Global Vs. Country Growth Comparison

    18.2. US Accounts Payable Automation Market Analysis

        18.2.1. Value Proportion Analysis by Market Taxonomy

        18.2.2. Value Analysis and Forecast by Market Taxonomy, 2015-2032

            18.2.2.1. By Organization Size

            18.2.2.2. By Vertical

            18.2.2.3. By Component

            18.2.2.4. By Deployment Type

    18.3. Canada Accounts Payable Automation Market Analysis

        18.3.1. Value Proportion Analysis by Market Taxonomy

        18.3.2. Value Analysis and Forecast by Market Taxonomy, 2015-2032

            18.3.2.1. By Organization Size

            18.3.2.2. By Vertical

            18.3.2.3. By Component

            18.3.2.4. By Deployment Type

    18.4. Mexico Accounts Payable Automation Market Analysis

        18.4.1. Value Proportion Analysis by Market Taxonomy

        18.4.2. Value Analysis and Forecast by Market Taxonomy, 2015-2032

            18.4.2.1. By Organization Size

            18.4.2.2. By Vertical

            18.4.2.3. By Component

            18.4.2.4. By Deployment Type

    18.5. Brazil Accounts Payable Automation Market Analysis

        18.5.1. Value Proportion Analysis by Market Taxonomy

        18.5.2. Value Analysis and Forecast by Market Taxonomy, 2015-2032

            18.5.2.1. By Organization Size

            18.5.2.2. By Vertical

            18.5.2.3. By Component

            18.5.2.4. By Deployment Type

    18.6. Germany Accounts Payable Automation Market Analysis

        18.6.1. Value Proportion Analysis by Market Taxonomy

        18.6.2. Value Analysis and Forecast by Market Taxonomy, 2015-2032

            18.6.2.1. By Organization Size

            18.6.2.2. By Vertical

            18.6.2.3. By Component

            18.6.2.4. By Deployment Type

    18.7. France Accounts Payable Automation Market Analysis

        18.7.1. Value Proportion Analysis by Market Taxonomy

        18.7.2. Value Analysis and Forecast by Market Taxonomy, 2015-2032

            18.7.2.1. By Organization Size

            18.7.2.2. By Vertical

            18.7.2.3. By Component

            18.7.2.4. By Deployment Type

    18.8. Italy Accounts Payable Automation Market Analysis

        18.8.1. Value Proportion Analysis by Market Taxonomy

        18.8.2. Value Analysis and Forecast by Market Taxonomy, 2015-2032

            18.8.2.1. By Organization Size

            18.8.2.2. By Vertical

            18.8.2.3. By Component

            18.8.2.4. By Deployment Type

    18.9. BENELUX Accounts Payable Automation Market Analysis

        18.9.1. Value Proportion Analysis by Market Taxonomy

        18.9.2. Value Analysis and Forecast by Market Taxonomy, 2015-2032

            18.9.2.1. By Organization Size

            18.9.2.2. By Vertical

            18.9.2.3. By Component

            18.9.2.4. By Deployment Type

    18.10. UK Accounts Payable Automation Market Analysis

        18.10.1. Value Proportion Analysis by Market Taxonomy

        18.10.2. Value Analysis and Forecast by Market Taxonomy, 2015-2032

            18.10.2.1. By Organization Size

            18.10.2.2. By Vertical

            18.10.2.3. By Component

            18.10.2.4. By Deployment Type

    18.11. Nordic Countries Accounts Payable Automation Market Analysis

        18.11.1. Value Proportion Analysis by Market Taxonomy

        18.11.2. Value Analysis and Forecast by Market Taxonomy, 2015-2032

            18.11.2.1. By Organization Size

            18.11.2.2. By Vertical

            18.11.2.3. By Component

            18.11.2.4. By Deployment Type

    18.12. China Accounts Payable Automation Market Analysis

        18.12.1. Value Proportion Analysis by Market Taxonomy

        18.12.2. Value Analysis and Forecast by Market Taxonomy, 2015-2032

            18.12.2.1. By Organization Size

            18.12.2.2. By Vertical

            18.12.2.3. By Component

            18.12.2.4. By Deployment Type

    18.13. Japan Accounts Payable Automation Market Analysis

        18.13.1. Value Proportion Analysis by Market Taxonomy

        18.13.2. Value Analysis and Forecast by Market Taxonomy, 2015-2032

            18.13.2.1. By Organization Size

            18.13.2.2. By Vertical

            18.13.2.3. By Component

            18.13.2.4. By Deployment Type

    18.14. South Korea Accounts Payable Automation Market Analysis

        18.14.1. Value Proportion Analysis by Market Taxonomy

        18.14.2. Value Analysis and Forecast by Market Taxonomy, 2015-2032

            18.14.2.1. By Organization Size

            18.14.2.2. By Vertical

            18.14.2.3. By Component

            18.14.2.4. By Deployment Type

    18.15. GCC Countries Accounts Payable Automation Market Analysis

        18.15.1. Value Proportion Analysis by Market Taxonomy

        18.15.2. Value Analysis and Forecast by Market Taxonomy, 2015-2032

            18.15.2.1. By Organization Size

            18.15.2.2. By Vertical

            18.15.2.3. By Component

            18.15.2.4. By Deployment Type

    18.16. South Africa Accounts Payable Automation Market Analysis

        18.16.1. Value Proportion Analysis by Market Taxonomy

        18.16.2. Value Analysis and Forecast by Market Taxonomy, 2015-2032

            18.16.2.1. By Organization Size

            18.16.2.2. By Vertical

            18.16.2.3. By Component

            18.16.2.4. By Deployment Type

    18.17. Turkey Accounts Payable Automation Market Analysis

        18.17.1. Value Proportion Analysis by Market Taxonomy

        18.17.2. Value Analysis and Forecast by Market Taxonomy, 2015-2032

            18.17.2.1. By Organization Size

            18.17.2.2. By Vertical

            18.17.2.3. By Component

            18.17.2.4. By Deployment Type

        18.17.3. Competition Landscape and Player Concentration in the Country

19. Market Structure Analysis

    19.1. Market Analysis by Tier of Companies

    19.2. Market Concentration

    19.3. Market Share Analysis of Top Players

    19.4. Market Presence Analysis

        19.4.1. By Regional footprint of Players

        19.4.2. Product footprint by Players

20. Competition Analysis

    20.1. Competition Dashboard

    20.2. Competition Benchmarking

    20.3. Competition Deep Dive

        20.3.1. SAP

            20.3.1.1. Overview

            20.3.1.2. Product Portfolio

            20.3.1.3. Sales Footprint

            20.3.1.4. Strategy Overview

        20.3.2. Sage

            20.3.2.1. Overview

            20.3.2.2. Product Portfolio

            20.3.2.3. Sales Footprint

            20.3.2.4. Strategy Overview

        20.3.3. Tipalti

            20.3.3.1. Overview

            20.3.3.2. Product Portfolio

            20.3.3.3. Sales Footprint

            20.3.3.4. Strategy Overview

        20.3.4. Freshbooks

            20.3.4.1. Overview

            20.3.4.2. Product Portfolio

            20.3.4.3. Sales Footprint

            20.3.4.4. Strategy Overview

        20.3.5. FIS

            20.3.5.1. Overview

            20.3.5.2. Product Portfolio

            20.3.5.3. Sales Footprint

            20.3.5.4. Strategy Overview

        20.3.6. Zycus

            20.3.6.1. Overview

            20.3.6.2. Product Portfolio

            20.3.6.3. Sales Footprint

            20.3.6.4. Strategy Overview

        20.3.7. Bottomline Technologies

            20.3.7.1. Overview

            20.3.7.2. Product Portfolio

            20.3.7.3. Sales Footprint

            20.3.7.4. Strategy Overview

        20.3.8. Coupa Software

            20.3.8.1. Overview

            20.3.8.2. Product Portfolio

            20.3.8.3. Sales Footprint

            20.3.8.4. Strategy Overview

        20.3.9. Comarch

            20.3.9.1. Overview

            20.3.9.2. Product Portfolio

            20.3.9.3. Sales Footprint

            20.3.9.4. Strategy Overview

        20.3.10. Financialforce

            20.3.10.1. Overview

            20.3.10.2. Product Portfolio

            20.3.10.3. Sales Footprint

            20.3.10.4. Strategy Overview

21. Assumptions and Acronyms Used

22. Research Methodology
Customize this Report

Let us know your requirement to get
100% FREE customization

List of Tables

Table 1: Global Accounts Payable Automation Market Value (US$ Mn),By Organization Size, 2015 – 2021

Table 2: Global Accounts Payable Automation Market Value (US$ Mn),By Organization Size, 2022 – 2032

Table 3: Global Accounts Payable Automation Market Value (US$ Mn), By Vertical, 2015 – 2021

Table 4: Global Accounts Payable Automation Market Value (US$ Mn), By Vertical, 2022 – 2032

Table 5: Global Accounts Payable Automation Market Value (US$ Mn), By Deployment Type, 2015 – 2021

Table 6: Global Accounts Payable Automation Market Value (US$ Mn), By Deployment Type, 2022 – 2032

Table 7: Global Accounts Payable Automation Market Value (US$ Mn), By Component, 2015 – 2021

Table 8: Global Accounts Payable Automation Market Value (US$ Mn), By Component, 2022 – 2032

Table 9: Global Accounts Payable Automation Market, By Region, 2015 – 2021

Table 10: Global Accounts Payable Automation Market, By Region, 2022 – 2032

Table 11: North America Accounts Payable Automation Market Value (US$ Mn),By Organization Size, 2015 – 2021

Table 12: North America Accounts Payable Automation Market Value (US$ Mn),By Organization Size, 2022 – 2032

Table 13: North America Accounts Payable Automation Market Value (US$ Mn), By Vertical, 2015 – 2021

Table 14: North America Accounts Payable Automation Market Value (US$ Mn), By Vertical, 2022 – 2032

Table 15: North America Accounts Payable Automation Market Value (US$ Mn), By Deployment Type, 2015 – 2021

Table 16: North America Accounts Payable Automation Market Value (US$ Mn), By Deployment Type, 2022 – 2032

Table 17: North America Accounts Payable Automation Market Value (US$ Mn), By Component, 2015 – 2021

Table 18: North America Accounts Payable Automation Market Value (US$ Mn), By Component, 2022 – 2032

Table 19: North America Accounts Payable Automation Market, By Country, 2015 – 2021

Table 20: North America Accounts Payable Automation Market, By Country, 2022 – 2032

Table 21: Latin America Accounts Payable Automation Market Value (US$ Mn),By Organization Size, 2015 – 2021

Table 22: Latin America Accounts Payable Automation Market Value (US$ Mn),By Organization Size, 2022 – 2032

Table 23: Latin America Accounts Payable Automation Market Value (US$ Mn), By Vertical, 2015 – 2021

Table 24: Latin America Accounts Payable Automation Market Value (US$ Mn), By Vertical, 2022 – 2032

Table 25: Latin America Accounts Payable Automation Market Value (US$ Mn), By Deployment Type, 2015 – 2021

Table 26: Latin America Accounts Payable Automation Market Value (US$ Mn), By Deployment Type, 2022 – 2032

Table 27: Latin America Accounts Payable Automation Market Value (US$ Mn), By Component, 2015 – 2021

Table 28: Latin America Accounts Payable Automation Market Value (US$ Mn), By Component, 2022 – 2032

Table 29: Latin America Accounts Payable Automation Market, By Country, 2015 – 2021

Table 30: Latin America Accounts Payable Automation Market, By Country, 2022 – 2032

Table 31: Europe Accounts Payable Automation Market Value (US$ Mn),By Organization Size, 2015 – 2021

Table 32: Europe Accounts Payable Automation Market Value (US$ Mn),By Organization Size, 2022 – 2032

Table 33: Europe Accounts Payable Automation Market Value (US$ Mn), By Vertical, 2015 – 2021

Table 34: Europe Accounts Payable Automation Market Value (US$ Mn), By Vertical, 2022 – 2032

Table 35: Europe Accounts Payable Automation Market Value (US$ Mn), By Deployment Type, 2015 – 2021

Table 36: Europe Accounts Payable Automation Market Value (US$ Mn), By Deployment Type, 2022 – 2032

Table 37: Europe Accounts Payable Automation Market Value (US$ Mn), By Component, 2015 – 2021

Table 38: Europe Accounts Payable Automation Market Value (US$ Mn), By Component, 2022 – 2032

Table 39: Europe Accounts Payable Automation Market, By Country, 2015 – 2021

Table 40: Europe Accounts Payable Automation Market, By Country, 2022 – 2032

Table 41: Asia Pacific Accounts Payable Automation Market Value (US$ Mn),By Organization Size, 2015 – 2021

Table 42: Asia Pacific Accounts Payable Automation Market Value (US$ Mn),By Organization Size, 2022 – 2032

Table 43: Asia Pacific Accounts Payable Automation Market Value (US$ Mn), By Vertical, 2015 – 2021

Table 44: Asia Pacific Accounts Payable Automation Market Value (US$ Mn), By Vertical, 2022 – 2032

Table 45: Asia Pacific Accounts Payable Automation Market Value (US$ Mn), By Deployment Type, 2015 – 2021

Table 46: Asia Pacific Accounts Payable Automation Market Value (US$ Mn), By Deployment Type, 2022 – 2032

Table 47: Asia Pacific Accounts Payable Automation Market Value (US$ Mn), By Component, 2015 – 2021

Table 48: Asia Pacific Accounts Payable Automation Market Value (US$ Mn), By Component, 2022 – 2032

Table 49: Asia Pacific Accounts Payable Automation Market, By Country, 2015 – 2021

Table 50: Asia Pacific Accounts Payable Automation Market, By Country, 2022 – 2032

Table 51: MEA Accounts Payable Automation Market Value (US$ Mn),By Organization Size, 2015 – 2021

Table 52: MEA Accounts Payable Automation Market Value (US$ Mn),By Organization Size, 2022 – 2032

Table 53: MEA Accounts Payable Automation Market Value (US$ Mn), By Vertical, 2015 – 2021

Table 54: MEA Accounts Payable Automation Market Value (US$ Mn), By Vertical, 2022 – 2032

Table 55: MEA Accounts Payable Automation Market Value (US$ Mn), By Deployment Type, 2015 – 2021

Table 56: MEA Accounts Payable Automation Market Value (US$ Mn), By Deployment Type, 2022 – 2032

Table 57: MEA Accounts Payable Automation Market Value (US$ Mn), By Component, 2015 – 2021

Table 58: MEA Accounts Payable Automation Market Value (US$ Mn), By Component, 2022 – 2032

Table 59: MEA Accounts Payable Automation Market, By Country, 2015 – 2021

Table 60: MEA Accounts Payable Automation Market, By Country, 2022 – 2032
Sudip Saha
Principal Consultant
LinkedIn
Talk to Analyst

Find your sweet spots for generating winning opportunities in this market.

Talk to Analyst

List of Charts

Figure 1: Global Accounts Payable Automation Market Value (US$ Mn) and Year-on-Year Growth, 2015-2032

Figure 2: Global Accounts Payable Automation Market Absolute $ Historical Gain (2015 - 2021) and Opportunity(2022 – 2032), US$ Mn

Figure 3: Global Accounts Payable Automation Market Share, By Organization Size, 2022 & 2032

Figure 4: Global Accounts Payable Automation Market Y-o-Y Growth Projections, Organization Size – 2022-2032

Figure 5: Global Accounts Payable Automation Market Attractiveness Index, Organization Size – 2022-2032

Figure 6: Global Accounts Payable Automation Market Share, By Vertical, 2022 & 2032

Figure 7: Global Accounts Payable Automation Market Y-o-Y Growth Projections, By Vertical – 2022-2032

Figure 8: Global Accounts Payable Automation Market Attractiveness Index, By Vertical – 2022-2032

Figure 9: Global Accounts Payable Automation Market Share, By Component, 2022 & 2032

Figure 10: Global Accounts Payable Automation Market Y-o-Y Growth Projections, By Component – 2022-2032

Figure 11: Global Accounts Payable Automation Market Attractiveness Index, By Component – 2022-2032

Figure 12: Global Accounts Payable Automation Market Share, By Deployment Type, 2022 & 2032

Figure 13: Global Accounts Payable Automation Market Y-o-Y Growth Projections, By Deployment Type – 2022-2032

Figure 14: Global Accounts Payable Automation Market Attractiveness Index, By Deployment Type – 2022-2032

Figure 15: Global Accounts Payable Automation Market Share, By Region, 2022 & 2032

Figure 16: Global Accounts Payable Automation Market Y-o-Y Growth Projections, By Region – 2022-2032

Figure 17: Global Accounts Payable Automation Market Attractiveness Index, By Region – 2022-2032

Figure 18: North America Accounts Payable Automation Market Value (US$ Mn) and Year-on-Year Growth, 2015-2032

Figure 19: North America Accounts Payable Automation Market Absolute $ Opportunity Historical (2015 - 2021) and Forecast Period (2022 – 2032), US$ Mn

Figure 20: North America Accounts Payable Automation Market Share, Organization Size, 2022 & 2032

Figure 21: North America Accounts Payable Automation Market Y-o-Y Growth Projections, Organization Size –2022-2032

Figure 22: North America Accounts Payable Automation Market Attractiveness Index, Organization Size – 2022-2032

Figure 23: North America Accounts Payable Automation Market Share, By Vertical, 2022 & 2032

Figure 24: North America Accounts Payable Automation Market Y-o-Y Growth Projections, By Vertical – 2022-2032

Figure 25: North America Accounts Payable Automation Market Attractiveness Index, By Vertical – 2022-2032

Figure 26: North America Accounts Payable Automation Market Share, By Component, 2022 & 2032

Figure 27: North America Accounts Payable Automation Market Y-o-Y Growth Projections, By Component – 2022-2032

Figure 28: North America Accounts Payable Automation Market Attractiveness Index, By Component – 2022-2032

Figure 29: North America Accounts Payable Automation Market Share, By Deployment Type, 2022 & 2032

Figure 30: North America Accounts Payable Automation Market Y-o-Y Growth Projections, By Deployment Type –2022-2032

Figure 31: North America Accounts Payable Automation Market Attractiveness Index, By Deployment Type –2022-2032

Figure 32: North America Accounts Payable Automation Market Share, By Country, 2022 & 2032

Figure 33: North America Market Y-o-Y Growth Projections, By Country – 2022-2032

Figure 34: North America Market Attractiveness Index, By Country – 2022-2032

Figure 35: Latin America Accounts Payable Automation Market Value (US$ Mn) and Year-on-Year Growth, 2015-2032

Figure 36: Latin America Accounts Payable Automation Market Absolute $ Opportunity Historical (2015 - 2021) and Forecast Period (2022 – 2032), US$ Mn

Figure 37: Latin America Accounts Payable Automation Market Share, Organization Size, 2022 & 2032

Figure 38: Latin America Accounts Payable Automation Market Y-o-Y Growth Projections, Organization Size – 2022-2032

Figure 39: Latin America Accounts Payable Automation Market Attractiveness Index, Organization Size – 2022-2032

Figure 40: Latin America Accounts Payable Automation Market Share, By Vertical, 2022 & 2032

Figure 41: Latin America Accounts Payable Automation Market Y-o-Y Growth Projections, By Vertical – 2022-2032

Figure 42: Latin America Accounts Payable Automation Market Attractiveness Index, By Vertical – 2022-2032

Figure 43: Latin America Accounts Payable Automation Market Share, By Component, 2022 & 2032

Figure 44: Latin America Accounts Payable Automation Market Y-o-Y Growth Projections, By Component – 2022-2032

Figure 45: Latin America Accounts Payable Automation Market Attractiveness Index, By Component – 2022-2032

Figure 46: Latin America Accounts Payable Automation Market Share, By Deployment Type, 2022 & 2032

Figure 47: Latin America Accounts Payable Automation Market Y-o-Y Growth Projections, By Deployment Type – 2022-2032

Figure 48: Latin America Accounts Payable Automation Market Attractiveness Index, By Deployment Type – 2022-2032

Figure 49: Latin America Accounts Payable Automation Market Share, By Country, 2022 & 2032

Figure 50: Latin America Accounts Payable Automation Market Y-o-Y Growth Projections, By Country – 2022-2032

Figure 51: Latin America Accounts Payable Automation Market Attractiveness Index, By Country – 2022-2032

Figure 52: Europe Accounts Payable Automation Market Value (US$ Mn) and Year-on-Year Growth, 2015-2032

Figure 53: Europe Accounts Payable Automation Market Absolute $ Opportunity Historical (2015 - 2021) and Forecast Period (2022 – 2032), US$ Mn

Figure 54: Europe Accounts Payable Automation Market Share, Organization Size, 2022 & 2032

Figure 55: Europe Accounts Payable Automation Market Y-o-Y Growth Projections, Organization Size – 2022-2032

Figure 56: Europe Accounts Payable Automation Market Attractiveness Index, Organization Size – 2022-2032

Figure 57: Europe Accounts Payable Automation Market Share, By Vertical, 2022 & 2032

Figure 58: Europe Accounts Payable Automation Market Y-o-Y Growth Projections, By Vertical – 2022-2032

Figure 59: Europe Accounts Payable Automation Market Attractiveness Index, By Vertical – 2022-2032

Figure 60: Europe Accounts Payable Automation Market Share, By Component, 2022 & 2032

Figure 61: Europe Accounts Payable Automation Market Y-o-Y Growth Projections, By Component – 2022-2032

Figure 62: Europe Accounts Payable Automation Market Attractiveness Index, By Component – 2022-2032

Figure 63: Europe Accounts Payable Automation Market Share, By Deployment Type, 2022 & 2032

Figure 64: Europe Accounts Payable Automation Market Y-o-Y Growth Projections, By Deployment Type – 2022-2032

Figure 65: Europe Accounts Payable Automation Market Attractiveness Index, By Deployment Type – 2022-2032

Figure 66: Europe Accounts Payable Automation Market Share, By Country, 2022 & 2032

Figure 67: Europe Accounts Payable Automation Market Y-o-Y Growth Projections, By Country – 2022-2032

Figure 68: Europe Accounts Payable Automation Market Attractiveness Index, By Country – 2022-2032

Figure 69: MEA Accounts Payable Automation Market Value (US$ Mn) and Year-on-Year Growth, 2015-2032

Figure 70: MEA Accounts Payable Automation Market Absolute $ Opportunity Historical (2015 - 2021) and Forecast Period (2022 – 2032), US$ Mn

Figure 71: MEA Accounts Payable Automation Market Share, Organization Size, 2022 & 2032

Figure 72: MEA Accounts Payable Automation Market Y-o-Y Growth Projections, Organization Size – 2022-2032

Figure 73: MEA Accounts Payable Automation Market Attractiveness Index, Organization Size – 2022-2032

Figure 74: MEA Accounts Payable Automation Market Share, By Vertical, 2022 & 2032

Figure 75: MEA Accounts Payable Automation Market Y-o-Y Growth Projections, By Vertical – 2022-2032

Figure 76: MEA Accounts Payable Automation Market Attractiveness Index, By Vertical – 2022-2032

Figure 77: MEA Accounts Payable Automation Market Share, By Component, 2022 & 2032

Figure 78: MEA Accounts Payable Automation Market Y-o-Y Growth Projections, By Component – 2022-2032

Figure 79: MEA Accounts Payable Automation Market Attractiveness Index, By Component – 2022-2032

Figure 80: MEA Accounts Payable Automation Market Share, By Deployment Type, 2022 & 2032

Figure 81: MEA Accounts Payable Automation Market Y-o-Y Growth Projections, By Deployment Type – 2022-2032

Figure 82: MEA Accounts Payable Automation Market Attractiveness Index, By Deployment Type – 2022-2032

Figure 83: MEA Accounts Payable Automation Market Share, By Country, 2022 & 2032

Figure 84: MEA Accounts Payable Automation Market Y-o-Y Growth Projections, By Country – 2022-2032

Figure 85: MEA Accounts Payable Automation Market Attractiveness Index, By Country – 2022-2032

Figure 86: Asia Pacific Accounts Payable Automation Market Value (US$ Mn) and Year-on-Year Growth, 2015-2032

Figure 87: Asia Pacific Accounts Payable Automation Market Absolute $ Opportunity Historical (2015 - 2021) and Forecast Period (2022 – 2032), US$ Mn

Figure 88: Asia Pacific Accounts Payable Automation Market Share, Organization Size, 2022 & 2032

Figure 89: Asia Pacific Accounts Payable Automation Market Y-o-Y Growth Projections, Organization Size – 2022-2032

Figure 90: Asia Pacific Accounts Payable Automation Market Attractiveness Index, Organization Size – 2022-2032

Figure 91: Asia Pacific Accounts Payable Automation Market Share, By Vertical, 2022 & 2032

Figure 92: Asia Pacific Accounts Payable Automation Market Y-o-Y Growth Projections, By Vertical – 2022-2032

Figure 93: Asia Pacific Accounts Payable Automation Market Attractiveness Index, By Vertical – 2022-2032

Figure 94: Asia Pacific Accounts Payable Automation Market Share, By Component, 2022 & 2032

Figure 95: Asia Pacific Accounts Payable Automation Market Y-o-Y Growth Projections, By Component – 2022-2032

Figure 96: Asia Pacific Accounts Payable Automation Market Attractiveness Index, By Component – 2022-2032

Figure 97: Asia Pacific Accounts Payable Automation Market Share, By Deployment Type, 2022 & 2032

Figure 98: Asia Pacific Accounts Payable Automation Market Y-o-Y Growth Projections, By Deployment Type –2022-2032

Figure 99: Asia Pacific Accounts Payable Automation Market Attractiveness Index, By Deployment Type – 2022-2032

Figure 100: Asia Pacific Accounts Payable Automation Market Share, By Country, 2022 & 2032

Figure 101: Asia Pacific Accounts Payable Automation Market Y-o-Y Growth Projections, By Country – 2022-2032

Figure 102: Asia Pacific Accounts Payable Automation Market Attractiveness Index, By Country – 2022-2032

Need specific information?

Request Customization

Explore Technology Insights

View Reports

Recommendations

Technology

Master Recharge API Market

Published : May 2022

Technology

Business Process Automation (BPA) Market

Published : April 2022

Technology

North America and Europe Retail Automation Market

Published : January 1970

Technology

Wind Turbine Automation Market

Published : January 1970

Google translate

Accounts Payable Automation Market