Accounts Receivable Automation Market Size and Share Forecast Outlook 2025 to 2035

The Accounts Receivable Automation Market is estimated to be valued at USD 3.2 billion in 2025 and is projected to reach USD 8.6 billion by 2035, registering a compound annual growth rate (CAGR) of 10.3% over the forecast period.
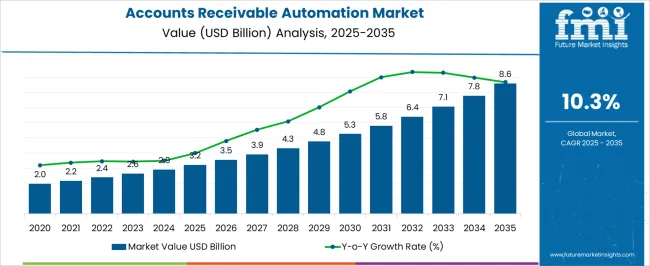
Quick Stats for Accounts Receivable Automation Market

  • Accounts Receivable Automation Market Industry Value (2025): USD 3.2 billion
  • Accounts Receivable Automation Market Forecast Value (2035): USD 8.6 billion
  • Accounts Receivable Automation Market Forecast CAGR: 10.3%
  • Leading Segment in Accounts Receivable Automation Market in 2025: Solution (54.2%)
  • Key Growth Region in Accounts Receivable Automation Market: North America, Asia-Pacific, Europe
  • Top Key Players in Accounts Receivable Automation Market: SAP SE, Oracle Corporation, SK Global Software, Quadient (YayPay Inc.), Kofax Inc., Workday, Inc., Corcentric LLC, HighRadius Corporation, Qvalia AB, MHC Automation, Bill.com Holdings Inc., Comarch SA, Esker Inc.

Accounts Receivable Automation Market Market Value Analysis

Metric Value
Accounts Receivable Automation Market Estimated Value in (2025 E) USD 3.2 billion
Accounts Receivable Automation Market Forecast Value in (2035 F) USD 8.6 billion
Forecast CAGR (2025 to 2035) 10.3%

Rationale for Segmental Growth in the Accounts Receivable Automation Market

The accounts receivable automation market is advancing steadily as organizations prioritize operational efficiency, cash flow optimization, and error reduction in financial processes. Growing pressure to accelerate invoice processing, improve payment cycles, and reduce manual dependency has intensified the adoption of automation platforms across industries.

Integration of AI, machine learning, and cloud based analytics has enhanced accuracy, predictive insights, and compliance monitoring. The rise of digital payment ecosystems and the need for stronger governance in financial transactions are further reinforcing demand.

Regulatory requirements for transparency and data security are also prompting enterprises to invest in secure and scalable automation tools. The outlook for the market remains robust as companies across geographies embrace digital transformation strategies to streamline finance operations, reduce costs, and strengthen customer relationships.
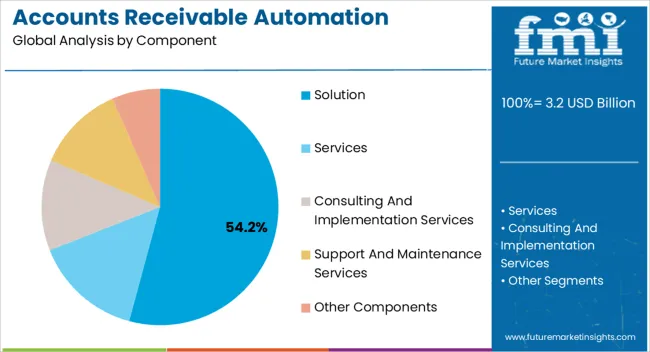
Segmental Analysis

Insights into the Solution Component Segment

Accounts Receivable Automation Market Analysis By Component

The solution segment is expected to account for 54.20% of total revenue by 2025 within the component category, positioning it as the leading segment. Growth is being driven by the rising demand for comprehensive automation platforms that provide real time tracking, invoice management, and payment reconciliation.

These solutions reduce errors, minimize processing time, and enhance visibility across the receivables cycle. Enterprises are increasingly favoring integrated platforms that support scalability and seamless integration with ERP systems.

As financial leaders seek data driven decision making tools, the adoption of automation solutions has intensified, reinforcing their dominance in the component category.
Insights into the On Premises Deployment Mode Segment

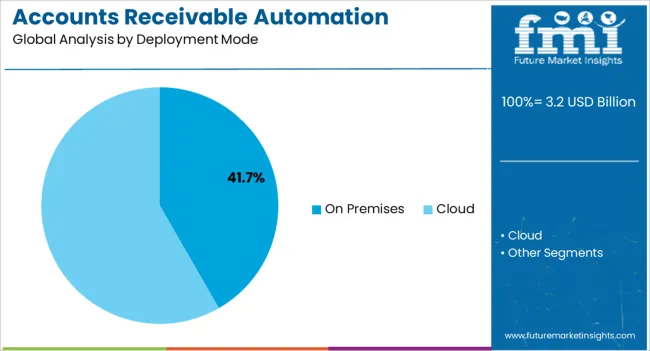
Accounts Receivable Automation Market Analysis By Deployment Mode

The on premises deployment mode segment is projected to contribute 41.70% of total revenue by 2025, establishing its strong position within deployment preferences. This preference is supported by the need for greater data security, customization, and control over financial processes.

Enterprises handling sensitive financial information often opt for on premises systems to ensure compliance with internal and external audit requirements. The ability to integrate with existing IT infrastructure and to customize workflows for specific business needs further supports its continued use.

Despite the growth of cloud based platforms, on premises deployment remains critical in industries where security and regulatory compliance are paramount.
Insights into the Small and Medium Enterprises Organization Size Segment

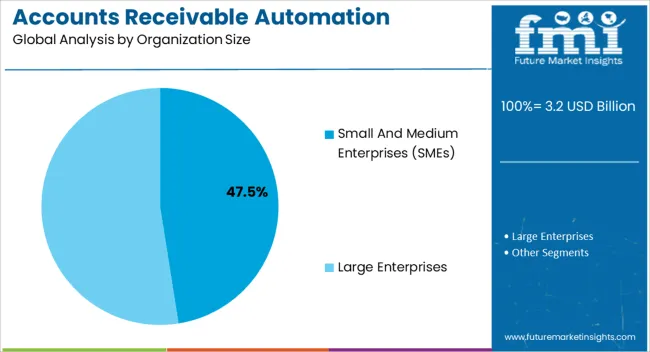
Accounts Receivable Automation Market Analysis By Organization Size

The small and medium enterprises segment is projected to hold 47.50% of total revenue by 2025 within the organization size category, making it the largest contributor. SMEs are adopting accounts receivable automation to improve cash flow, reduce manual workload, and ensure timely payment cycles.

Limited staff and resources have accelerated their reliance on automation tools that provide cost effective solutions and scalability. The adoption of digital payment systems and government initiatives supporting SME digitization are further driving uptake.

As SMEs continue to expand in global supply chains and seek competitive advantages, their adoption of receivable automation platforms has positioned them as a significant driver of market growth.

Historical Outlook of the Accounts Receivable Automation Market

As per the previous market records, the bet worth of total accounts receivable services adopted globally in the year 2020 was USD 1,716.1 million. In the following years between 2020 and 2025, the overall market progressed at 8.7% CAGR and reached USD 2,400.2 million by its end.

What Factors Impede the Accounts Receivable Automation Market?

Some factors are acting as obstacles and are hindering the growth of the global market during the forecast period. Data security concerns and the reluctance of enterprises toward automating processes are some factors that are expected to hamper the growth of the global market during the forecast period.

The high price of these systems and complexities of the accounts receivable automation like complex financial systems, and less standardization are other factors that are anticipated to hinder the growth of the market.

One of the key challenges which organizations are facing is the complex implantation process of this software. As manual accounts are generally easier to set up and can be more flexible than computerized accounting. Hence the organizations probably need some initial help while setting up the accounting software and thus the accountant may charge for this which can result in high initial costs

What are the Key Trends in the Accounts Receivable Automation Market?

Account receivable management helps organizations to reduce the time spent prioritizing and preparing for calls. In addition, it helps them to reduce the time spent on managing disputes and increase the time they spend soliciting customers for payment which is expected to drive the growth of the market.

It provides several benefits such as cost savings, reduced time, less manual work, and others which are expected to increase the demand for an account receivable automation system. Many key players operating in the market are offering payment collection solutions through the private and public clouds. These solutions are available in different subscriptions and pay-per-use models.

Enterprises are increasingly deploying account receivable automation solutions on the cloud, as it provides numerous advantages. Such as flexibility, scalability, enhanced collaboration, cost-efficiency, and others that fuel market growth.

It also facilitates enterprises to focus on their core competencies, rather than IT processes. Cloud-based solutions are gaining popularity mainly due to their unprecedented deployment flexibility benefits and global availability which is increasing their adoption among small and medium enterprises.

How is the Accounts Receivable Automation Market Segmented?

The market is categorized on the basis of component, deployment mode, organization size, and vertical. In component segment, solution category is expected to acquire high share with CAGR of 10.2% through 2035. The services in component segment are further divided into consulting and implementation services, and support & maintenance services.

By deployment mode, the market is divided into cloud and on-premises. According to FMI, on-premises segment is projected to dominate registering a CAGR of 10%. Businesses mainly prefer deployment of accounts receivable solutions. Since this solutions allows businesses to control their businesses accounts and transaction records completely.

The on-premises deployment mode also provides enterprises with full control over the infrastructure and assets, as well as enhances their online security measures. By vertical, manufacturing is expected to be a significant contributor to the accounts receivable automation market during the forecast period.

Category By Component
Top Segment Solution
Market Share in Percentage 29.1%
Category By Deployment Mode
Top Segment On-premise
Market Share in Percentage 57.4%

The manufacturing industry is always on the foothold of overdue credit collection. Enterprises are seeking methods to reduce the burden of payment collection by adopting adequate solutions. This results in the improvement of accounts receivable.

The manufacturing industry emphasize on improving their production process and helps workforce in simplifying work without compromising accuracy. It also focuses on creating new and pioneering products.

Which Region is Performing Better in the Accounts Receivable Automation Market?

Regional Market Comparison Global Market Share in Percentage
North America 310.3%%
Europe 22.3%

The Asia Pacific region dominates the global overall market, attributed to the growing demand for precise management of accounting procedures and timely processing of payment processes from customers, Moreover, accounts receivable automation is adopted by enterprises to boost payment collection. In addition, the APAC market has gained traction, owing to the rising demand for automated and secured payable processes.

Regional Market Comparison Global Market Share in Percentage
United States 19.2%
Germany 10.2%
Japan 6.5%
Australia 2.2%

The sales of accounts receivable automation in the United States was estimated at USD 3.2 billion in 2025. The receivable automation market in country is expected to reach market revenue of USD8.6 billion by 2035. United States is estimated to grow at a 10.5% CAGR. Further, in 2035, China is projected to reach market size of USD 4510.3% with CAGR of 10.0% by 2035.

Regional Markets CAGR (2025 to 2035)
United Kingdom 8.2%
China 9.1%
India 13.2%

Japan and the United Kingdom are expected to reach the same market size of USD 363 million and USD 278.3 million in 2035. Representing growth forecasts of 8.9% and 9.7% respectively, throughout the forecast period. South Korea, on the other hand, is expected to reach a market size of USD 226.5 million in 2035, representing a CAGR of 8.2%, during the forecast period.
Who are the Key Competitors in the Accounts Receivable Automation Market?

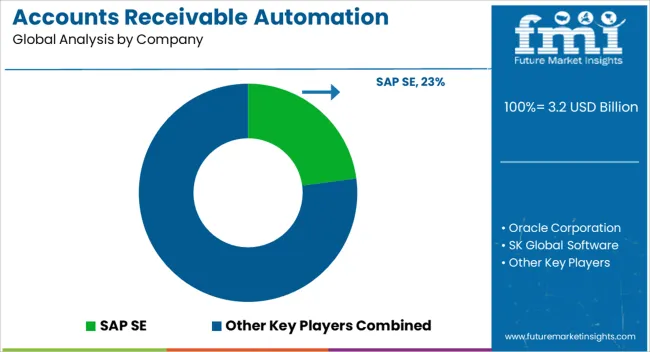
Accounts Receivable Automation Market Analysis By Company

SAP, Oracle, SK Global Software, Quadient, Kofax, Workday, Corcentric, HighRadius, Qvalia, MHC Automation, Comarch, and Esker among others are the top companies in this market. With a sizable accounts receivable automation market share, these main firms are concentrating on growing their consumer base in new countries. Businesses are adopting strategic collaborations to augment their profits and market share.

Moreover, mid- and small businesses are entering into new markets and gaining contracts to expand their presence. This is attained with the continuous product development with modern technologies.

Recent Developments

  • In May 2024, Esker partnered with KPMG France to assist businesses in shifting towards e-invoicing. The alliance may combine their respective expertise to accompany administrative and financial departments in their digital transformation.
  • In May 2024, Quadient announced the availability of its software-as-a-service (SaaS) accounts receivable automation solution, Yay-Pay fo small & medium businesses. This solution is available through web-based marketplace of Sage, a provider of cloud solutions. Partnering with Sage shall enable the company to build a fast-growing AR automation SaaS solution in the market.
  • In March 2024, HighRadius and Sage Intacct Inc. collaborated on Artificial intelligence (AI)-based autonomous systems for automating treasury and accounts receivables processes.
  • In January 2024, SAP SE received a seed investment for its new venture Paid Pronto. The application helps in automating accounts receivable processes.

Key Players

  • SAP SE
  • Oracle Corporation
  • SK Global Software
  • Quadient (YayPay Inc.)
  • Kofax Inc.
  • Workday, Inc.
  • Corcentric LLC
  • HighRadius Corporation
  • Qvalia AB
  • MHC Automation
  • Bill.com Holdings Inc.
  • Comarch SA
  • Esker Inc.

Key Segments Covered

By Component:

  • Solution
  • Services
  • Consulting and Implementation Services
  • Support and Maintenance Services
  • Other Components

By Deployment Mode:

  • On Premises
  • Cloud

By Organization Size:

  • Small and Medium Enterprises (SMEs)
  • Large Enterprises

By End-user Verticals:

  • Banking, Financial Services, an Insurance (BFSI) Sector
  • Information Technology (IT) and Telecom Sector
  • Manufacturing Sector
  • Consumer Goods and Retail Sector
  • Healthcare Sector
  • Energy and Utilities Sector
  • Other Sectors

By Region:

  • North America Market
  • Latin America Market
  • Europe Market
  • Asia Pacific Market
  • The Middle East and Africa (MEA) Market

Frequently Asked Questions

How big is the accounts receivable automation market in 2025?

The global accounts receivable automation market is estimated to be valued at USD 3.2 billion in 2025.

What will be the size of accounts receivable automation market in 2035?

The market size for the accounts receivable automation market is projected to reach USD 8.6 billion by 2035.

How much will be the accounts receivable automation market growth between 2025 and 2035?

The accounts receivable automation market is expected to grow at a 10.3% CAGR between 2025 and 2035.

What are the key product types in the accounts receivable automation market?

The key product types in accounts receivable automation market are solution, services, consulting and implementation services, support and maintenance services and other components.

Which deployment mode segment to contribute significant share in the accounts receivable automation market in 2025?

In terms of deployment mode, on premises segment to command 41.7% share in the accounts receivable automation market in 2025.

Table of Content

  1. Executive Summary
    • Global Market Outlook
    • Demand-side Trends
    • Supply-side Trends
    • Technology Roadmap Analysis
    • Analysis and Recommendations
  2. Market Overview
    • Market Coverage / Taxonomy
    • Market Definition / Scope / Limitations
  3. Market Background
    • Market Dynamics
      • Drivers
      • Restraints
      • Opportunity
      • Trends
    • Scenario Forecast
      • Demand in Optimistic Scenario
      • Demand in Likely Scenario
      • Demand in Conservative Scenario
    • Opportunity Map Analysis
    • Product Life Cycle Analysis
    • Supply Chain Analysis
    • Investment Feasibility Matrix
    • Value Chain Analysis
    • PESTLE and Porter’s Analysis
    • Regulatory Landscape
    • Regional Parent Market Outlook
    • Production and Consumption Statistics
    • Import and Export Statistics
  4. Global Market Analysis 2020 to 2024 and Forecast, 2025 to 2035
    • Historical Market Size Value (USD Million) Analysis, 2020 to 2024
    • Current and Future Market Size Value (USD Million) Projections, 2025 to 2035
      • Y-o-Y Growth Trend Analysis
      • Absolute $ Opportunity Analysis
  5. Global Market Pricing Analysis 2020 to 2024 and Forecast 2025 to 2035
  6. Global Market Analysis 2020 to 2024 and Forecast 2025 to 2035, By Component
    • Introduction / Key Findings
    • Historical Market Size Value (USD Million) Analysis By Component , 2020 to 2024
    • Current and Future Market Size Value (USD Million) Analysis and Forecast By Component , 2025 to 2035
      • Solution
      • Services
      • Consulting And Implementation Services
      • Support And Maintenance Services
      • Other Components
    • Y-o-Y Growth Trend Analysis By Component , 2020 to 2024
    • Absolute $ Opportunity Analysis By Component , 2025 to 2035
  7. Global Market Analysis 2020 to 2024 and Forecast 2025 to 2035, By Deployment Mode
    • Introduction / Key Findings
    • Historical Market Size Value (USD Million) Analysis By Deployment Mode, 2020 to 2024
    • Current and Future Market Size Value (USD Million) Analysis and Forecast By Deployment Mode, 2025 to 2035
      • On Premises
      • Cloud
    • Y-o-Y Growth Trend Analysis By Deployment Mode, 2020 to 2024
    • Absolute $ Opportunity Analysis By Deployment Mode, 2025 to 2035
  8. Global Market Analysis 2020 to 2024 and Forecast 2025 to 2035, By Organization Size
    • Introduction / Key Findings
    • Historical Market Size Value (USD Million) Analysis By Organization Size, 2020 to 2024
    • Current and Future Market Size Value (USD Million) Analysis and Forecast By Organization Size, 2025 to 2035
      • Small And Medium Enterprises (SMEs)
      • Large Enterprises
    • Y-o-Y Growth Trend Analysis By Organization Size, 2020 to 2024
    • Absolute $ Opportunity Analysis By Organization Size, 2025 to 2035
  9. Global Market Analysis 2020 to 2024 and Forecast 2025 to 2035, By End-User Verticals
    • Introduction / Key Findings
    • Historical Market Size Value (USD Million) Analysis By End-User Verticals, 2020 to 2024
    • Current and Future Market Size Value (USD Million) Analysis and Forecast By End-User Verticals, 2025 to 2035
      • Banking, Financial Services, And Insurance (BFSI) Sector
      • Information Technology (IT) And Telecom Sector
      • Manufacturing Sector
      • Consumer Goods And Retail Sector
      • Healthcare Sector
      • Energy And Utilities Sector
      • Other Sectors
    • Y-o-Y Growth Trend Analysis By End-User Verticals, 2020 to 2024
    • Absolute $ Opportunity Analysis By End-User Verticals, 2025 to 2035
  10. Global Market Analysis 2020 to 2024 and Forecast 2025 to 2035, By Region
    • Introduction
    • Historical Market Size Value (USD Million) Analysis By Region, 2020 to 2024
    • Current Market Size Value (USD Million) Analysis and Forecast By Region, 2025 to 2035
      • North America
      • Latin America
      • Western Europe
      • Eastern Europe
      • East Asia
      • South Asia and Pacific
      • Middle East & Africa
    • Market Attractiveness Analysis By Region
  11. North America Market Analysis 2020 to 2024 and Forecast 2025 to 2035, By Country
    • Historical Market Size Value (USD Million) Trend Analysis By Market Taxonomy, 2020 to 2024
    • Market Size Value (USD Million) Forecast By Market Taxonomy, 2025 to 2035
      • By Country
        • USA
        • Canada
        • Mexico
      • By Component
      • By Deployment Mode
      • By Organization Size
      • By End-User Verticals
    • Market Attractiveness Analysis
      • By Country
      • By Component
      • By Deployment Mode
      • By Organization Size
      • By End-User Verticals
    • Key Takeaways
  12. Latin America Market Analysis 2020 to 2024 and Forecast 2025 to 2035, By Country
    • Historical Market Size Value (USD Million) Trend Analysis By Market Taxonomy, 2020 to 2024
    • Market Size Value (USD Million) Forecast By Market Taxonomy, 2025 to 2035
      • By Country
        • Brazil
        • Chile
        • Rest of Latin America
      • By Component
      • By Deployment Mode
      • By Organization Size
      • By End-User Verticals
    • Market Attractiveness Analysis
      • By Country
      • By Component
      • By Deployment Mode
      • By Organization Size
      • By End-User Verticals
    • Key Takeaways
  13. Western Europe Market Analysis 2020 to 2024 and Forecast 2025 to 2035, By Country
    • Historical Market Size Value (USD Million) Trend Analysis By Market Taxonomy, 2020 to 2024
    • Market Size Value (USD Million) Forecast By Market Taxonomy, 2025 to 2035
      • By Country
        • Germany
        • UK
        • Italy
        • Spain
        • France
        • Nordic
        • BENELUX
        • Rest of Western Europe
      • By Component
      • By Deployment Mode
      • By Organization Size
      • By End-User Verticals
    • Market Attractiveness Analysis
      • By Country
      • By Component
      • By Deployment Mode
      • By Organization Size
      • By End-User Verticals
    • Key Takeaways
  14. Eastern Europe Market Analysis 2020 to 2024 and Forecast 2025 to 2035, By Country
    • Historical Market Size Value (USD Million) Trend Analysis By Market Taxonomy, 2020 to 2024
    • Market Size Value (USD Million) Forecast By Market Taxonomy, 2025 to 2035
      • By Country
        • Russia
        • Poland
        • Hungary
        • Balkan & Baltic
        • Rest of Eastern Europe
      • By Component
      • By Deployment Mode
      • By Organization Size
      • By End-User Verticals
    • Market Attractiveness Analysis
      • By Country
      • By Component
      • By Deployment Mode
      • By Organization Size
      • By End-User Verticals
    • Key Takeaways
  15. East Asia Market Analysis 2020 to 2024 and Forecast 2025 to 2035, By Country
    • Historical Market Size Value (USD Million) Trend Analysis By Market Taxonomy, 2020 to 2024
    • Market Size Value (USD Million) Forecast By Market Taxonomy, 2025 to 2035
      • By Country
        • China
        • Japan
        • South Korea
      • By Component
      • By Deployment Mode
      • By Organization Size
      • By End-User Verticals
    • Market Attractiveness Analysis
      • By Country
      • By Component
      • By Deployment Mode
      • By Organization Size
      • By End-User Verticals
    • Key Takeaways
  16. South Asia and Pacific Market Analysis 2020 to 2024 and Forecast 2025 to 2035, By Country
    • Historical Market Size Value (USD Million) Trend Analysis By Market Taxonomy, 2020 to 2024
    • Market Size Value (USD Million) Forecast By Market Taxonomy, 2025 to 2035
      • By Country
        • India
        • ASEAN
        • Australia & New Zealand
        • Rest of South Asia and Pacific
      • By Component
      • By Deployment Mode
      • By Organization Size
      • By End-User Verticals
    • Market Attractiveness Analysis
      • By Country
      • By Component
      • By Deployment Mode
      • By Organization Size
      • By End-User Verticals
    • Key Takeaways
  17. Middle East & Africa Market Analysis 2020 to 2024 and Forecast 2025 to 2035, By Country
    • Historical Market Size Value (USD Million) Trend Analysis By Market Taxonomy, 2020 to 2024
    • Market Size Value (USD Million) Forecast By Market Taxonomy, 2025 to 2035
      • By Country
        • Kingdom of Saudi Arabia
        • Other GCC Countries
        • Turkiye
        • South Africa
        • Other African Union
        • Rest of Middle East & Africa
      • By Component
      • By Deployment Mode
      • By Organization Size
      • By End-User Verticals
    • Market Attractiveness Analysis
      • By Country
      • By Component
      • By Deployment Mode
      • By Organization Size
      • By End-User Verticals
    • Key Takeaways
  18. Key Countries Market Analysis
    • USA
      • Pricing Analysis
      • Market Share Analysis, 2024
        • By Component
        • By Deployment Mode
        • By Organization Size
        • By End-User Verticals
    • Canada
      • Pricing Analysis
      • Market Share Analysis, 2024
        • By Component
        • By Deployment Mode
        • By Organization Size
        • By End-User Verticals
    • Mexico
      • Pricing Analysis
      • Market Share Analysis, 2024
        • By Component
        • By Deployment Mode
        • By Organization Size
        • By End-User Verticals
    • Brazil
      • Pricing Analysis
      • Market Share Analysis, 2024
        • By Component
        • By Deployment Mode
        • By Organization Size
        • By End-User Verticals
    • Chile
      • Pricing Analysis
      • Market Share Analysis, 2024
        • By Component
        • By Deployment Mode
        • By Organization Size
        • By End-User Verticals
    • Germany
      • Pricing Analysis
      • Market Share Analysis, 2024
        • By Component
        • By Deployment Mode
        • By Organization Size
        • By End-User Verticals
    • UK
      • Pricing Analysis
      • Market Share Analysis, 2024
        • By Component
        • By Deployment Mode
        • By Organization Size
        • By End-User Verticals
    • Italy
      • Pricing Analysis
      • Market Share Analysis, 2024
        • By Component
        • By Deployment Mode
        • By Organization Size
        • By End-User Verticals
    • Spain
      • Pricing Analysis
      • Market Share Analysis, 2024
        • By Component
        • By Deployment Mode
        • By Organization Size
        • By End-User Verticals
    • France
      • Pricing Analysis
      • Market Share Analysis, 2024
        • By Component
        • By Deployment Mode
        • By Organization Size
        • By End-User Verticals
    • India
      • Pricing Analysis
      • Market Share Analysis, 2024
        • By Component
        • By Deployment Mode
        • By Organization Size
        • By End-User Verticals
    • ASEAN
      • Pricing Analysis
      • Market Share Analysis, 2024
        • By Component
        • By Deployment Mode
        • By Organization Size
        • By End-User Verticals
    • Australia & New Zealand
      • Pricing Analysis
      • Market Share Analysis, 2024
        • By Component
        • By Deployment Mode
        • By Organization Size
        • By End-User Verticals
    • China
      • Pricing Analysis
      • Market Share Analysis, 2024
        • By Component
        • By Deployment Mode
        • By Organization Size
        • By End-User Verticals
    • Japan
      • Pricing Analysis
      • Market Share Analysis, 2024
        • By Component
        • By Deployment Mode
        • By Organization Size
        • By End-User Verticals
    • South Korea
      • Pricing Analysis
      • Market Share Analysis, 2024
        • By Component
        • By Deployment Mode
        • By Organization Size
        • By End-User Verticals
    • Russia
      • Pricing Analysis
      • Market Share Analysis, 2024
        • By Component
        • By Deployment Mode
        • By Organization Size
        • By End-User Verticals
    • Poland
      • Pricing Analysis
      • Market Share Analysis, 2024
        • By Component
        • By Deployment Mode
        • By Organization Size
        • By End-User Verticals
    • Hungary
      • Pricing Analysis
      • Market Share Analysis, 2024
        • By Component
        • By Deployment Mode
        • By Organization Size
        • By End-User Verticals
    • Kingdom of Saudi Arabia
      • Pricing Analysis
      • Market Share Analysis, 2024
        • By Component
        • By Deployment Mode
        • By Organization Size
        • By End-User Verticals
    • Turkiye
      • Pricing Analysis
      • Market Share Analysis, 2024
        • By Component
        • By Deployment Mode
        • By Organization Size
        • By End-User Verticals
    • South Africa
      • Pricing Analysis
      • Market Share Analysis, 2024
        • By Component
        • By Deployment Mode
        • By Organization Size
        • By End-User Verticals
  19. Market Structure Analysis
    • Competition Dashboard
    • Competition Benchmarking
    • Market Share Analysis of Top Players
      • By Regional
      • By Component
      • By Deployment Mode
      • By Organization Size
      • By End-User Verticals
  20. Competition Analysis
    • Competition Deep Dive
      • SAP SE
        • Overview
        • Product Portfolio
        • Profitability by Market Segments (Product/Age /Sales Channel/Region)
        • Sales Footprint
        • Strategy Overview
          • Marketing Strategy
          • Product Strategy
          • Channel Strategy
      • Oracle Corporation
      • SK Global Software
      • Quadient (YayPay Inc.)
      • Kofax Inc.
      • Workday, Inc.
      • Corcentric LLC
      • HighRadius Corporation
      • Qvalia AB
      • MHC Automation
      • Bill.com Holdings Inc.
      • Comarch SA
      • Esker Inc.
  21. Assumptions & Acronyms Used
  22. Research Methodology

List of Tables

  • Table 1: Global Market Value (USD Million) Forecast by Region, 2020-2035
  • Table 2: Global Market Value (USD Million) Forecast by Component , 2020-2035
  • Table 3: Global Market Value (USD Million) Forecast by Deployment Mode, 2020-2035
  • Table 4: Global Market Value (USD Million) Forecast by Organization Size, 2020-2035
  • Table 5: Global Market Value (USD Million) Forecast by End-User Verticals, 2020-2035
  • Table 6: North America Market Value (USD Million) Forecast by Country, 2020-2035
  • Table 7: North America Market Value (USD Million) Forecast by Component , 2020-2035
  • Table 8: North America Market Value (USD Million) Forecast by Deployment Mode, 2020-2035
  • Table 9: North America Market Value (USD Million) Forecast by Organization Size, 2020-2035
  • Table 10: North America Market Value (USD Million) Forecast by End-User Verticals, 2020-2035
  • Table 11: Latin America Market Value (USD Million) Forecast by Country, 2020-2035
  • Table 12: Latin America Market Value (USD Million) Forecast by Component , 2020-2035
  • Table 13: Latin America Market Value (USD Million) Forecast by Deployment Mode, 2020-2035
  • Table 14: Latin America Market Value (USD Million) Forecast by Organization Size, 2020-2035
  • Table 15: Latin America Market Value (USD Million) Forecast by End-User Verticals, 2020-2035
  • Table 16: Western Europe Market Value (USD Million) Forecast by Country, 2020-2035
  • Table 17: Western Europe Market Value (USD Million) Forecast by Component , 2020-2035
  • Table 18: Western Europe Market Value (USD Million) Forecast by Deployment Mode, 2020-2035
  • Table 19: Western Europe Market Value (USD Million) Forecast by Organization Size, 2020-2035
  • Table 20: Western Europe Market Value (USD Million) Forecast by End-User Verticals, 2020-2035
  • Table 21: Eastern Europe Market Value (USD Million) Forecast by Country, 2020-2035
  • Table 22: Eastern Europe Market Value (USD Million) Forecast by Component , 2020-2035
  • Table 23: Eastern Europe Market Value (USD Million) Forecast by Deployment Mode, 2020-2035
  • Table 24: Eastern Europe Market Value (USD Million) Forecast by Organization Size, 2020-2035
  • Table 25: Eastern Europe Market Value (USD Million) Forecast by End-User Verticals, 2020-2035
  • Table 26: East Asia Market Value (USD Million) Forecast by Country, 2020-2035
  • Table 27: East Asia Market Value (USD Million) Forecast by Component , 2020-2035
  • Table 28: East Asia Market Value (USD Million) Forecast by Deployment Mode, 2020-2035
  • Table 29: East Asia Market Value (USD Million) Forecast by Organization Size, 2020-2035
  • Table 30: East Asia Market Value (USD Million) Forecast by End-User Verticals, 2020-2035
  • Table 31: South Asia and Pacific Market Value (USD Million) Forecast by Country, 2020-2035
  • Table 32: South Asia and Pacific Market Value (USD Million) Forecast by Component , 2020-2035
  • Table 33: South Asia and Pacific Market Value (USD Million) Forecast by Deployment Mode, 2020-2035
  • Table 34: South Asia and Pacific Market Value (USD Million) Forecast by Organization Size, 2020-2035
  • Table 35: South Asia and Pacific Market Value (USD Million) Forecast by End-User Verticals, 2020-2035
  • Table 36: Middle East & Africa Market Value (USD Million) Forecast by Country, 2020-2035
  • Table 37: Middle East & Africa Market Value (USD Million) Forecast by Component , 2020-2035
  • Table 38: Middle East & Africa Market Value (USD Million) Forecast by Deployment Mode, 2020-2035
  • Table 39: Middle East & Africa Market Value (USD Million) Forecast by Organization Size, 2020-2035
  • Table 40: Middle East & Africa Market Value (USD Million) Forecast by End-User Verticals, 2020-2035

List of Figures

  • Figure 1: Global Market Pricing Analysis
  • Figure 2: Global Market Value (USD Million) Forecast 2020-2035
  • Figure 3: Global Market Value Share and BPS Analysis by Component , 2025 and 2035
  • Figure 4: Global Market Y-o-Y Growth Comparison by Component , 2025-2035
  • Figure 5: Global Market Attractiveness Analysis by Component
  • Figure 6: Global Market Value Share and BPS Analysis by Deployment Mode, 2025 and 2035
  • Figure 7: Global Market Y-o-Y Growth Comparison by Deployment Mode, 2025-2035
  • Figure 8: Global Market Attractiveness Analysis by Deployment Mode
  • Figure 9: Global Market Value Share and BPS Analysis by Organization Size, 2025 and 2035
  • Figure 10: Global Market Y-o-Y Growth Comparison by Organization Size, 2025-2035
  • Figure 11: Global Market Attractiveness Analysis by Organization Size
  • Figure 12: Global Market Value Share and BPS Analysis by End-User Verticals, 2025 and 2035
  • Figure 13: Global Market Y-o-Y Growth Comparison by End-User Verticals, 2025-2035
  • Figure 14: Global Market Attractiveness Analysis by End-User Verticals
  • Figure 15: Global Market Value (USD Million) Share and BPS Analysis by Region, 2025 and 2035
  • Figure 16: Global Market Y-o-Y Growth Comparison by Region, 2025-2035
  • Figure 17: Global Market Attractiveness Analysis by Region
  • Figure 18: North America Market Incremental Dollar Opportunity, 2025-2035
  • Figure 19: Latin America Market Incremental Dollar Opportunity, 2025-2035
  • Figure 20: Western Europe Market Incremental Dollar Opportunity, 2025-2035
  • Figure 21: Eastern Europe Market Incremental Dollar Opportunity, 2025-2035
  • Figure 22: East Asia Market Incremental Dollar Opportunity, 2025-2035
  • Figure 23: South Asia and Pacific Market Incremental Dollar Opportunity, 2025-2035
  • Figure 24: Middle East & Africa Market Incremental Dollar Opportunity, 2025-2035
  • Figure 25: North America Market Value Share and BPS Analysis by Country, 2025 and 2035
  • Figure 26: North America Market Value Share and BPS Analysis by Component , 2025 and 2035
  • Figure 27: North America Market Y-o-Y Growth Comparison by Component , 2025-2035
  • Figure 28: North America Market Attractiveness Analysis by Component
  • Figure 29: North America Market Value Share and BPS Analysis by Deployment Mode, 2025 and 2035
  • Figure 30: North America Market Y-o-Y Growth Comparison by Deployment Mode, 2025-2035
  • Figure 31: North America Market Attractiveness Analysis by Deployment Mode
  • Figure 32: North America Market Value Share and BPS Analysis by Organization Size, 2025 and 2035
  • Figure 33: North America Market Y-o-Y Growth Comparison by Organization Size, 2025-2035
  • Figure 34: North America Market Attractiveness Analysis by Organization Size
  • Figure 35: North America Market Value Share and BPS Analysis by End-User Verticals, 2025 and 2035
  • Figure 36: North America Market Y-o-Y Growth Comparison by End-User Verticals, 2025-2035
  • Figure 37: North America Market Attractiveness Analysis by End-User Verticals
  • Figure 38: Latin America Market Value Share and BPS Analysis by Country, 2025 and 2035
  • Figure 39: Latin America Market Value Share and BPS Analysis by Component , 2025 and 2035
  • Figure 40: Latin America Market Y-o-Y Growth Comparison by Component , 2025-2035
  • Figure 41: Latin America Market Attractiveness Analysis by Component
  • Figure 42: Latin America Market Value Share and BPS Analysis by Deployment Mode, 2025 and 2035
  • Figure 43: Latin America Market Y-o-Y Growth Comparison by Deployment Mode, 2025-2035
  • Figure 44: Latin America Market Attractiveness Analysis by Deployment Mode
  • Figure 45: Latin America Market Value Share and BPS Analysis by Organization Size, 2025 and 2035
  • Figure 46: Latin America Market Y-o-Y Growth Comparison by Organization Size, 2025-2035
  • Figure 47: Latin America Market Attractiveness Analysis by Organization Size
  • Figure 48: Latin America Market Value Share and BPS Analysis by End-User Verticals, 2025 and 2035
  • Figure 49: Latin America Market Y-o-Y Growth Comparison by End-User Verticals, 2025-2035
  • Figure 50: Latin America Market Attractiveness Analysis by End-User Verticals
  • Figure 51: Western Europe Market Value Share and BPS Analysis by Country, 2025 and 2035
  • Figure 52: Western Europe Market Value Share and BPS Analysis by Component , 2025 and 2035
  • Figure 53: Western Europe Market Y-o-Y Growth Comparison by Component , 2025-2035
  • Figure 54: Western Europe Market Attractiveness Analysis by Component
  • Figure 55: Western Europe Market Value Share and BPS Analysis by Deployment Mode, 2025 and 2035
  • Figure 56: Western Europe Market Y-o-Y Growth Comparison by Deployment Mode, 2025-2035
  • Figure 57: Western Europe Market Attractiveness Analysis by Deployment Mode
  • Figure 58: Western Europe Market Value Share and BPS Analysis by Organization Size, 2025 and 2035
  • Figure 59: Western Europe Market Y-o-Y Growth Comparison by Organization Size, 2025-2035
  • Figure 60: Western Europe Market Attractiveness Analysis by Organization Size
  • Figure 61: Western Europe Market Value Share and BPS Analysis by End-User Verticals, 2025 and 2035
  • Figure 62: Western Europe Market Y-o-Y Growth Comparison by End-User Verticals, 2025-2035
  • Figure 63: Western Europe Market Attractiveness Analysis by End-User Verticals
  • Figure 64: Eastern Europe Market Value Share and BPS Analysis by Country, 2025 and 2035
  • Figure 65: Eastern Europe Market Value Share and BPS Analysis by Component , 2025 and 2035
  • Figure 66: Eastern Europe Market Y-o-Y Growth Comparison by Component , 2025-2035
  • Figure 67: Eastern Europe Market Attractiveness Analysis by Component
  • Figure 68: Eastern Europe Market Value Share and BPS Analysis by Deployment Mode, 2025 and 2035
  • Figure 69: Eastern Europe Market Y-o-Y Growth Comparison by Deployment Mode, 2025-2035
  • Figure 70: Eastern Europe Market Attractiveness Analysis by Deployment Mode
  • Figure 71: Eastern Europe Market Value Share and BPS Analysis by Organization Size, 2025 and 2035
  • Figure 72: Eastern Europe Market Y-o-Y Growth Comparison by Organization Size, 2025-2035
  • Figure 73: Eastern Europe Market Attractiveness Analysis by Organization Size
  • Figure 74: Eastern Europe Market Value Share and BPS Analysis by End-User Verticals, 2025 and 2035
  • Figure 75: Eastern Europe Market Y-o-Y Growth Comparison by End-User Verticals, 2025-2035
  • Figure 76: Eastern Europe Market Attractiveness Analysis by End-User Verticals
  • Figure 77: East Asia Market Value Share and BPS Analysis by Country, 2025 and 2035
  • Figure 78: East Asia Market Value Share and BPS Analysis by Component , 2025 and 2035
  • Figure 79: East Asia Market Y-o-Y Growth Comparison by Component , 2025-2035
  • Figure 80: East Asia Market Attractiveness Analysis by Component
  • Figure 81: East Asia Market Value Share and BPS Analysis by Deployment Mode, 2025 and 2035
  • Figure 82: East Asia Market Y-o-Y Growth Comparison by Deployment Mode, 2025-2035
  • Figure 83: East Asia Market Attractiveness Analysis by Deployment Mode
  • Figure 84: East Asia Market Value Share and BPS Analysis by Organization Size, 2025 and 2035
  • Figure 85: East Asia Market Y-o-Y Growth Comparison by Organization Size, 2025-2035
  • Figure 86: East Asia Market Attractiveness Analysis by Organization Size
  • Figure 87: East Asia Market Value Share and BPS Analysis by End-User Verticals, 2025 and 2035
  • Figure 88: East Asia Market Y-o-Y Growth Comparison by End-User Verticals, 2025-2035
  • Figure 89: East Asia Market Attractiveness Analysis by End-User Verticals
  • Figure 90: South Asia and Pacific Market Value Share and BPS Analysis by Country, 2025 and 2035
  • Figure 91: South Asia and Pacific Market Value Share and BPS Analysis by Component , 2025 and 2035
  • Figure 92: South Asia and Pacific Market Y-o-Y Growth Comparison by Component , 2025-2035
  • Figure 93: South Asia and Pacific Market Attractiveness Analysis by Component
  • Figure 94: South Asia and Pacific Market Value Share and BPS Analysis by Deployment Mode, 2025 and 2035
  • Figure 95: South Asia and Pacific Market Y-o-Y Growth Comparison by Deployment Mode, 2025-2035
  • Figure 96: South Asia and Pacific Market Attractiveness Analysis by Deployment Mode
  • Figure 97: South Asia and Pacific Market Value Share and BPS Analysis by Organization Size, 2025 and 2035
  • Figure 98: South Asia and Pacific Market Y-o-Y Growth Comparison by Organization Size, 2025-2035
  • Figure 99: South Asia and Pacific Market Attractiveness Analysis by Organization Size
  • Figure 100: South Asia and Pacific Market Value Share and BPS Analysis by End-User Verticals, 2025 and 2035
  • Figure 101: South Asia and Pacific Market Y-o-Y Growth Comparison by End-User Verticals, 2025-2035
  • Figure 102: South Asia and Pacific Market Attractiveness Analysis by End-User Verticals
  • Figure 103: Middle East & Africa Market Value Share and BPS Analysis by Country, 2025 and 2035
  • Figure 104: Middle East & Africa Market Value Share and BPS Analysis by Component , 2025 and 2035
  • Figure 105: Middle East & Africa Market Y-o-Y Growth Comparison by Component , 2025-2035
  • Figure 106: Middle East & Africa Market Attractiveness Analysis by Component
  • Figure 107: Middle East & Africa Market Value Share and BPS Analysis by Deployment Mode, 2025 and 2035
  • Figure 108: Middle East & Africa Market Y-o-Y Growth Comparison by Deployment Mode, 2025-2035
  • Figure 109: Middle East & Africa Market Attractiveness Analysis by Deployment Mode
  • Figure 110: Middle East & Africa Market Value Share and BPS Analysis by Organization Size, 2025 and 2035
  • Figure 111: Middle East & Africa Market Y-o-Y Growth Comparison by Organization Size, 2025-2035
  • Figure 112: Middle East & Africa Market Attractiveness Analysis by Organization Size
  • Figure 113: Middle East & Africa Market Value Share and BPS Analysis by End-User Verticals, 2025 and 2035
  • Figure 114: Middle East & Africa Market Y-o-Y Growth Comparison by End-User Verticals, 2025-2035
  • Figure 115: Middle East & Africa Market Attractiveness Analysis by End-User Verticals
  • Figure 116: Global Market - Tier Structure Analysis
  • Figure 117: Global Market - Company Share Analysis
Dashboard
Dashboard
Dashboard
Dashboard
Dashboard
Dashboard

Full Research Suite comprises of:

Market outlook & trends analysis

Market outlook & trends analysis

Interviews & case studies

Interviews & case studies

Strategic recommendations

Strategic recommendations

Vendor profiles & capabilities analysis

Vendor profiles & capabilities analysis

5-year forecasts

5-year forecasts

8 regions and 60+ country-level data splits

8 regions and 60+ country-level data splits

Market segment data splits

Market segment data splits

12 months of continuous data updates

12 months of continuous data updates

DELIVERED AS:

PDF EXCEL ONLINE

Full Research Suite


$5000

$7500

$10000

Buy Report Now
Similar Industry Reports

Similar Industry Reports

Accounts Payable Automation Market

Accounts Payable Automation Market Analysis - Size, Share and Forecast 2025 to 2035

Automation Testing Market

Automation Testing Market Size and Share Forecast Outlook 2025 to 2035

Automation COE Market

Automation COE Market Insights by Organization Size, Service Type, End User Verticals, and Region through 2035

Lab Automation Market

Lab Automation Market Growth – Size, Trends & Forecast 2025 to 2035

Home Automation Sensors Market

Home Automation Sensors Market Size and Share Forecast Outlook 2025 to 2035

Home Automation Market

Home Automation Market Analysis by Product, Application, Networking Technology, and Region Through 2035

Form Automation Software Market

Form Automation Software Market – Digitizing Workflows

Hyperautomation Market

Hyperautomation Market

Water Automation & Instrumentation Market

Water Automation & Instrumentation Market Trends & Forecast by Process Stage, Automation Technology, Instrumentation, End-User and Region through 2035

Retail Automation Market

Retail Automation Market Size and Share Forecast Outlook 2025 to 2035

Postal Automation Systems Market

Postal Automation Systems Market Size and Share Forecast Outlook 2025 to 2035

Milking Automation Market

Milking Automation Market Size and Share Forecast Outlook 2025 to 2035

Process Automation and Instrumentation Market

Process Automation and Instrumentation Market Size and Share Forecast Outlook 2025 to 2035

Network Automation Market

Network Automation Market - AI & Cloud Connectivity 2025 to 2035

Factory Automation And Industrial Controls Market

Factory Automation And Industrial Controls Market Growth - Trends & Forecast 2025 to 2035

Machine Automation Controller Market

Machine Automation Controller Market Growth – Trends & Forecast 2025 to 2035

Medical Automation Market

Medical Automation Market Analysis - Innovations & Forecast 2025 to 2035

Process Automation and Instrumentation Market Share Analysis

Evaluating Process Automation and Instrumentation Market Share & Provider Insights

Content Automation AI Tools Market

Content Automation AI Tools Market

Building Automation System Market

Building Automation System Market Size and Share Forecast Outlook 2025 to 2035

Future Market Insights

Accounts Receivable Automation Market

Chat With MaRIA

Chat With

MaRIA

Hi There, I am MaRIA, Your Market Research Intelligence Assistant. How may I help you?