AHA Toners Market Size and Share Forecast Outlook 2025 to 2035

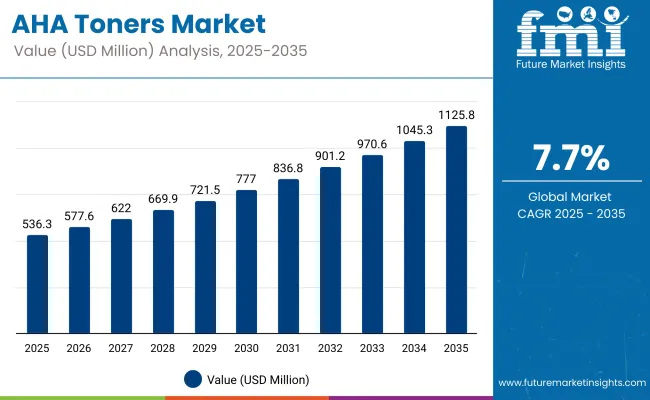
The AHA Toners Market is expected to record a valuation of USD 536.3 million in 2025 and USD 1125.8 million in 2035, which equals a growth of 110% over the decade. The overall expansion represents a CAGR of 7.7% and a 2.1X increase in market size.
Quick Stats for AHA Toners Market

  • AHA Toners Market Value (2025): USD 536.3 million
  • AHA Toners Market Forecast Value (2035): USD 1,125.8 million
  • AHA Toners Market Forecast CAGR: 7.7%
  • Leading Segment in AHA Toners Market in 2025: Glycolic Acid-based Toners (33.9%)
  • Key Growth Regions in the AHA Toners Market: North America, Asia-Pacific, Europe
  • Top Key Players in AHA Toners Market: The Ordinary, Paula’s Choice, Pixi Beauty, COSRX, REN Clean Skincare, Neogen Dermalogy, The Inkey List, Beauty of Joseon, Some By Mi, and Mario Badescu.

Aha Toners Market

AHA Toners Market Key Takeaways

Metric Value
Market Estimated Value (2025E) USD 536.3 million
Market Forecast Value (2035F) USD 1125.8 million
Forecast CAGR (2025 to 2035) 7.7%

During the first five-year period from 2025 to 2030, the market increases from USD 536.3 million to USD 876.8 million, adding USD 340.5 million, which accounts for 36.6% of the total decade growth. This phase records steady adoption across skincare routines, particularly within acne-prone, oily, and combination skin users, due to growing consumer awareness of exfoliation benefits. Glycolic acid-based toners dominate this period, accounting for over 33.9% of global product sales in 2025 due to their effectiveness in skin renewal applications.

The second half from 2030 to 2035 contributes USD 589.5 million, equal to 28.4% of total growth, as the market jumps from USD 876.8 million to USD 1125.8 million. This acceleration is powered by the rise of hybrid AHA blends, microbiome-friendly formulas, and active formulations suited for sensitive skin.

Premium segments and functional claims continue to grow in appeal, with cloud-based personalization platforms and e-commerce-exclusive AHA toner brands driving higher-margin revenues. By 2035, online-first retail channels are projected to contribute over 48.1% of the total market value, signaling a deep-rooted shift in product discovery and purchase behavior.

From 2020 to 2024, the AHA Toners Market grew from USD 322.1 million to USD 494.5 million, driven by increased adoption of glycolic acid and lactic acid-based skincare formulations across both mass and premium segments. During this period, the competitive landscape was dominated by skincare brands specializing in exfoliating treatments, with top players such as The Ordinary, Paula’s Choice, and COSRX together accounting for nearly 45% of market revenue.

Competitive differentiation relied on ingredient concentration, dermatological transparency, and consumer education through digital platforms. Product innovation centered on sensitivity-friendly formulas and layering compatibility with other actives. Service-based personalization remained limited, contributing less than 5% of total market value.

Demand for AHA toners is projected to reach USD 536.3 million in 2025, with the market shifting toward clinically-backed, multifunctional formulations that blend exfoliation with hydration, barrier repair, and anti-aging claims. By 2030, software-enabled skin diagnostics and AI-driven skincare recommendations are expected to raise the share of digital and personalized offerings to over 18%.

Traditional leaders are being challenged by emerging brands such as Beauty of Joseon, Neogen Dermalogy, and The Inkey List, which offer minimalist, skin-type specific solutions with transparent ingredient lists. Hybrid brand strategies are emerging, where routine-based subscription services, ingredient education, and dermatologist partnerships redefine the consumer touchpoint. The basis of competition is shifting from concentration and brand equity alone to holistic skin solutions, data-driven personalization, and omnichannel engagement capabilities.

Why the AHA Toners Market is growing?

AHA toners are gaining traction as brands integrate microbiome-balancing claims into exfoliating products, particularly glycolic and lactic acid-based toners. Instead of harsh stripping actions, newer formulations feature skin-friendly pH levels, prebiotic additives, and fermented botanicals to maintain the acid mantle and support the skin’s microbial diversity.

This shift has repositioned toners from secondary cleansing agents to primary skin health enhancers, driving adoption among users with sensitive and acne-prone skin. The science-backed narrative around barrier support and cell turnover synergy is reshaping consumer perception, prompting both clinical and clean beauty brands to invest in innovation within the AHA toner segment.

The growing popularity of “skin cycling” and acid layering routines on platforms like TikTok and Instagram has significantly influenced how AHA toners are used. Consumers are no longer applying toners sparingly but incorporating them on specific nights within curated routines to amplify results while avoiding irritation. As a result, repeat purchases and usage frequency have increased.

Brands have responded with differentiated AHA concentrations (5% to 15%) and product lines tailored to specific skin cycle stagesreset, exfoliate, hydrate, and repair. This behavior-driven segmentation has pushed both volume and value sales, accelerating AHA toner consumption across age groups and skin types.

Segmental Analysis

The market is segmented by product functionality, skin concern, ingredient format, distribution channel, end user, and region. Product functionalities include exfoliating, hydrating, pore-refining, brightening, firming, and multifunctional toners, reflecting varied consumer goals from surface renewal to dermal toning. Skin concern classification spans dullness, acne, hyperpigmentation, fine lines, and uneven texture, targeting specific dermo-corrective outcomes.

Based on ingredient format, segmentation includes glycolic acid, lactic acid, mandelic acid, citric acid, malic acid, tartaric acid, and blends, capturing differences in molecular size, penetration depth, and sensitivity compatibility. In terms of distribution channels, categories encompass beauty specialty stores, pharmacy chains, DTC brand websites, e-commerce aggregators, aesthetic dermatology clinics, and spas. End users include millennials, Gen Z, men’s skincare users, and mature skin segments, indicating personalization across age and gender lines. Regionally, the market spans North America, Latin America, Western and Eastern Europe, Central Asia, East Asia, South Asia and Pacific, and the Middle East and Africa.
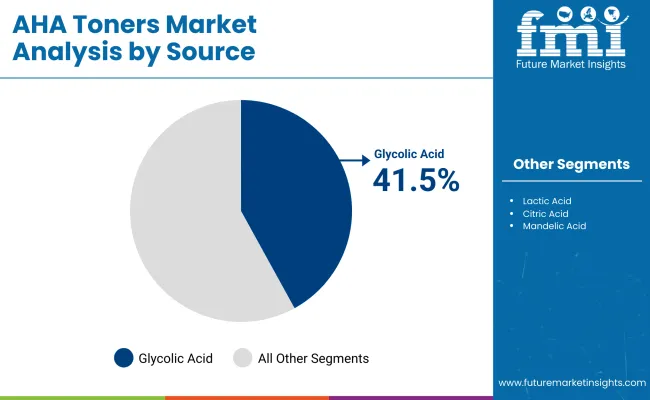
Insights into the Source Segment with Glycolic Acid Leading in Market Share

Aha Toners Market By Source

Source Value Share% 2025
Glycolic Acid 41.5%
Others 58.5%

The AHA toners market, segmented by source, shows glycolic acid leading with a projected 41.5% value share in 2025. This prominence is credited to its smaller molecular size, enabling deeper skin penetration and superior exfoliation efficacy. Glycolic acid’s dual appeal in anti-aging and acne-care formulations has elevated its presence across both clinical and mainstream skincare brands. Its compatibility with minimalist and clean-label trends further enhances its commercial appeal.

Glycolic acid’s regulatory acceptance across North America, Europe, and East Asia has supported widespread product launches, giving it an edge over alternative AHA types. Meanwhile, the ‘Others’ segment, accounting for 58.5%, remains diverse but lacks a single dominant acid, with lactic acid, mandelic acid, and citric acid occupying niche roles. Their limited penetration, either due to lower efficacy or regional formulation restrictions, has restricted their global share. As a result, glycolic acid is expected to remain the anchor ingredient in AHA toner formulations.
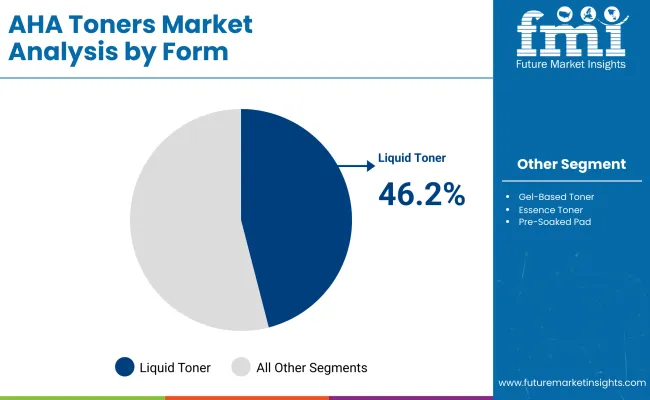
Insights into the Form Segment with Liquid Toners Dominating the Demand

Aha Toners Market By Form

Form Value Share% 2025
Liquid Toners 46.2%
Others 53.8%

In the AHA toners market, liquid toners are projected to capture 46.2% of the value share in 2025, making them the most preferred formulation format. Their ease of application, quick absorption, and compatibility with layering routines have reinforced their popularity across mass and premium skincare categories. Liquid toners also offer versatility across skin types and are often the first step in active-based regimens, enhancing their everyday usage appeal.

Despite the broader ‘Others’ segment accounting for 53.8%, it remains fragmented across emerging formats such as gel-based, mist, and pad-based toners. While these alternatives offer targeted delivery or convenience, they are generally positioned as niche or seasonal variants. In contrast, liquid toners continue to serve as the foundational delivery form for glycolic and lactic acid-based actives, enabling brands to position them as both effective and gentle. This entrenched consumer familiarity ensures that liquid toners will remain central to AHA product portfolios.

Insights into the Packaging Type Segment with Focus on Dispenser Bottles

Packaging Type Value Share% 2025
Dispenser Bottles 38.4%
Others 61.6%

Dispenser bottles are anticipated to account for 38.4% of the AHA toners market by value in 2025, underlining their functional appeal in skincare routines. Their controlled dispensing mechanism ensures hygienic usage and precise application, especially for formulations with active exfoliants like glycolic or lactic acid. Brands continue to favor dispenser formats for both mid-range and premium offerings to convey a clinical and efficacy-driven positioning.

The remaining 61.6% share is distributed among formats such as screw-cap bottles, pump sprays, mist cans, and pad jars. While these alternatives serve varying consumer preferences around portability or tactile experience, dispenser bottles retain strong association with stable, dermatologically-focused AHA toner products. This format is increasingly being adopted in travel-size SKUs and refillable packs as sustainability concerns grow, reinforcing its relevance. Their perceived convenience and alignment with routine skincare usage patterns will likely continue to support share stability over the forecast period.

What are the Drivers, Restraints, and Key Trends of the AHA Toners Market?

Growing Preference for Exfoliating Actives in Daily Skincare

Consumers are increasingly shifting away from traditional physical exfoliants and adopting chemical exfoliators such as alpha hydroxy acids (AHAs), especially glycolic and lactic acid, in their daily routines. AHA toners are viewed as essential for achieving smoother skin, refined texture, and better absorption of subsequent skincare products. As awareness grows regarding the long-term skin damage caused by abrasive scrubs, AHAs have gained favor for their mild yet effective exfoliating action.

Brands are responding with formulations containing low concentrations of glycolic acid (typically 3-7%), which can be safely used daily, even on sensitive skin. This shift aligns with the broader trend of “skinimalism,” where consumers seek multi-benefit products that offer exfoliation, hydration, and barrier support. The market has witnessed increased launches in the affordable luxury and masstige segments, making AHA toners more accessible to a wider demographic. The ability of AHAs to target concerns such as dullness, hyperpigmentation, acne scars, and early aging signs is reinforcing their role as a mainstay in modern skincare regimens.

Expansion of Dermatologist-Backed and Clinical Skincare Brands

The rapid growth of dermocosmetic brands and clinical skincare players has strongly influenced AHA toner adoption globally. These brands focus on evidence-backed actives, precise pH formulations, and ingredient transparency, positioning AHA toners as medically informed solutions for skin concerns. Products containing glycolic acid, often formulated with buffering agents or paired with calming ingredients like panthenol or allantoin, are being recommended for conditions like keratosis pilaris, mild acne, and melasma.

The rise of direct-to-consumer (DTC) clinical skincare startups has also democratized access to these potent formulations, previously available mainly through dermatologists or medical spas. In retail channels, dermatologist-endorsed brands enjoy growing shelf space across pharmacies, specialty beauty retailers, and online marketplaces. These players often emphasize controlled clinical trials, skin tolerance studies, and post-market safety evaluations, helping build trust among new adopters. The consistent messaging around efficacy and safety from clinical skincare brands has enabled glycolic acid toners to penetrate even risk-averse consumer segments, including those with sensitive or aging skin.

Skin Sensitivity and Irritation Risks Among First-Time Users

One of the key restraints affecting market expansion is the potential for skin irritation, especially among first-time users of AHA-based toners. Glycolic acid, while effective, is known to increase skin sensitivity, especially under sun exposure or when overused. New users who are unaware of pH concentration, frequency of application, or appropriate sun protection may experience stinging, redness, flaking, or purging effects.

These reactions, though common during exfoliation adjustments, are often misunderstood as product failures. Moreover, users with rosacea, eczema, or compromised skin barriers are advised to avoid AHAs or use them cautiously. This caution limits repeat purchases or deters usage in certain geographies with humid climates and high UV exposure. Negative reviews or dermatological concerns regarding barrier damage and photosensitivity often influence buyer perception. As a result, educational gaps around product layering, usage frequency, and pH compatibility pose a challenge to broader adoption, particularly in mass-market segments or among older age groups less familiar with active ingredient skincare.

Rise of Multi-Acid and pH-Balanced Toner Formulations

A significant trend reshaping the AHA toner market is the evolution toward multi-acid and pH-balanced formulations. Instead of single-ingredient glycolic acid toners, brands are introducing products that combine AHAs with beta hydroxy acids (BHAs) like salicylic acid or polyhydroxy acids (PHAs) for a more nuanced exfoliation strategy. These blended acids offer a spectrum of molecular weights and penetration levels, allowing products to target multiple skin layers while minimizing irritation.

Additionally, new formulas are incorporating humectants like hyaluronic acid and glycerin, along with soothing agents such as aloe vera, chamomile extract, and allantoin, to offset the drying effects of acids. Maintaining an optimal pH range (usually 3.5 to 4.0) is being prioritized to ensure efficacy while preserving skin barrier integrity. These innovations have broadened the target audience, enabling daily use across skin types including dry, sensitive, and acne-prone. The growing emphasis on product layering in multi-step routines, particularly in Asian and North American skincare regimens, is accelerating the adoption of such hybrid formulations that combine exfoliation with hydration and comfort.
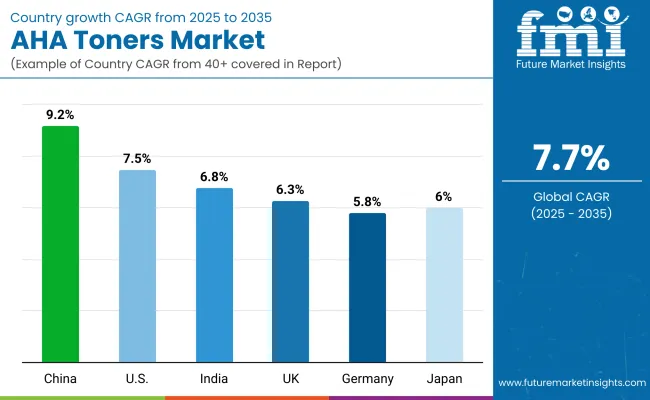
Analysis of AHA Toners Market By Key Countries

Aha Toners Market By Country

Countries Estimated CAGR (2025 to 2035)
China 9.2%
USA 7.5%
India 6.8%
UK 6.3%
Germany 5.8%
Japan 6.0%

The global AHA toners market displays significant regional variation in growth rates, shaped by consumer skincare awareness, ingredient transparency, and product innovation ecosystems. Asia-Pacific stands out as the most dynamic growth region, with China expected to grow at a robust CAGR of 9.2% and India following at 6.8%, driven by a rising middle class, increasing skincare literacy, and the growing popularity of exfoliating actives like glycolic acid and lactic acid.

Chinese consumers have shown a marked preference for multifunctional and dermatologist-recommended toners, supported by domestic brand innovation and strong e-commerce penetration. India’s demand, while still nascent, is gaining traction among Gen Z and millennial consumers seeking acne-control and skin-brightening solutions, often fueled by K-beauty influence and DTC brand visibility. In Europe, the UK (6.3%) and Germany (5.8%) are projected to maintain steady growth, backed by consumer demand for clean label formulations and sustainable packaging.

Regulatory scrutiny around ingredient safety in the EU further fosters trust in glycolic acid-based toners. Japan, with an estimated CAGR of 6.0%, remains a stable market due to its culture of preventive skincare and consistent retail presence of exfoliating products. The USA market, growing at 7.5%, continues to benefit from clinical skincare trends, dermatological endorsements, and high demand for ingredient-led formulations that cater to concerns like uneven tone, enlarged pores, and dullness.

Sales Outlook for AHA Toners in the United States

Year USA AHA Toners Market (USD Million)
2025 147.48
2026 155.61
2027 164.19
2028 173.23
2029 182.78
2030 192.85
2031 203.48
2032 214.69
2033 226.52
2034 239.01
2035 252.18

The AHA toners market in the United States is projected to expand at a CAGR of 5.5% between 2025 and 2035, with growth anchored in consumer demand for clinical-grade exfoliating solutions targeting dullness, uneven skin tone, and enlarged pores. Brands are witnessing strong traction through dermatologist-backed claims and active ingredient transparency, especially glycolic and lactic acids.

The rising preference for ingredient-led skincare has fueled demand among Gen Z and millennials, who prioritize efficacy and clarity in formulation. Additionally, the integration of AHA toners into multi-step regimens promoted by estheticians and beauty influencers has enhanced daily-use acceptance. E-commerce platforms and DTC skincare brands are accelerating access and education, further driving trial and repurchase behavior.

  • Skincare consumers are actively seeking ingredient-forward exfoliating solutions for skin tone refinement.
  • Clinical skincare trends have encouraged the adoption of glycolic acid toners backed by dermatological endorsements.
  • Direct-to-consumer channels are expanding accessibility while enhancing consumer education on exfoliation benefits.

Growth and Expansion Outlook for AHA Toners Market in the United Kingdom

The AHA Toners Market in the United Kingdom is projected to grow at a CAGR of 6.3% between 2025 and 2035, driven by rising consumer focus on skin resurfacing and exfoliation within daily routines. Demand has increased among consumers with acne-prone and sensitive skin, given the mild exfoliating action of AHAs. A growing preference for active ingredient-based skincare has spurred retail chains and e-commerce platforms in the UK to expand AHA toner listings, often bundling them with complementary serums or moisturizers.

The market is also gaining momentum among younger consumers due to education-led marketing campaigns on ingredient transparency and safe exfoliation practices. In the professional sector, dermatology clinics are increasingly recommending glycolic and lactic acid-based toners for post-treatment regimens. Brands are now investing in localized product formulations to comply with UK cosmetic standards and consumer preferences for fragrance-free, alcohol-free toners.

  • Youth-centric branding and ingredient education have broadened toner adoption.
  • Dermatology clinics are incorporating AHAs into aftercare solutions.
  • Online retailers are offering bundled AHA toner kits with exfoliates and moisturizers.

Growth and Expansion Outlook for AHA Toners Market in India

India is witnessing robust expansion in the AHA Toners Market, which is anticipated to register a CAGR of 6.8% through 2035, driven by the increasing adoption of skincare routines among urban and semi-urban consumers. The growing popularity of K-beauty trends, combined with social media influence and dermatologist-backed content, has accelerated demand for exfoliating toners featuring glycolic, lactic, and mandelic acids. AHA toners are gaining visibility among consumers in tier-2 and tier-3 cities as local beauty influencers, regional retail platforms, and vernacular campaigns demystify acid-based skincare.

Domestic brands are introducing budget-friendly formulations tailored for humid Indian climates, while premium international brands are expanding through partnerships with online beauty platforms and dermatology clinics. Salons and skincare clinics are also promoting mild AHA toners as part of monthly facials or chemical peel aftercare, further mainstreaming their use. The availability of fragrance-free, alcohol-free, and dermatologically tested variants is improving consumer confidence and repeat purchases.

  • AHA toners are becoming accessible in tier-2 and tier-3 cities via online beauty platforms.
  • Indian consumers are shifting toward ingredient-led skincare driven by K-beauty trends.
  • Local brands are launching climate-adapted AHA formulations at affordable prices.

Sales Outlook for AHA Toners in China

The AHA Toners Market in China is projected to grow at a CAGR of 9.2% through 2035, marking the highest pace among leading skincare economies. This momentum is being shaped by rapid digitization in beauty retail, domestic brand innovation, and increased consumer sophistication around exfoliating actives. Urban consumers are adopting AHA formulations for their brightening and skin-smoothing properties, while livestreaming platforms and social commerce are elevating consumer awareness through expert-led demonstrations and dermatologist-backed content.

In addition, China’s skin clinics and aesthetic centers are integrating AHA toners into post-procedure homecare, boosting clinical endorsement and frequency of use. Domestic brands are pushing competitive pricing and offering customized AHA blends targeted at acne-prone, dull, and sensitive skin types. Imports from Korean and Japanese players are also witnessing traction, particularly among premium-conscious Gen Z buyers. This convergence of demand across e-commerce, clinical channels, and youth-driven social platforms is positioning AHA toners as a staple in modern Chinese skincare regimens.

In-depth Analysis of AHA Toners in Germany

Countries 2025 Share (%)
USA 27.50%
China 18.30%
Japan 8.40%
Germany 7.60%
UK 6.80%
India 5.90%
Countries 2035 Share (%)
USA 22.40%
China 24.10%
Japan 8.10%
Germany 6.40%
UK 5.70%
India 7.40%

The AHA Toners Market in Germany is projected to experience a moderate decline in its global share, from 7.6% in 2025 to 6.4% by 2035, as consumer attention shifts to newer exfoliation formats. Germany, long regarded for its ingredient-savvy skincare market, is seeing stagnation in AHA toner innovation amid the rising appeal of polyhydroxy acids (PHAs) and postbiotic formulations.

While dermatology-endorsed AHA toners continue to perform well in pharmacies and specialist beauty retailers, broader mass-market growth is being held back by regulatory constraints around acid concentrations and mounting demand for gentler alternatives. Market activity is now focused on hybrid AHA products that pair exfoliation with skin barrier support, aligning with German consumers’ preference for minimalist and functional skincare. However, reduced shelf space for single-function toners and growing traction of essence-toners and liquid exfoliants are expected to reshape the category dynamics through 2035.

  • Hybrid AHA formats with ceramides or niacinamide are gaining ground in pharmacies.
  • Regulatory caution is driving brand reformulation and label transparency on acid content.
  • Toners with PHAs and microbiome-supporting actives are rising as preferred exfoliating choices.

Growth Outlook for AHA Toners Market in USA

USA By Source Value Share% 2025
Glycolic Acid 68.4%
Others 31.6%

The AHA Toners Market in the USA is poised for sustained dominance through 2035, with glycolic acid-based formulations accounting for 68.4% of the total value share in 2025. The segment’s continued strength stems from its established efficacy in chemical exfoliation, supported by high consumer awareness around anti-aging and skin-brightening benefits. American consumers have shown a strong preference for dermatologist-formulated products with clinically proven active ingredients, where glycolic acid has remained a staple in addressing hyperpigmentation, acne, and uneven skin tone.

The regulatory environment in the USA further supports the segment’s stability, allowing controlled usage of alpha hydroxy acids under FDA guidance. Additionally, skincare brands continue to innovate within the glycolic acid format, blending it with soothing agents like aloe vera or hyaluronic acid to improve tolerability. As premium skincare becomes increasingly ingredient-focused, glycolic acid has retained its position as the gold standard among AHAs. On the other hand, the ‘Others’ category comprising lactic, mandelic, and malic acids is gradually expanding, with growth driven by sensitive-skin users seeking gentler alternatives. However, it is unlikely to outpace glycolic acid in the near term given its comparatively lower potency and smaller consumer base in the USA market.

  • Glycolic acid toners dominate USA market with a 68.4% value share in 2025
  • Popularity reinforced by clinical backing, strong anti-aging efficacy, and consumer familiarity
  • Gentler AHA alternatives are growing, but remain niche compared to glycolic acid.

Opportunity Analysis of China AHA Toners Market

China By Form Value Share% 2025
Liquid Toners 38.7%
Others 61.3%

The AHA toners market in China presents notable growth opportunities, particularly in the evolving segment of non-liquid formats, which together account for 61.3% of the total value share in 2025. While liquid toners maintain a considerable 38.7% share, the shift toward innovative delivery formssuch as pads, essence gels, and emulsionsis reshaping consumer preferences. These alternative formats are being favored for their perceived convenience, better ingredient penetration, and compatibility with layering-based skincare routines, which are highly popular among Chinese consumers. The rise of multi-step regimens and demand for precision skincare have further encouraged companies to diversify beyond conventional water-based formulations.

At the same time, domestic and global brands are actively investing in sensorial textures and packaging innovation to attract digitally savvy, ingredient-conscious urban consumers. The liquid toner segment, although traditional, continues to perform steadily due to its affordability, ease of use, and broad availability across retail channels. However, the ‘Others’ category is expected to outpace liquid toners in growth as the market matures. Enhanced AHA stability in emulsified formats, rising disposable incomes, and the fusion of actives with K-beauty-inspired delivery systems are likely to unlock significant expansion potential in this segment.
  • Non-liquid AHA toners dominate China’s market with 61.3% value share in 2025
  • Growth driven by sensorial formats, multi-step routines, and delivery innovation
  • Liquid toners still relevant, but growth lags behind newer product forms

Competitive Landscape of AHA Toners Market

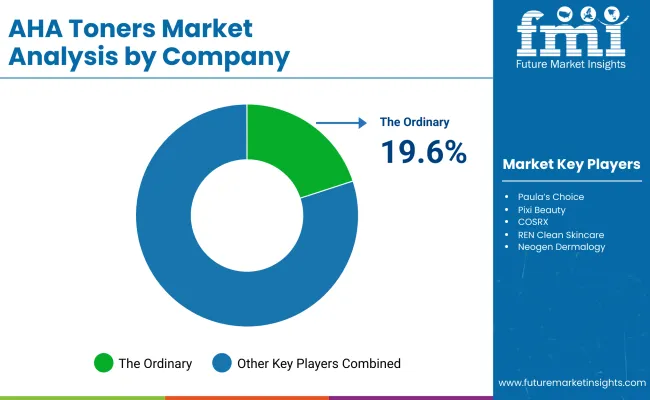
Aha Toners Market By Company

In 2025, The Ordinary is projected to command a dominant position in the global AHA toners market, accounting for an estimated 19.6% value share, while the remaining 80.4% of the market is distributed among various established and emerging players. Brands such as Paula’s Choice, Pixi Beauty, COSRX, REN Clean Skincare, NeogenDermalogy, The Inkey List, Beauty of Joseon, Some ByMi, and Mario Badescu are expected to compete within the 'Others' category. Despite The Ordinary’s stronghold, the broader market remains highly fragmented, with multiple brands targeting distinct consumer niches based on skin concerns, formulation preferences, and pricing strategies.

While some brands focus on minimalist, high-performance actives with affordable pricing, others emphasize clean beauty positioning, heritage formulation, or K-beauty trends. New product launches, ingredient transparency, and clinical efficacy claims have been shaping the competition. Differentiation in AHA concentrations, inclusion of complementary exfoliants like BHA or PHA, and formulation delivery systems are being increasingly used to capture consumer attention. Moreover, the DTC and e-commerce-led go-to-market strategies have enabled niche brands to scale rapidly across borders. As the global market matures, further competition is anticipated on the basis of product sensorial, skin barrier-supportive properties, and dermatologist-endorsed formulations.

Key Developments in AHA Toners Market

  • In January 2025, The Ordinary launched its complete skincare range, including the Glycolic Acid Toner, on Amazon’s Premium Beauty Hub. With Prime two-day shipping now available, the move significantly widened USA consumer access and is expected to drive higher trial rates, reinforcing the brand’s position as a go-to for affordable AHA exfoliants.
  • Beauty of Joseon released the 2024 version of its Green Plum Refreshing Toner, blending 2% glycolic acid (AHA) and 0.5% salicylic acid (BHA) with calming rice bran water and mung bean extract. The formulation reflects the trend of gentle multi-acid exfoliants and has gained popularity among global K-beauty consumers seeking balanced, skin-friendly toners.

Scope of the Report

Item Value
Quantitative Units USD 536.30 Million
Source Glycolic Acid, Lactic Acid, Citric Acid, Mandelic Acid, Malic & Tartaric Acid, and Multi-AHA Blends
Form Liquid Toners, Gel-Based Toners, Essence Toners, and Pre-Soaked Pads
Packaging Type Dispenser Bottles, Spray Bottles, Dropper Bottles, Pad Jars, and Travel-size Tubes
Distribution Channel Online Retail, Beauty Retail Chains, Dermatology Clinics & Salons, Drugstores & Pharmacies, and Supermarkets & Mass Retail
Application Face, Neck & Décolletage, Body (e.g., back, shoulders), and Intimate Areas
Regions Covered North America, Europe, Asia-Pacific, Latin America, Middle East & Africa
Country Covered United States, Canada, Germany, France, United Kingdom, China, Japan, India, Brazil, South Africa
Key Companies Profiled The Ordinary, Paula’s Choice, Pixi Beauty, COSRX, REN Clean Skincare, Neogen Dermalogy, The Inkey List, Beauty of Joseon, Some By Mi, and Mario Badescu.
Additional Attributes Dollar sales segmented by product type and application area, adoption trends in multi-functional skincare routines and dermocosmetic formulations, rising demand for sensitive-skin-compatible and dermatologist-tested AHA toners, segment-specific growth across face, neck, and body care categories, revenue segmentation by product format and packaging innovations, integration with skin tech devices and smart beauty diagnostics, regional trends shaped by clean beauty movements and regulatory updates, and product innovations driven by pH balancing, slow-release encapsulation, and exfoliation-enhancing delivery systems.

Key Segments

By Source:

  • Glycolic Acid
  • Lactic Acid
  • Citric Acid
  • Mandelic Acid
  • Malic & Tartaric Acid
  • Multi-AHA Blends

By Form:

  • Liquid Toners
  • Gel-Based Toners
  • Essence Toners
  • Pre-Soaked Pads

By Packaging Type:

  • Dispenser Bottles
  • Spray Bottles
  • Dropper Bottles
  • Pad Jars
  • Travel-size Tubes

By Distribution Channel:

  • Online Retail
  • Beauty Retail Chains
  • Dermatology Clinics & Salons
  • Drugstores & Pharmacies
  • Supermarkets & Mass Retail

By Application:

  • Face
  • Neck & Décolletage
  • Body (e.g., back, shoulders)
  • Intimate Areas

By Region:

  • North America
  • Latin America
  • Europe
  • East Asia
  • South Asia & Pacific
  • Middle East and Africa

Table of Content

  1. Executive Summary
    • Global Market Outlook
    • Demand-side Trends
    • Supply-side Trends
    • Technology Roadmap Analysis
    • Analysis and Recommendations
  2. Market Overview
    • Market Coverage / Taxonomy
    • Market Definition / Scope / Limitations
  3. Market Background
    • Market Dynamics
      • Drivers
      • Restraints
      • Opportunity
      • Trends
    • Scenario Forecast
      • Demand in Optimistic Scenario
      • Demand in Likely Scenario
      • Demand in Conservative Scenario
    • Opportunity Map Analysis
    • Product Life Cycle Analysis
    • Supply Chain Analysis
      • Supply Side Participants and their Roles
        • Producers
        • Mid-Level Participants (Traders/ Agents/ Brokers)
        • Wholesalers and Distributors
      • Value Added and Value Created at Node in the Supply Chain
      • List of Raw Material Suppliers
      • List of Existing and Potential Buyer’s
    • Investment Feasibility Matrix
    • Value Chain Analysis
      • Profit Margin Analysis
      • Wholesalers and Distributors
      • Retailers
    • PESTLE and Porter’s Analysis
    • Regulatory Landscape
      • By Key Regions
      • By Key Countries
    • Regional Parent Market Outlook
    • Production and Consumption Statistics
    • Import and Export Statistics
  4. Global Market Analysis 2020 to 2024 and Forecast, 2025 to 2035
    • Historical Market Size Value (USD Million) & Volume (Units) Analysis, 2020 to 2024
    • Current and Future Market Size Value (USD Million) & Volume (Units) Projections, 2025 to 2035
      • Y-o-Y Growth Trend Analysis
      • Absolute $ Opportunity Analysis
  5. Global Market Analysis 2020 to 2024 and Forecast 2025 to 2035, By Source
    • Introduction / Key Findings
    • Historical Market Size Value (USD Million) & Volume (Units) Analysis By Source, 2020 to 2024
    • Current and Future Market Size Value (USD Million) & Volume (Units) Analysis and Forecast By Source, 2025 to 2035
      • Glycolic Acid
      • Lactic Acid
      • Citric Acid
      • Mandelic Acid
      • Malic & Tartaric Acid
      • Multi-AHA Blends
    • Y-o-Y Growth Trend Analysis By Source, 2020 to 2024
    • Absolute $ Opportunity Analysis By Source, 2025 to 2035
  6. Global Market Analysis 2020 to 2024 and Forecast 2025 to 2035, By Form
    • Introduction / Key Findings
    • Historical Market Size Value (USD Million) & Volume (Units) Analysis By Form, 2020 to 2024
    • Current and Future Market Size Value (USD Million) & Volume (Units) Analysis and Forecast By Form, 2025 to 2035
      • Liquid Toners
      • Gel-Based Toners
      • Essence Toners
      • Pre-Soaked Pads
    • Y-o-Y Growth Trend Analysis By Form, 2020 to 2024
    • Absolute $ Opportunity Analysis By Form, 2025 to 2035
  7. Global Market Analysis 2020 to 2024 and Forecast 2025 to 2035, By Packaging Type
    • Introduction / Key Findings
    • Historical Market Size Value (USD Million) & Volume (Units) Analysis By Packaging Type, 2020 to 2024
    • Current and Future Market Size Value (USD Million) & Volume (Units) Analysis and Forecast By Packaging Type, 2025 to 2035
      • Dispenser Bottles
      • Spray Bottles
      • Dropper Bottles
      • Pad Jars
      • Travel-size Tubes
    • Y-o-Y Growth Trend Analysis By Packaging Type, 2020 to 2024
    • Absolute $ Opportunity Analysis By Packaging Type, 2025 to 2035
  8. Global Market Analysis 2020 to 2024 and Forecast 2025 to 2035, By Distribution Channel
    • Introduction / Key Findings
    • Historical Market Size Value (USD Million) & Volume (Units) Analysis By Distribution Channel, 2020 to 2024
    • Current and Future Market Size Value (USD Million) & Volume (Units) Analysis and Forecast By Distribution Channel, 2025 to 2035
      • Online Retail
      • Beauty Retail Chains
      • Dermatology Clinics & Salons
      • Drugstores & Pharmacies
      • Supermarkets & Mass Retail
    • Y-o-Y Growth Trend Analysis By Distribution Channel, 2020 to 2024
    • Absolute $ Opportunity Analysis By Distribution Channel, 2025 to 2035
  9. Global Market Analysis 2020 to 2024 and Forecast 2025 to 2035, By Application
    • Introduction / Key Findings
    • Historical Market Size Value (USD Million) & Volume (Units) Analysis By Application , 2020 to 2024
    • Current and Future Market Size Value (USD Million) & Volume (Units) Analysis and Forecast By Application , 2025 to 2035
      • Face
      • Neck & Décolletage
      • Body (e.g., back, shoulders)
      • Intimate Areas
    • Y-o-Y Growth Trend Analysis By Application , 2020 to 2024
    • Absolute $ Opportunity Analysis By Application , 2025 to 2035
  10. Global Market Analysis 2020 to 2024 and Forecast 2025 to 2035, By Region
    • Introduction
    • Historical Market Size Value (USD Million) & Volume (Units) Analysis By Region, 2020 to 2024
    • Current Market Size Value (USD Million) & Volume (Units) Analysis and Forecast By Region, 2025 to 2035
      • North America
      • Latin America
      • Europe
      • East Asia
      • South Asia & Pacific
      • Middle East and Africa
    • Market Attractiveness Analysis By Region
  11. North America Market Analysis 2020 to 2024 and Forecast 2025 to 2035, By Country
    • Historical Market Size Value (USD Million) & Volume (Units) Trend Analysis By Market Taxonomy, 2020 to 2024
    • Market Size Value (USD Million) & Volume (Units) Forecast By Market Taxonomy, 2025 to 2035
      • By Country
        • USA
        • Canada
      • By Source
      • By Form
      • By Packaging Type
      • By Distribution Channel
      • By Application
    • Market Attractiveness Analysis
      • By Country
      • By Source
      • By Form
      • By Packaging Type
      • By Distribution Channel
      • By Application
    • Key Takeaways
  12. Latin America Market Analysis 2020 to 2024 and Forecast 2025 to 2035, By Country
    • Historical Market Size Value (USD Million) & Volume (Units) Trend Analysis By Market Taxonomy, 2020 to 2024
    • Market Size Value (USD Million) & Volume (Units) Forecast By Market Taxonomy, 2025 to 2035
      • By Country
        • Brazil
        • Mexico
        • Colombia
        • Rest of Latin America
      • By Source
      • By Form
      • By Packaging Type
      • By Distribution Channel
      • By Application
    • Market Attractiveness Analysis
      • By Country
      • By Source
      • By Form
      • By Packaging Type
      • By Distribution Channel
      • By Application
    • Key Takeaways
  13. Europe Market Analysis 2020 to 2024 and Forecast 2025 to 2035, By Country
    • Historical Market Size Value (USD Million) & Volume (Units) Trend Analysis By Market Taxonomy, 2020 to 2024
    • Market Size Value (USD Million) & Volume (Units) Forecast By Market Taxonomy, 2025 to 2035
      • By Country
        • Germany
        • UK
        • France
        • Italy
        • Spain
        • Belgium
        • Netherlands
        • Nordic
        • Switzerland
        • Russia
        • Poland
        • Rest of Europe
      • By Source
      • By Form
      • By Packaging Type
      • By Distribution Channel
      • By Application
    • Market Attractiveness Analysis
      • By Country
      • By Source
      • By Form
      • By Packaging Type
      • By Distribution Channel
      • By Application
    • Key Takeaways
  14. East Asia Market Analysis 2020 to 2024 and Forecast 2025 to 2035, By Country
    • Historical Market Size Value (USD Million) & Volume (Units) Trend Analysis By Market Taxonomy, 2020 to 2024
    • Market Size Value (USD Million) & Volume (Units) Forecast By Market Taxonomy, 2025 to 2035
      • By Country
        • China
        • Japan
        • South Korea
      • By Source
      • By Form
      • By Packaging Type
      • By Distribution Channel
      • By Application
    • Market Attractiveness Analysis
      • By Country
      • By Source
      • By Form
      • By Packaging Type
      • By Distribution Channel
      • By Application
    • Key Takeaways
  15. South Asia & Pacific Market Analysis 2020 to 2024 and Forecast 2025 to 2035, By Country
    • Historical Market Size Value (USD Million) & Volume (Units) Trend Analysis By Market Taxonomy, 2020 to 2024
    • Market Size Value (USD Million) & Volume (Units) Forecast By Market Taxonomy, 2025 to 2035
      • By Country
        • India
        • Thailand
        • Malaysia
        • Indonesia
        • Singapore
        • Vietnam
        • Australia
        • New Zealand
        • Rest of South Asia
      • By Source
      • By Form
      • By Packaging Type
      • By Distribution Channel
      • By Application
    • Market Attractiveness Analysis
      • By Country
      • By Source
      • By Form
      • By Packaging Type
      • By Distribution Channel
      • By Application
    • Key Takeaways
  16. Middle East and Africa Market Analysis 2020 to 2024 and Forecast 2025 to 2035, By Country
    • Historical Market Size Value (USD Million) & Volume (Units) Trend Analysis By Market Taxonomy, 2020 to 2024
    • Market Size Value (USD Million) & Volume (Units) Forecast By Market Taxonomy, 2025 to 2035
      • By Country
        • Turkey
        • UAE
        • Saudi Arabia
        • Israel
        • Other GCC Countries
        • North Africa
        • South Africa
      • By Source
      • By Form
      • By Packaging Type
      • By Distribution Channel
      • By Application
    • Market Attractiveness Analysis
      • By Country
      • By Source
      • By Form
      • By Packaging Type
      • By Distribution Channel
      • By Application
    • Key Takeaways
  17. Key Countries Market Analysis
    • USA
      • Pricing Analysis
      • Market Share Analysis, 2024
        • By Source
        • By Form
        • By Packaging Type
        • By Distribution Channel
        • By Application
    • Canada
      • Pricing Analysis
      • Market Share Analysis, 2024
        • By Source
        • By Form
        • By Packaging Type
        • By Distribution Channel
        • By Application
    • Brazil
      • Pricing Analysis
      • Market Share Analysis, 2024
        • By Source
        • By Form
        • By Packaging Type
        • By Distribution Channel
        • By Application
    • Mexico
      • Pricing Analysis
      • Market Share Analysis, 2024
        • By Source
        • By Form
        • By Packaging Type
        • By Distribution Channel
        • By Application
    • Colombia
      • Pricing Analysis
      • Market Share Analysis, 2024
        • By Source
        • By Form
        • By Packaging Type
        • By Distribution Channel
        • By Application
    • Germany
      • Pricing Analysis
      • Market Share Analysis, 2024
        • By Source
        • By Form
        • By Packaging Type
        • By Distribution Channel
        • By Application
    • UK
      • Pricing Analysis
      • Market Share Analysis, 2024
        • By Source
        • By Form
        • By Packaging Type
        • By Distribution Channel
        • By Application
    • France
      • Pricing Analysis
      • Market Share Analysis, 2024
        • By Source
        • By Form
        • By Packaging Type
        • By Distribution Channel
        • By Application
    • Italy
      • Pricing Analysis
      • Market Share Analysis, 2024
        • By Source
        • By Form
        • By Packaging Type
        • By Distribution Channel
        • By Application
    • Spain
      • Pricing Analysis
      • Market Share Analysis, 2024
        • By Source
        • By Form
        • By Packaging Type
        • By Distribution Channel
        • By Application
    • Belgium
      • Pricing Analysis
      • Market Share Analysis, 2024
        • By Source
        • By Form
        • By Packaging Type
        • By Distribution Channel
        • By Application
    • Netherlands
      • Pricing Analysis
      • Market Share Analysis, 2024
        • By Source
        • By Form
        • By Packaging Type
        • By Distribution Channel
        • By Application
    • Nordic
      • Pricing Analysis
      • Market Share Analysis, 2024
        • By Source
        • By Form
        • By Packaging Type
        • By Distribution Channel
        • By Application
    • Switzerland
      • Pricing Analysis
      • Market Share Analysis, 2024
        • By Source
        • By Form
        • By Packaging Type
        • By Distribution Channel
        • By Application
    • Russia
      • Pricing Analysis
      • Market Share Analysis, 2024
        • By Source
        • By Form
        • By Packaging Type
        • By Distribution Channel
        • By Application
    • Poland
      • Pricing Analysis
      • Market Share Analysis, 2024
        • By Source
        • By Form
        • By Packaging Type
        • By Distribution Channel
        • By Application
    • China
      • Pricing Analysis
      • Market Share Analysis, 2024
        • By Source
        • By Form
        • By Packaging Type
        • By Distribution Channel
        • By Application
    • Japan
      • Pricing Analysis
      • Market Share Analysis, 2024
        • By Source
        • By Form
        • By Packaging Type
        • By Distribution Channel
        • By Application
    • South Korea
      • Pricing Analysis
      • Market Share Analysis, 2024
        • By Source
        • By Form
        • By Packaging Type
        • By Distribution Channel
        • By Application
    • India
      • Pricing Analysis
      • Market Share Analysis, 2024
        • By Source
        • By Form
        • By Packaging Type
        • By Distribution Channel
        • By Application
    • Thailand
      • Pricing Analysis
      • Market Share Analysis, 2024
        • By Source
        • By Form
        • By Packaging Type
        • By Distribution Channel
        • By Application
    • Indonesia
      • Pricing Analysis
      • Market Share Analysis, 2024
        • By Source
        • By Form
        • By Packaging Type
        • By Distribution Channel
        • By Application
    • Australia
      • Pricing Analysis
      • Market Share Analysis, 2024
        • By Source
        • By Form
        • By Packaging Type
        • By Distribution Channel
        • By Application
    • New Zealand
      • Pricing Analysis
      • Market Share Analysis, 2024
        • By Source
        • By Form
        • By Packaging Type
        • By Distribution Channel
        • By Application
    • Turkey
      • Pricing Analysis
      • Market Share Analysis, 2024
        • By Source
        • By Form
        • By Packaging Type
        • By Distribution Channel
        • By Application
    • UAE
      • Pricing Analysis
      • Market Share Analysis, 2024
        • By Source
        • By Form
        • By Packaging Type
        • By Distribution Channel
        • By Application
    • Saudi Arabia
      • Pricing Analysis
      • Market Share Analysis, 2024
        • By Source
        • By Form
        • By Packaging Type
        • By Distribution Channel
        • By Application
    • Israel
      • Pricing Analysis
      • Market Share Analysis, 2024
        • By Source
        • By Form
        • By Packaging Type
        • By Distribution Channel
        • By Application
    • North Africa
      • Pricing Analysis
      • Market Share Analysis, 2024
        • By Source
        • By Form
        • By Packaging Type
        • By Distribution Channel
        • By Application
    • South Africa
      • Pricing Analysis
      • Market Share Analysis, 2024
        • By Source
        • By Form
        • By Packaging Type
        • By Distribution Channel
        • By Application
  18. Market Structure Analysis
    • Competition Dashboard
    • Competition Benchmarking
    • Market Share Analysis of Top Players
      • By Regional
      • By Source
      • By Form
      • By Packaging Type
      • By Distribution Channel
      • By Application
  19. Competition Analysis
    • Competition Deep Dive
      • The Ordinary
        • Overview
        • Product Portfolio
        • Profitability by Market Segments (Product/Age /Sales Channel/Region)
        • Sales Footprint
        • Strategy Overview
          • Marketing Strategy
          • Product Strategy
          • Channel Strategy
      • Paula’s Choice
        • Overview
        • Product Portfolio
        • Profitability by Market Segments (Product/Age /Sales Channel/Region)
        • Sales Footprint
        • Strategy Overview
          • Marketing Strategy
          • Product Strategy
          • Channel Strategy
      • Pixi Beauty
        • Overview
        • Product Portfolio
        • Profitability by Market Segments (Product/Age /Sales Channel/Region)
        • Sales Footprint
        • Strategy Overview
          • Marketing Strategy
          • Product Strategy
          • Channel Strategy
      • COSRX
        • Overview
        • Product Portfolio
        • Profitability by Market Segments (Product/Age /Sales Channel/Region)
        • Sales Footprint
        • Strategy Overview
          • Marketing Strategy
          • Product Strategy
          • Channel Strategy
      • REN Clean Skincare
        • Overview
        • Product Portfolio
        • Profitability by Market Segments (Product/Age /Sales Channel/Region)
        • Sales Footprint
        • Strategy Overview
          • Marketing Strategy
          • Product Strategy
          • Channel Strategy
      • Neogen Dermalogy
        • Overview
        • Product Portfolio
        • Profitability by Market Segments (Product/Age /Sales Channel/Region)
        • Sales Footprint
        • Strategy Overview
          • Marketing Strategy
          • Product Strategy
          • Channel Strategy
      • The Inkey List
        • Overview
        • Product Portfolio
        • Profitability by Market Segments (Product/Age /Sales Channel/Region)
        • Sales Footprint
        • Strategy Overview
          • Marketing Strategy
          • Product Strategy
          • Channel Strategy
      • Beauty of Joseon
        • Overview
        • Product Portfolio
        • Profitability by Market Segments (Product/Age /Sales Channel/Region)
        • Sales Footprint
        • Strategy Overview
          • Marketing Strategy
          • Product Strategy
          • Channel Strategy
      • Some By Mi
        • Overview
        • Product Portfolio
        • Profitability by Market Segments (Product/Age /Sales Channel/Region)
        • Sales Footprint
        • Strategy Overview
          • Marketing Strategy
          • Product Strategy
          • Channel Strategy
      • Mario Badescu
        • Overview
        • Product Portfolio
        • Profitability by Market Segments (Product/Age /Sales Channel/Region)
        • Sales Footprint
        • Strategy Overview
          • Marketing Strategy
          • Product Strategy
          • Channel Strategy
      • Others
        • Overview
        • Product Portfolio
        • Profitability by Market Segments (Product/Age /Sales Channel/Region)
        • Sales Footprint
        • Strategy Overview
          • Marketing Strategy
          • Product Strategy
          • Channel Strategy
  20. Assumptions & Acronyms Used
  21. Research Methodology

List of Tables

  • Table 1: Global Market Value (USD Million) Forecast by Region, 2020-2035
  • Table 2: Global Market Volume (Units) Forecast by Region, 2020-2035
  • Table 3: Global Market Value (USD Million) Forecast by Source, 2020-2035
  • Table 4: Global Market Volume (Units) Forecast by Source, 2020-2035
  • Table 5: Global Market Value (USD Million) Forecast by Form, 2020-2035
  • Table 6: Global Market Volume (Units) Forecast by Form, 2020-2035
  • Table 7: Global Market Value (USD Million) Forecast by Packaging Type, 2020-2035
  • Table 8: Global Market Volume (Units) Forecast by Packaging Type, 2020-2035
  • Table 9: Global Market Value (USD Million) Forecast by Distribution Channel, 2020-2035
  • Table 10: Global Market Volume (Units) Forecast by Distribution Channel, 2020-2035
  • Table 11: Global Market Value (USD Million) Forecast by Application , 2020-2035
  • Table 12: Global Market Volume (Units) Forecast by Application , 2020-2035
  • Table 13: North America Market Value (USD Million) Forecast by Country, 2020-2035
  • Table 14: North America Market Volume (Units) Forecast by Country, 2020-2035
  • Table 15: North America Market Value (USD Million) Forecast by Source, 2020-2035
  • Table 16: North America Market Volume (Units) Forecast by Source, 2020-2035
  • Table 17: North America Market Value (USD Million) Forecast by Form, 2020-2035
  • Table 18: North America Market Volume (Units) Forecast by Form, 2020-2035
  • Table 19: North America Market Value (USD Million) Forecast by Packaging Type, 2020-2035
  • Table 20: North America Market Volume (Units) Forecast by Packaging Type, 2020-2035
  • Table 21: North America Market Value (USD Million) Forecast by Distribution Channel, 2020-2035
  • Table 22: North America Market Volume (Units) Forecast by Distribution Channel, 2020-2035
  • Table 23: North America Market Value (USD Million) Forecast by Application , 2020-2035
  • Table 24: North America Market Volume (Units) Forecast by Application , 2020-2035
  • Table 25: Latin America Market Value (USD Million) Forecast by Country, 2020-2035
  • Table 26: Latin America Market Volume (Units) Forecast by Country, 2020-2035
  • Table 27: Latin America Market Value (USD Million) Forecast by Source, 2020-2035
  • Table 28: Latin America Market Volume (Units) Forecast by Source, 2020-2035
  • Table 29: Latin America Market Value (USD Million) Forecast by Form, 2020-2035
  • Table 30: Latin America Market Volume (Units) Forecast by Form, 2020-2035
  • Table 31: Latin America Market Value (USD Million) Forecast by Packaging Type, 2020-2035
  • Table 32: Latin America Market Volume (Units) Forecast by Packaging Type, 2020-2035
  • Table 33: Latin America Market Value (USD Million) Forecast by Distribution Channel, 2020-2035
  • Table 34: Latin America Market Volume (Units) Forecast by Distribution Channel, 2020-2035
  • Table 35: Latin America Market Value (USD Million) Forecast by Application , 2020-2035
  • Table 36: Latin America Market Volume (Units) Forecast by Application , 2020-2035
  • Table 37: Europe Market Value (USD Million) Forecast by Country, 2020-2035
  • Table 38: Europe Market Volume (Units) Forecast by Country, 2020-2035
  • Table 39: Europe Market Value (USD Million) Forecast by Source, 2020-2035
  • Table 40: Europe Market Volume (Units) Forecast by Source, 2020-2035
  • Table 41: Europe Market Value (USD Million) Forecast by Form, 2020-2035
  • Table 42: Europe Market Volume (Units) Forecast by Form, 2020-2035
  • Table 43: Europe Market Value (USD Million) Forecast by Packaging Type, 2020-2035
  • Table 44: Europe Market Volume (Units) Forecast by Packaging Type, 2020-2035
  • Table 45: Europe Market Value (USD Million) Forecast by Distribution Channel, 2020-2035
  • Table 46: Europe Market Volume (Units) Forecast by Distribution Channel, 2020-2035
  • Table 47: Europe Market Value (USD Million) Forecast by Application , 2020-2035
  • Table 48: Europe Market Volume (Units) Forecast by Application , 2020-2035
  • Table 49: East Asia Market Value (USD Million) Forecast by Country, 2020-2035
  • Table 50: East Asia Market Volume (Units) Forecast by Country, 2020-2035
  • Table 51: East Asia Market Value (USD Million) Forecast by Source, 2020-2035
  • Table 52: East Asia Market Volume (Units) Forecast by Source, 2020-2035
  • Table 53: East Asia Market Value (USD Million) Forecast by Form, 2020-2035
  • Table 54: East Asia Market Volume (Units) Forecast by Form, 2020-2035
  • Table 55: East Asia Market Value (USD Million) Forecast by Packaging Type, 2020-2035
  • Table 56: East Asia Market Volume (Units) Forecast by Packaging Type, 2020-2035
  • Table 57: East Asia Market Value (USD Million) Forecast by Distribution Channel, 2020-2035
  • Table 58: East Asia Market Volume (Units) Forecast by Distribution Channel, 2020-2035
  • Table 59: East Asia Market Value (USD Million) Forecast by Application , 2020-2035
  • Table 60: East Asia Market Volume (Units) Forecast by Application , 2020-2035
  • Table 61: South Asia & Pacific Market Value (USD Million) Forecast by Country, 2020-2035
  • Table 62: South Asia & Pacific Market Volume (Units) Forecast by Country, 2020-2035
  • Table 63: South Asia & Pacific Market Value (USD Million) Forecast by Source, 2020-2035
  • Table 64: South Asia & Pacific Market Volume (Units) Forecast by Source, 2020-2035
  • Table 65: South Asia & Pacific Market Value (USD Million) Forecast by Form, 2020-2035
  • Table 66: South Asia & Pacific Market Volume (Units) Forecast by Form, 2020-2035
  • Table 67: South Asia & Pacific Market Value (USD Million) Forecast by Packaging Type, 2020-2035
  • Table 68: South Asia & Pacific Market Volume (Units) Forecast by Packaging Type, 2020-2035
  • Table 69: South Asia & Pacific Market Value (USD Million) Forecast by Distribution Channel, 2020-2035
  • Table 70: South Asia & Pacific Market Volume (Units) Forecast by Distribution Channel, 2020-2035
  • Table 71: South Asia & Pacific Market Value (USD Million) Forecast by Application , 2020-2035
  • Table 72: South Asia & Pacific Market Volume (Units) Forecast by Application , 2020-2035
  • Table 73: Middle East and Africa Market Value (USD Million) Forecast by Country, 2020-2035
  • Table 74: Middle East and Africa Market Volume (Units) Forecast by Country, 2020-2035
  • Table 75: Middle East and Africa Market Value (USD Million) Forecast by Source, 2020-2035
  • Table 76: Middle East and Africa Market Volume (Units) Forecast by Source, 2020-2035
  • Table 77: Middle East and Africa Market Value (USD Million) Forecast by Form, 2020-2035
  • Table 78: Middle East and Africa Market Volume (Units) Forecast by Form, 2020-2035
  • Table 79: Middle East and Africa Market Value (USD Million) Forecast by Packaging Type, 2020-2035
  • Table 80: Middle East and Africa Market Volume (Units) Forecast by Packaging Type, 2020-2035
  • Table 81: Middle East and Africa Market Value (USD Million) Forecast by Distribution Channel, 2020-2035
  • Table 82: Middle East and Africa Market Volume (Units) Forecast by Distribution Channel, 2020-2035
  • Table 83: Middle East and Africa Market Value (USD Million) Forecast by Application , 2020-2035
  • Table 84: Middle East and Africa Market Volume (Units) Forecast by Application , 2020-2035

List of Figures

  • Figure 1: Global Market Value (USD Million) by Source, 2025-2035
  • Figure 2: Global Market Value (USD Million) by Form, 2025-2035
  • Figure 3: Global Market Value (USD Million) by Packaging Type, 2025-2035
  • Figure 4: Global Market Value (USD Million) by Distribution Channel, 2025-2035
  • Figure 5: Global Market Value (USD Million) by Application , 2025-2035
  • Figure 6: Global Market Value (USD Million) by Region, 2025-2035
  • Figure 7: Global Market Value (USD Million) Analysis by Region, 2020-2035
  • Figure 8: Global Market Volume (Units) Analysis by Region, 2020-2035
  • Figure 9: Global Market Value Share (%) and BPS Analysis by Region, 2025-2035
  • Figure 10: Global Market Y-o-Y Growth (%) Projections by Region, 2025-2035
  • Figure 11: Global Market Value (USD Million) Analysis by Source, 2020-2035
  • Figure 12: Global Market Volume (Units) Analysis by Source, 2020-2035
  • Figure 13: Global Market Value Share (%) and BPS Analysis by Source, 2025-2035
  • Figure 14: Global Market Y-o-Y Growth (%) Projections by Source, 2025-2035
  • Figure 15: Global Market Value (USD Million) Analysis by Form, 2020-2035
  • Figure 16: Global Market Volume (Units) Analysis by Form, 2020-2035
  • Figure 17: Global Market Value Share (%) and BPS Analysis by Form, 2025-2035
  • Figure 18: Global Market Y-o-Y Growth (%) Projections by Form, 2025-2035
  • Figure 19: Global Market Value (USD Million) Analysis by Packaging Type, 2020-2035
  • Figure 20: Global Market Volume (Units) Analysis by Packaging Type, 2020-2035
  • Figure 21: Global Market Value Share (%) and BPS Analysis by Packaging Type, 2025-2035
  • Figure 22: Global Market Y-o-Y Growth (%) Projections by Packaging Type, 2025-2035
  • Figure 23: Global Market Value (USD Million) Analysis by Distribution Channel, 2020-2035
  • Figure 24: Global Market Volume (Units) Analysis by Distribution Channel, 2020-2035
  • Figure 25: Global Market Value Share (%) and BPS Analysis by Distribution Channel, 2025-2035
  • Figure 26: Global Market Y-o-Y Growth (%) Projections by Distribution Channel, 2025-2035
  • Figure 27: Global Market Value (USD Million) Analysis by Application , 2020-2035
  • Figure 28: Global Market Volume (Units) Analysis by Application , 2020-2035
  • Figure 29: Global Market Value Share (%) and BPS Analysis by Application , 2025-2035
  • Figure 30: Global Market Y-o-Y Growth (%) Projections by Application , 2025-2035
  • Figure 31: Global Market Attractiveness by Source, 2025-2035
  • Figure 32: Global Market Attractiveness by Form, 2025-2035
  • Figure 33: Global Market Attractiveness by Packaging Type, 2025-2035
  • Figure 34: Global Market Attractiveness by Distribution Channel, 2025-2035
  • Figure 35: Global Market Attractiveness by Application , 2025-2035
  • Figure 36: Global Market Attractiveness by Region, 2025-2035
  • Figure 37: North America Market Value (USD Million) by Source, 2025-2035
  • Figure 38: North America Market Value (USD Million) by Form, 2025-2035
  • Figure 39: North America Market Value (USD Million) by Packaging Type, 2025-2035
  • Figure 40: North America Market Value (USD Million) by Distribution Channel, 2025-2035
  • Figure 41: North America Market Value (USD Million) by Application , 2025-2035
  • Figure 42: North America Market Value (USD Million) by Country, 2025-2035
  • Figure 43: North America Market Value (USD Million) Analysis by Country, 2020-2035
  • Figure 44: North America Market Volume (Units) Analysis by Country, 2020-2035
  • Figure 45: North America Market Value Share (%) and BPS Analysis by Country, 2025-2035
  • Figure 46: North America Market Y-o-Y Growth (%) Projections by Country, 2025-2035
  • Figure 47: North America Market Value (USD Million) Analysis by Source, 2020-2035
  • Figure 48: North America Market Volume (Units) Analysis by Source, 2020-2035
  • Figure 49: North America Market Value Share (%) and BPS Analysis by Source, 2025-2035
  • Figure 50: North America Market Y-o-Y Growth (%) Projections by Source, 2025-2035
  • Figure 51: North America Market Value (USD Million) Analysis by Form, 2020-2035
  • Figure 52: North America Market Volume (Units) Analysis by Form, 2020-2035
  • Figure 53: North America Market Value Share (%) and BPS Analysis by Form, 2025-2035
  • Figure 54: North America Market Y-o-Y Growth (%) Projections by Form, 2025-2035
  • Figure 55: North America Market Value (USD Million) Analysis by Packaging Type, 2020-2035
  • Figure 56: North America Market Volume (Units) Analysis by Packaging Type, 2020-2035
  • Figure 57: North America Market Value Share (%) and BPS Analysis by Packaging Type, 2025-2035
  • Figure 58: North America Market Y-o-Y Growth (%) Projections by Packaging Type, 2025-2035
  • Figure 59: North America Market Value (USD Million) Analysis by Distribution Channel, 2020-2035
  • Figure 60: North America Market Volume (Units) Analysis by Distribution Channel, 2020-2035
  • Figure 61: North America Market Value Share (%) and BPS Analysis by Distribution Channel, 2025-2035
  • Figure 62: North America Market Y-o-Y Growth (%) Projections by Distribution Channel, 2025-2035
  • Figure 63: North America Market Value (USD Million) Analysis by Application , 2020-2035
  • Figure 64: North America Market Volume (Units) Analysis by Application , 2020-2035
  • Figure 65: North America Market Value Share (%) and BPS Analysis by Application , 2025-2035
  • Figure 66: North America Market Y-o-Y Growth (%) Projections by Application , 2025-2035
  • Figure 67: North America Market Attractiveness by Source, 2025-2035
  • Figure 68: North America Market Attractiveness by Form, 2025-2035
  • Figure 69: North America Market Attractiveness by Packaging Type, 2025-2035
  • Figure 70: North America Market Attractiveness by Distribution Channel, 2025-2035
  • Figure 71: North America Market Attractiveness by Application , 2025-2035
  • Figure 72: North America Market Attractiveness by Country, 2025-2035
  • Figure 73: Latin America Market Value (USD Million) by Source, 2025-2035
  • Figure 74: Latin America Market Value (USD Million) by Form, 2025-2035
  • Figure 75: Latin America Market Value (USD Million) by Packaging Type, 2025-2035
  • Figure 76: Latin America Market Value (USD Million) by Distribution Channel, 2025-2035
  • Figure 77: Latin America Market Value (USD Million) by Application , 2025-2035
  • Figure 78: Latin America Market Value (USD Million) by Country, 2025-2035
  • Figure 79: Latin America Market Value (USD Million) Analysis by Country, 2020-2035
  • Figure 80: Latin America Market Volume (Units) Analysis by Country, 2020-2035
  • Figure 81: Latin America Market Value Share (%) and BPS Analysis by Country, 2025-2035
  • Figure 82: Latin America Market Y-o-Y Growth (%) Projections by Country, 2025-2035
  • Figure 83: Latin America Market Value (USD Million) Analysis by Source, 2020-2035
  • Figure 84: Latin America Market Volume (Units) Analysis by Source, 2020-2035
  • Figure 85: Latin America Market Value Share (%) and BPS Analysis by Source, 2025-2035
  • Figure 86: Latin America Market Y-o-Y Growth (%) Projections by Source, 2025-2035
  • Figure 87: Latin America Market Value (USD Million) Analysis by Form, 2020-2035
  • Figure 88: Latin America Market Volume (Units) Analysis by Form, 2020-2035
  • Figure 89: Latin America Market Value Share (%) and BPS Analysis by Form, 2025-2035
  • Figure 90: Latin America Market Y-o-Y Growth (%) Projections by Form, 2025-2035
  • Figure 91: Latin America Market Value (USD Million) Analysis by Packaging Type, 2020-2035
  • Figure 92: Latin America Market Volume (Units) Analysis by Packaging Type, 2020-2035
  • Figure 93: Latin America Market Value Share (%) and BPS Analysis by Packaging Type, 2025-2035
  • Figure 94: Latin America Market Y-o-Y Growth (%) Projections by Packaging Type, 2025-2035
  • Figure 95: Latin America Market Value (USD Million) Analysis by Distribution Channel, 2020-2035
  • Figure 96: Latin America Market Volume (Units) Analysis by Distribution Channel, 2020-2035
  • Figure 97: Latin America Market Value Share (%) and BPS Analysis by Distribution Channel, 2025-2035
  • Figure 98: Latin America Market Y-o-Y Growth (%) Projections by Distribution Channel, 2025-2035
  • Figure 99: Latin America Market Value (USD Million) Analysis by Application , 2020-2035
  • Figure 100: Latin America Market Volume (Units) Analysis by Application , 2020-2035
  • Figure 101: Latin America Market Value Share (%) and BPS Analysis by Application , 2025-2035
  • Figure 102: Latin America Market Y-o-Y Growth (%) Projections by Application , 2025-2035
  • Figure 103: Latin America Market Attractiveness by Source, 2025-2035
  • Figure 104: Latin America Market Attractiveness by Form, 2025-2035
  • Figure 105: Latin America Market Attractiveness by Packaging Type, 2025-2035
  • Figure 106: Latin America Market Attractiveness by Distribution Channel, 2025-2035
  • Figure 107: Latin America Market Attractiveness by Application , 2025-2035
  • Figure 108: Latin America Market Attractiveness by Country, 2025-2035
  • Figure 109: Europe Market Value (USD Million) by Source, 2025-2035
  • Figure 110: Europe Market Value (USD Million) by Form, 2025-2035
  • Figure 111: Europe Market Value (USD Million) by Packaging Type, 2025-2035
  • Figure 112: Europe Market Value (USD Million) by Distribution Channel, 2025-2035
  • Figure 113: Europe Market Value (USD Million) by Application , 2025-2035
  • Figure 114: Europe Market Value (USD Million) by Country, 2025-2035
  • Figure 115: Europe Market Value (USD Million) Analysis by Country, 2020-2035
  • Figure 116: Europe Market Volume (Units) Analysis by Country, 2020-2035
  • Figure 117: Europe Market Value Share (%) and BPS Analysis by Country, 2025-2035
  • Figure 118: Europe Market Y-o-Y Growth (%) Projections by Country, 2025-2035
  • Figure 119: Europe Market Value (USD Million) Analysis by Source, 2020-2035
  • Figure 120: Europe Market Volume (Units) Analysis by Source, 2020-2035
  • Figure 121: Europe Market Value Share (%) and BPS Analysis by Source, 2025-2035
  • Figure 122: Europe Market Y-o-Y Growth (%) Projections by Source, 2025-2035
  • Figure 123: Europe Market Value (USD Million) Analysis by Form, 2020-2035
  • Figure 124: Europe Market Volume (Units) Analysis by Form, 2020-2035
  • Figure 125: Europe Market Value Share (%) and BPS Analysis by Form, 2025-2035
  • Figure 126: Europe Market Y-o-Y Growth (%) Projections by Form, 2025-2035
  • Figure 127: Europe Market Value (USD Million) Analysis by Packaging Type, 2020-2035
  • Figure 128: Europe Market Volume (Units) Analysis by Packaging Type, 2020-2035
  • Figure 129: Europe Market Value Share (%) and BPS Analysis by Packaging Type, 2025-2035
  • Figure 130: Europe Market Y-o-Y Growth (%) Projections by Packaging Type, 2025-2035
  • Figure 131: Europe Market Value (USD Million) Analysis by Distribution Channel, 2020-2035
  • Figure 132: Europe Market Volume (Units) Analysis by Distribution Channel, 2020-2035
  • Figure 133: Europe Market Value Share (%) and BPS Analysis by Distribution Channel, 2025-2035
  • Figure 134: Europe Market Y-o-Y Growth (%) Projections by Distribution Channel, 2025-2035
  • Figure 135: Europe Market Value (USD Million) Analysis by Application , 2020-2035
  • Figure 136: Europe Market Volume (Units) Analysis by Application , 2020-2035
  • Figure 137: Europe Market Value Share (%) and BPS Analysis by Application , 2025-2035
  • Figure 138: Europe Market Y-o-Y Growth (%) Projections by Application , 2025-2035
  • Figure 139: Europe Market Attractiveness by Source, 2025-2035
  • Figure 140: Europe Market Attractiveness by Form, 2025-2035
  • Figure 141: Europe Market Attractiveness by Packaging Type, 2025-2035
  • Figure 142: Europe Market Attractiveness by Distribution Channel, 2025-2035
  • Figure 143: Europe Market Attractiveness by Application , 2025-2035
  • Figure 144: Europe Market Attractiveness by Country, 2025-2035
  • Figure 145: East Asia Market Value (USD Million) by Source, 2025-2035
  • Figure 146: East Asia Market Value (USD Million) by Form, 2025-2035
  • Figure 147: East Asia Market Value (USD Million) by Packaging Type, 2025-2035
  • Figure 148: East Asia Market Value (USD Million) by Distribution Channel, 2025-2035
  • Figure 149: East Asia Market Value (USD Million) by Application , 2025-2035
  • Figure 150: East Asia Market Value (USD Million) by Country, 2025-2035
  • Figure 151: East Asia Market Value (USD Million) Analysis by Country, 2020-2035
  • Figure 152: East Asia Market Volume (Units) Analysis by Country, 2020-2035
  • Figure 153: East Asia Market Value Share (%) and BPS Analysis by Country, 2025-2035
  • Figure 154: East Asia Market Y-o-Y Growth (%) Projections by Country, 2025-2035
  • Figure 155: East Asia Market Value (USD Million) Analysis by Source, 2020-2035
  • Figure 156: East Asia Market Volume (Units) Analysis by Source, 2020-2035
  • Figure 157: East Asia Market Value Share (%) and BPS Analysis by Source, 2025-2035
  • Figure 158: East Asia Market Y-o-Y Growth (%) Projections by Source, 2025-2035
  • Figure 159: East Asia Market Value (USD Million) Analysis by Form, 2020-2035
  • Figure 160: East Asia Market Volume (Units) Analysis by Form, 2020-2035
  • Figure 161: East Asia Market Value Share (%) and BPS Analysis by Form, 2025-2035
  • Figure 162: East Asia Market Y-o-Y Growth (%) Projections by Form, 2025-2035
  • Figure 163: East Asia Market Value (USD Million) Analysis by Packaging Type, 2020-2035
  • Figure 164: East Asia Market Volume (Units) Analysis by Packaging Type, 2020-2035
  • Figure 165: East Asia Market Value Share (%) and BPS Analysis by Packaging Type, 2025-2035
  • Figure 166: East Asia Market Y-o-Y Growth (%) Projections by Packaging Type, 2025-2035
  • Figure 167: East Asia Market Value (USD Million) Analysis by Distribution Channel, 2020-2035
  • Figure 168: East Asia Market Volume (Units) Analysis by Distribution Channel, 2020-2035
  • Figure 169: East Asia Market Value Share (%) and BPS Analysis by Distribution Channel, 2025-2035
  • Figure 170: East Asia Market Y-o-Y Growth (%) Projections by Distribution Channel, 2025-2035
  • Figure 171: East Asia Market Value (USD Million) Analysis by Application , 2020-2035
  • Figure 172: East Asia Market Volume (Units) Analysis by Application , 2020-2035
  • Figure 173: East Asia Market Value Share (%) and BPS Analysis by Application , 2025-2035
  • Figure 174: East Asia Market Y-o-Y Growth (%) Projections by Application , 2025-2035
  • Figure 175: East Asia Market Attractiveness by Source, 2025-2035
  • Figure 176: East Asia Market Attractiveness by Form, 2025-2035
  • Figure 177: East Asia Market Attractiveness by Packaging Type, 2025-2035
  • Figure 178: East Asia Market Attractiveness by Distribution Channel, 2025-2035
  • Figure 179: East Asia Market Attractiveness by Application , 2025-2035
  • Figure 180: East Asia Market Attractiveness by Country, 2025-2035
  • Figure 181: South Asia & Pacific Market Value (USD Million) by Source, 2025-2035
  • Figure 182: South Asia & Pacific Market Value (USD Million) by Form, 2025-2035
  • Figure 183: South Asia & Pacific Market Value (USD Million) by Packaging Type, 2025-2035
  • Figure 184: South Asia & Pacific Market Value (USD Million) by Distribution Channel, 2025-2035
  • Figure 185: South Asia & Pacific Market Value (USD Million) by Application , 2025-2035
  • Figure 186: South Asia & Pacific Market Value (USD Million) by Country, 2025-2035
  • Figure 187: South Asia & Pacific Market Value (USD Million) Analysis by Country, 2020-2035
  • Figure 188: South Asia & Pacific Market Volume (Units) Analysis by Country, 2020-2035
  • Figure 189: South Asia & Pacific Market Value Share (%) and BPS Analysis by Country, 2025-2035
  • Figure 190: South Asia & Pacific Market Y-o-Y Growth (%) Projections by Country, 2025-2035
  • Figure 191: South Asia & Pacific Market Value (USD Million) Analysis by Source, 2020-2035
  • Figure 192: South Asia & Pacific Market Volume (Units) Analysis by Source, 2020-2035
  • Figure 193: South Asia & Pacific Market Value Share (%) and BPS Analysis by Source, 2025-2035
  • Figure 194: South Asia & Pacific Market Y-o-Y Growth (%) Projections by Source, 2025-2035
  • Figure 195: South Asia & Pacific Market Value (USD Million) Analysis by Form, 2020-2035
  • Figure 196: South Asia & Pacific Market Volume (Units) Analysis by Form, 2020-2035
  • Figure 197: South Asia & Pacific Market Value Share (%) and BPS Analysis by Form, 2025-2035
  • Figure 198: South Asia & Pacific Market Y-o-Y Growth (%) Projections by Form, 2025-2035
  • Figure 199: South Asia & Pacific Market Value (USD Million) Analysis by Packaging Type, 2020-2035
  • Figure 200: South Asia & Pacific Market Volume (Units) Analysis by Packaging Type, 2020-2035
  • Figure 201: South Asia & Pacific Market Value Share (%) and BPS Analysis by Packaging Type, 2025-2035
  • Figure 202: South Asia & Pacific Market Y-o-Y Growth (%) Projections by Packaging Type, 2025-2035
  • Figure 203: South Asia & Pacific Market Value (USD Million) Analysis by Distribution Channel, 2020-2035
  • Figure 204: South Asia & Pacific Market Volume (Units) Analysis by Distribution Channel, 2020-2035
  • Figure 205: South Asia & Pacific Market Value Share (%) and BPS Analysis by Distribution Channel, 2025-2035
  • Figure 206: South Asia & Pacific Market Y-o-Y Growth (%) Projections by Distribution Channel, 2025-2035
  • Figure 207: South Asia & Pacific Market Value (USD Million) Analysis by Application , 2020-2035
  • Figure 208: South Asia & Pacific Market Volume (Units) Analysis by Application , 2020-2035
  • Figure 209: South Asia & Pacific Market Value Share (%) and BPS Analysis by Application , 2025-2035
  • Figure 210: South Asia & Pacific Market Y-o-Y Growth (%) Projections by Application , 2025-2035
  • Figure 211: South Asia & Pacific Market Attractiveness by Source, 2025-2035
  • Figure 212: South Asia & Pacific Market Attractiveness by Form, 2025-2035
  • Figure 213: South Asia & Pacific Market Attractiveness by Packaging Type, 2025-2035
  • Figure 214: South Asia & Pacific Market Attractiveness by Distribution Channel, 2025-2035
  • Figure 215: South Asia & Pacific Market Attractiveness by Application , 2025-2035
  • Figure 216: South Asia & Pacific Market Attractiveness by Country, 2025-2035
  • Figure 217: Middle East and Africa Market Value (USD Million) by Source, 2025-2035
  • Figure 218: Middle East and Africa Market Value (USD Million) by Form, 2025-2035
  • Figure 219: Middle East and Africa Market Value (USD Million) by Packaging Type, 2025-2035
  • Figure 220: Middle East and Africa Market Value (USD Million) by Distribution Channel, 2025-2035
  • Figure 221: Middle East and Africa Market Value (USD Million) by Application , 2025-2035
  • Figure 222: Middle East and Africa Market Value (USD Million) by Country, 2025-2035
  • Figure 223: Middle East and Africa Market Value (USD Million) Analysis by Country, 2020-2035
  • Figure 224: Middle East and Africa Market Volume (Units) Analysis by Country, 2020-2035
  • Figure 225: Middle East and Africa Market Value Share (%) and BPS Analysis by Country, 2025-2035
  • Figure 226: Middle East and Africa Market Y-o-Y Growth (%) Projections by Country, 2025-2035
  • Figure 227: Middle East and Africa Market Value (USD Million) Analysis by Source, 2020-2035
  • Figure 228: Middle East and Africa Market Volume (Units) Analysis by Source, 2020-2035
  • Figure 229: Middle East and Africa Market Value Share (%) and BPS Analysis by Source, 2025-2035
  • Figure 230: Middle East and Africa Market Y-o-Y Growth (%) Projections by Source, 2025-2035
  • Figure 231: Middle East and Africa Market Value (USD Million) Analysis by Form, 2020-2035
  • Figure 232: Middle East and Africa Market Volume (Units) Analysis by Form, 2020-2035
  • Figure 233: Middle East and Africa Market Value Share (%) and BPS Analysis by Form, 2025-2035
  • Figure 234: Middle East and Africa Market Y-o-Y Growth (%) Projections by Form, 2025-2035
  • Figure 235: Middle East and Africa Market Value (USD Million) Analysis by Packaging Type, 2020-2035
  • Figure 236: Middle East and Africa Market Volume (Units) Analysis by Packaging Type, 2020-2035
  • Figure 237: Middle East and Africa Market Value Share (%) and BPS Analysis by Packaging Type, 2025-2035
  • Figure 238: Middle East and Africa Market Y-o-Y Growth (%) Projections by Packaging Type, 2025-2035
  • Figure 239: Middle East and Africa Market Value (USD Million) Analysis by Distribution Channel, 2020-2035
  • Figure 240: Middle East and Africa Market Volume (Units) Analysis by Distribution Channel, 2020-2035
  • Figure 241: Middle East and Africa Market Value Share (%) and BPS Analysis by Distribution Channel, 2025-2035
  • Figure 242: Middle East and Africa Market Y-o-Y Growth (%) Projections by Distribution Channel, 2025-2035
  • Figure 243: Middle East and Africa Market Value (USD Million) Analysis by Application , 2020-2035
  • Figure 244: Middle East and Africa Market Volume (Units) Analysis by Application , 2020-2035
  • Figure 245: Middle East and Africa Market Value Share (%) and BPS Analysis by Application , 2025-2035
  • Figure 246: Middle East and Africa Market Y-o-Y Growth (%) Projections by Application , 2025-2035
  • Figure 247: Middle East and Africa Market Attractiveness by Source, 2025-2035
  • Figure 248: Middle East and Africa Market Attractiveness by Form, 2025-2035
  • Figure 249: Middle East and Africa Market Attractiveness by Packaging Type, 2025-2035
  • Figure 250: Middle East and Africa Market Attractiveness by Distribution Channel, 2025-2035
  • Figure 251: Middle East and Africa Market Attractiveness by Application , 2025-2035
  • Figure 252: Middle East and Africa Market Attractiveness by Country, 2025-2035

Frequently Asked Questions

How big is the AHA Toners Market in 2025?

The global AHA Toners Market is estimated to be valued at USD 536.30 million in 2025.

What will be the size of AHA Toners Market in 2035?

The market size for the AHA Toners Market is projected to reach USD 1125.8 million by 2035.

How much will be the AHA Toners Market growth between 2025 and 2035?

The AHA Toners Market is expected to grow at a 7.7% CAGR between 2025 and 2035.

What are the key product types in the AHA Toners Market?

The key product types in the AHA Toners Market include Glycolic Acid Toners, Lactic Acid Toners, Citric Acid Toners, Mandelic Acid Toners, and Multi-AHA Blends.

Which source is expected to contribute a significant share in the AHA Toners Market in 2025?

In terms of source, the Glycolic Acid segment is expected to command a 41.5% share in the AHA Toners Market in 2025, owing to its compatibility with exfoliating and brightening routines.

Explore Similar Insights

Future Market Insights

AHA Toners Market