Witch Hazel Toners Market Size and Share Forecast Outlook 2025 to 2035

The Witch Hazel Toners Market is expected to record a valuation of USD 1,052.1 million in 2025 and USD 3,102.1 million in 2035, with an increase of USD 2,050 million, representing a growth of nearly 193% over the decade. This overall expansion translates into a CAGR of 11.4%, reflecting a more than 2X increase in market size.
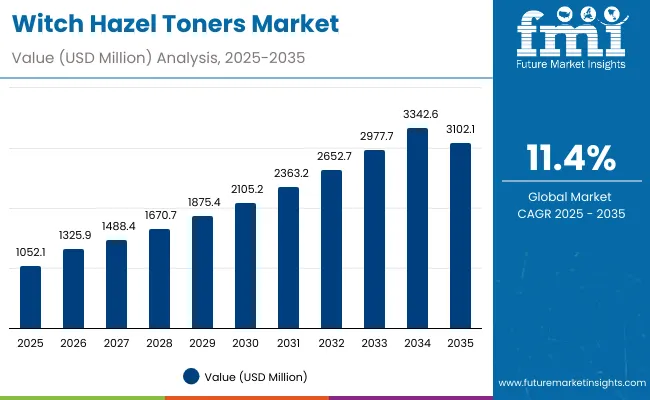
Quick Stats for Witch Hazel Toners Market

  • Witch Hazel Toners Market Value (2025): USD 1,052.1 million
  • Witch Hazel Toners Market Forecast Value (2035): USD 3,102.1 million
  • Witch Hazel Toners Market Forecast CAGR (2025 to 2035): 11.4%
  • Leading Segment in 2025 (Formulation): Alcohol-free (54.2%)
  • Key Growth Regions: Asia-Pacific (China, India, Japan), Europe, North America
  • Top Key Players: Thayers, Dickinson’s, Humphreys, Mario Badescu, The Ordinary, Pixi, Neutrogena, Paula’s Choice, e.l.f. Cosmetics, Kiehl’s, Forest Essentials

Witch Hazel Toners Market

Witch Hazel Toners Market Key Takeaways

Metric Value
Witch Hazel Toners Market Estimated Value in (2025E) USD 1,052.1 million
Witch Hazel Toners Market Forecast Value in (2035F) USD 3,102.1 million
Forecast CAGR (2025 to 2035) 11.4%

During the first five-year period from 2025 to 2030, the market grows from USD 1,052.1 million to USD 2,105.2 million, adding USD 1,053.1 million, which accounts for about 51% of the total decade growth. This phase is marked by steady adoption of alcohol-free formulations and oil-control toners, with strong traction in e-commerce channels and premium positioning in acne-care routines.

The second half from 2030 to 2035 contributes USD 996.9 million, equal to nearly 49% of total growth, as the market expands from USD 2,105.2 million to USD 3,102.1 million. This acceleration is driven by premium innovation in actives-infused toners (niacinamide, salicylic acid blends), sustainable packaging adoption, and deeper penetration in Asia-Pacific markets. Clean-label and hypoallergenic claims gain prominence, while Europe and North America see consolidation of heritage and premium skincare brands leveraging witch hazel toners.

From 2020 to 2024, the Witch Hazel Toners Market recorded steady growth, moving from niche natural skincare adoption to mainstream positioning across drugstores and e-commerce platforms. This early phase was dominated by heritage brands like Thayers and Dickinson’s, which controlled a significant share through alcohol-free and fragrance-free formulations. Differentiation centered on gentleness, natural sourcing, and acne/oil-control positioning, with premium entrants like The Ordinary and Paula’s Choice accelerating uptake through actives-infused blends.

By 2025, demand for witch hazel toners expands sharply, reaching USD 1,052.1 million, with revenue mix shifting toward alcohol-free, clean-label, and hypoallergenic claims. Traditional leaders face growing competition from indie and digital-first skincare brands leveraging social media-driven marketing and subscription-based product models. E-commerce strengthens its role as the largest channel, while Asia-Pacific markets emerge as key growth drivers. Competitive advantage is now moving away from brand heritage alone toward ingredient innovation, sustainable packaging, and holistic ecosystem positioning that blends wellness, natural actives, and clinical validation.

Why the Witch Hazel Toners Market is growing?

The rising preference for alcohol-free skincare products is a key driver of the Witch Hazel Toners Market. Consumers are increasingly cautious about harsh formulations that strip natural oils, opting instead for gentle, soothing alternatives. Witch hazel toners formulated without alcohol cater to this demand by balancing oil control with hydration, making them suitable for sensitive and acne-prone skin. This positioning has allowed the segment to capture over half the market share, reinforcing its long-term growth trajectory.

The growth of e-commerce platforms and digital-first retail strategies has significantly boosted the availability of witch hazel toners across diverse consumer segments. Brands leverage online marketplaces and social media campaigns to target millennials and Gen Z, who value convenience, transparency, and product authenticity. Subscription models and influencer partnerships further accelerate consumer adoption. This digital shift not only democratizes access to premium and clean-label witch hazel formulations but also amplifies global reach, fueling sustained double-digit growth rates.

Segmental Analysis

The Witch Hazel Toners Market is segmented by function, formulation, product type, distribution channel, claim, and geography. Functional categories include oil control, soothing & redness reduction, pore minimizing, and acne/blemish treatment, reflecting the broad dermatological benefits of witch hazel. By formulation, the market is divided into alcohol-free, alcohol-based, and blends with actives such as niacinamide or salicylic acid, with alcohol-free dominating in 2025. Product types span toners, mists, pads, and essences, catering to different skincare routines. Key distribution channels include e-commerce, pharmacies/drugstores, specialty beauty retail, and mass retail. Claims such as clean-label, fragrance-free, vegan, and hypoallergenic define product positioning and brand identity. Regionally, the market covers North America, Latin America, Europe, East Asia, South Asia & Pacific, and the Middle East & Africa, with China, India, Japan, the USA, Germany, and the UK emerging as high-growth countries.
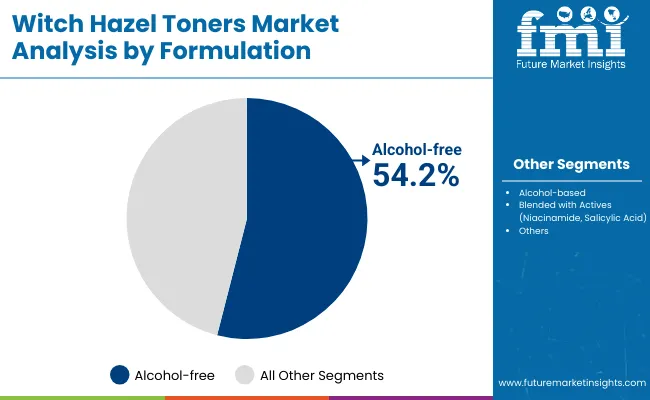
Insights into the Formulation Segment with Alcohol-Free Leading in Market Share

Witch Hazel Toners Market By Formulation

Formulation Value Share% 2025
Alcohol-free 54.2%
Others 45.8%

The alcohol-free segment is projected to contribute 54.2% of the Witch Hazel Toners Market revenue in 2025, maintaining its lead as the dominant formulation type. This growth is driven by increasing consumer preference for gentle skincare solutions that avoid irritation, dryness, or sensitivity associated with alcohol-based products. Alcohol-free toners are strongly positioned among acne-prone and sensitive-skin consumers, aligning with global clean-label and hypoallergenic trends. The segment also benefits from premium branding in serums and mists, often blended with actives such as niacinamide or salicylic acid. With the rising importance of natural, safe, and multifunctional skincare, the alcohol-free category is expected to remain the backbone of witch hazel toner demand through 2035.
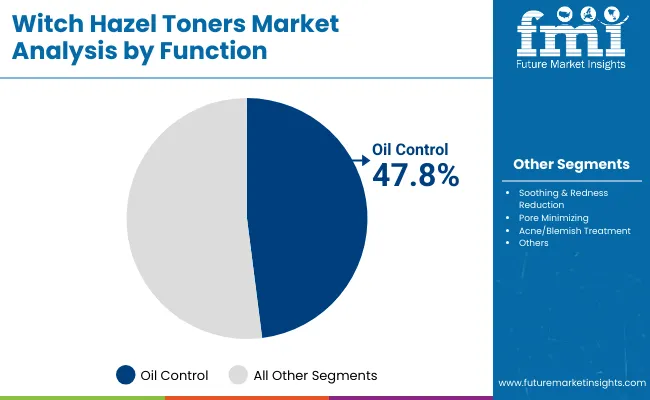
Insights into the Function Segment with Oil Control Leading in Market Share

Witch Hazel Toners Market By Function

Function Value Share% 2025
Oil control 47.8%
Others 52.2%

The oil control segment is forecasted to hold 47.8% of the market share in 2025, driven by its effectiveness in addressing excess sebum, acne, and blemishesconcerns that dominate skincare routines for younger and combination-skin consumers. Oil-control witch hazel toners are widely adopted for their astringent properties, which help tighten pores and reduce shine without stripping the skin barrier. Their growth is bolstered by rising demand across Asia-Pacific, where humid climates increase oil-control needs, and by product innovation in pads and mists for convenient daily use. With increasing consumer awareness of preventive skincare, the oil control function is expected to maintain a central role in the witch hazel toners market.
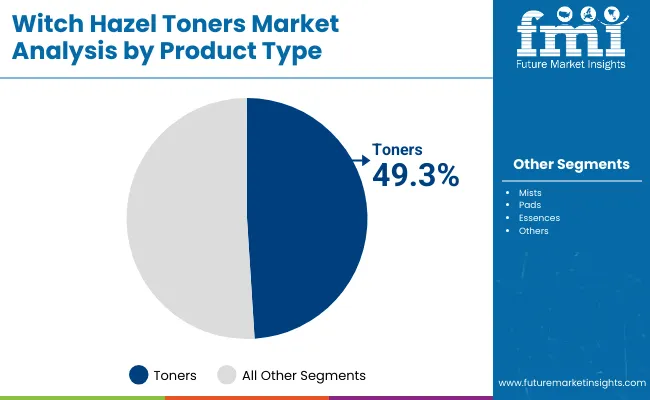
Insights into the Product Type Segment with Toners Leading in Market Share

Witch Hazel Toners Market By Product Type

Product Type Value Share% 2025
Toners 49.3%
Others 50.7%

The toners segment is projected to account for 49.3% of the Witch Hazel Toners Market revenue in 2025, establishing itself as the leading product type. Toners remain a core skincare step due to their ability to balance skin pH, tighten pores, and enhance the absorption of serums or moisturizers. Their versatilityoffered in alcohol-free, fragrance-free, and actives-enriched variantscaters to diverse consumer needs from acne treatment to hydration. Growth is further fueled by strong positioning in both pharmacies/drugstores and e-commerce channels. With continued innovation in clean-label and multifunctional toners, this segment is expected to maintain its leadership through 2035.

What are the Drivers, Restraints, and Key Trends of the Witch Hazel Toners Market?

Rising Preference for Alcohol-Free and Gentle Skincare

Consumer demand for alcohol-free skincare has accelerated growth in witch hazel toners. Many buyers are increasingly aware of the irritation and dryness associated with alcohol-based formulations, opting instead for gentle, soothing options. Witch hazel toners align with this trend by offering oil control and pore-minimizing benefits while maintaining skin hydration. Dermatologist endorsements and the popularity of clean-label claims have further strengthened trust. This driver is particularly strong in North America and Europe, where sensitive-skin products dominate retail shelves, and in Asia, where multifunctional toners cater to diverse skin concerns.

Expansion of E-Commerce and Digital Marketing Channels

The growth of e-commerce platforms and direct-to-consumer strategies has significantly boosted witch hazel toner sales. Younger consumers, especially millennials and Gen Z, prefer shopping online where they encounter product reviews, ingredient transparency, and influencer-driven recommendations. Subscription models and digital-native skincare brands have amplified accessibility and awareness. Global platforms like Amazon and specialty retailers like Sephora Online provide wide distribution, while regional e-commerce hubs in Asia-Pacific add growth momentum. This trend not only enables small indie brands to compete with global leaders but also accelerates international expansion for established players.

Limited Clinical Validation Compared to Other Actives

While witch hazel toners are widely marketed for oil control and soothing properties, the segment faces limitations due to insufficient clinical validation compared to actives like niacinamide or salicylic acid. Consumers focused on evidence-based skincare often prioritize ingredients with robust scientific backing. This challenge is amplified in premium markets where efficacy claims undergo stricter scrutiny. As a result, some brands face skepticism when positioning witch hazel toners as primary treatment products. Without more clinical trials and dermatology-backed studies, the market risks losing share to actives-led formulations in competitive segments.

Blending Witch Hazel with Modern Actives for Hybrid Solutions

A key emerging trend is the formulation of witch hazel toners blended with active ingredients such as niacinamide, salicylic acid, and hyaluronic acid. These hybrids combine the natural astringent and soothing benefits of witch hazel with proven actives that address acne, hydration, and anti-aging. This approach positions toners as multifunctional solutions rather than simple pH balancers. Brands are leveraging this innovation to cater to ingredient-savvy consumers who seek both natural and clinically effective skincare. This fusion of traditional botanicals with modern actives is driving premiumization and higher consumer engagement globally.
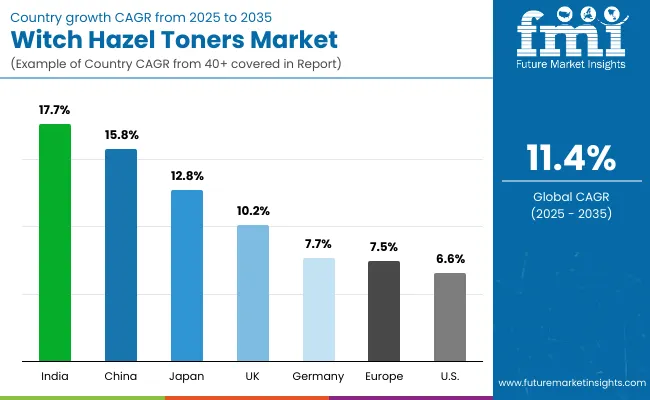
Analysis of Witch Hazel Toners Market By Key Countries

Country Wise Witch Hazel Toners Market

Countries Estimated CAGR (2025 to 2035)
China 15.8%
USA 6.6%
India 17.7%
UK 10.2%
Germany 7.7%
Japan 12.8%

The global Witch Hazel Toners Market demonstrates diverse adoption patterns across regions, influenced by cultural preferences, skincare routines, and product innovation. Asia-Pacific emerges as the fastest-growing region, with India (17.7% CAGR) and China (15.8% CAGR) driving momentum. India’s growth is fueled by rising middle-class spending, preference for natural and Ayurvedic-inspired products, and rapid expansion of e-commerce. China shows strong adoption of clean-label and vegan claims, supported by younger consumers embracing multi-step skincare regimens and premium brands.

Japan (12.8% CAGR) also contributes significantly, with a preference for essences and mists that position witch hazel toners within luxury skincare rituals. In Europe, the UK (10.2% CAGR) and Germany (7.7% CAGR) reflect strong demand for fragrance-free and hypoallergenic variants, supported by regulatory emphasis on clean-label transparency and sustainable packaging. European consumers also drive premiumization, favoring hybrid witch hazel toners blended with modern actives like niacinamide.

In North America, the USA (6.6% CAGR) records steady growth, anchored by heritage brands such as Thayers and Dickinson’s, but facing intense competition from actives-driven alternatives. Demand is concentrated in alcohol-free and sensitive-skin formulations, with mass retail and drugstores remaining dominant. The overall global outlook reflects a split between mature markets prioritizing gentle, clinically backed claims and emerging economies driving growth through natural, affordable, and multifunctional formulations.
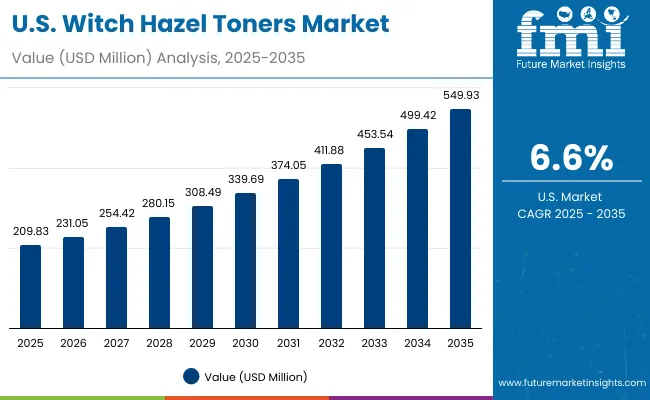
Sales Outlook for Witch Hazel Toners in the United States

Usa Witch Hazel Toners Market

Year USA Witch Hazel Toners Market (USD Million)
2025 209.83
2026 231.05
2027 254.42
2028 280.15
2029 308.49
2030 339.69
2031 374.05
2032 411.88
2033 453.54
2034 499.42
2035 549.93

The Witch Hazel Toners Market in the United States is projected to grow at a CAGR of 6.6% from 2025 to 2035, supported by rising consumer preference for alcohol-free and fragrance-free formulations. Demand is concentrated in oil-control and acne treatment functions, with growing interest in blends featuring salicylic acid and niacinamide. Distribution is dominated by pharmacies and drugstores, though e-commerce is rapidly expanding, particularly for premium and niche clean-label brands. Heritage players like Thayers and Dickinson’s maintain strong brand loyalty, while competition intensifies from newer digital-first skincare entrants.

  • Alcohol-free toners drive the bulk of sales, appealing to sensitive-skin consumers.
  • Pharmacies and drugstores remain the largest distribution channel, complemented by strong e-commerce growth.
  • Premium and active-infused formulations (e.g., salicylic blends) are gaining share in younger demographics.

Growth and Expansion Outlook for Witch Hazel Toners Market in the United Kingdom

The Witch Hazel Toners Market in the United Kingdom is expected to grow at a CAGR of 10.2% between 2025 and 2035, driven by rising adoption of clean-label, fragrance-free, and hypoallergenic formulations. Consumers are increasingly shifting toward alcohol-free toners, which now dominate market share, and premium segments are witnessing growth through active-infused blends combining witch hazel with niacinamide or hyaluronic acid. The UK’s mature skincare market also emphasizes sustainability, with brands investing in recyclable packaging and transparent sourcing. E-commerce and specialty beauty retailers are fueling expansion, while heritage natural brands face competition from fast-rising indie labels.

  • Consumers are favoring alcohol-free and hypoallergenic toners for sensitive skin.
  • Active-infused hybrids (e.g., with niacinamide) are gaining traction in the premium segment.
  • Sustainability and recyclable packaging are critical for competitive differentiation.

Growth and Expansion Outlook for Witch Hazel Toners Market in India

The Witch Hazel Toners Market in the United Kingdom is projected to grow at a CAGR of 10.2% from 2025 to 2035, fueled by the rising preference for clean-label, fragrance-free, and hypoallergenic formulations. Alcohol-free toners lead the market, aligning with consumer demand for gentle solutions suited to sensitive skin. The premium segment is expanding rapidly through active-infused blends that combine witch hazel with niacinamide, hyaluronic acid, and other functional ingredients. A strong emphasis on sustainability and recyclable packaging further defines consumer purchasing decisions. Growth is supported by e-commerce platforms and specialty beauty retailers, while heritage natural brands face competitive pressure from agile indie entrants.

  • Alcohol-free and hypoallergenic toners remain the most popular choices for sensitive-skin consumers.
  • Active-infused hybrids (e.g., with niacinamide) are accelerating premium segment adoption.
  • Sustainable packaging and transparent sourcing are now core to brand competitiveness.

Sales Outlook for Witch Hazel Toners in China

The Witch Hazel Toners Market in China is expected to grow at a CAGR of 15.8% from 2025 to 2035, the fastest among leading economies. Growth is fueled by rising demand for clean-label, vegan, and fragrance-free skincare, driven by a young, ingredient-savvy consumer base. E-commerce platforms such as Tmall and JD.com amplify distribution, while domestic brands compete aggressively with international players by offering affordable yet premium-positioned alcohol-free toners. Active-infused variants, blending witch hazel with niacinamide or salicylic acid, are particularly popular among urban millennials seeking multifunctional products. China’s beauty market also benefits from social media and influencer-driven campaigns, which boost product awareness and adoption.
  • Clean-label and vegan formulations are fueling strong adoption among young consumers.
  • E-commerce platforms are central to distribution, expanding access across urban and rural markets.
  • Domestic brands are winning share with competitively priced, alcohol-free, and actives-blended toners.

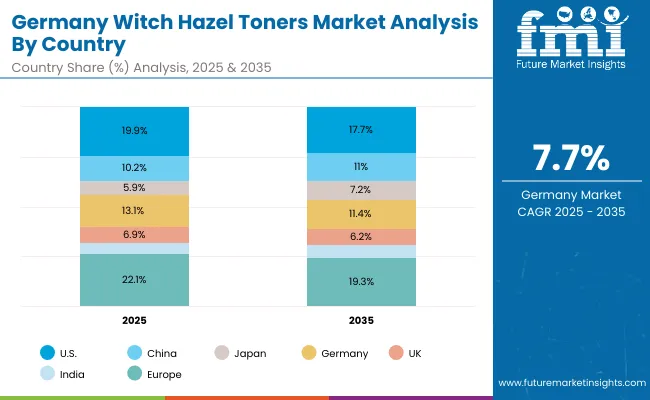
In-depth Analysis of Witch Hazel Toners in Germany

Germany Witch Hazel Toners Market By Country

Countries 2025 Share (%)
USA 19.9%
China 10.2%
Japan 5.9%
Germany 13.1%
UK 6.9%
India 4.2%
Countries 2035 Share (%)
USA 17.7%
China 11.0%
Japan 7.2%
Germany 11.4%
UK 6.2%
India 5.1%

The Witch Hazel Toners Market in Germany is projected to grow at a CAGR of 7.7% between 2025 and 2035, supported by the country’s strong demand for fragrance-free, hypoallergenic, and dermatologically tested skincare. German consumers are highly cautious about skin sensitivity and allergic reactions, making alcohol-free toners the leading formulation type. Brands emphasizing clean-label certifications and sustainable packaging gain stronger traction due to EU-driven sustainability mandates. While heritage global players remain dominant, local and regional brands are leveraging eco-conscious positioning to attract younger, health-aware consumers. Growth is also supported by the expansion of pharmacies and specialty beauty retailers, which remain key distribution hubs in the German skincare market.
  • Fragrance-free and hypoallergenic witch hazel toners are the preferred choice among German consumers.
  • Clean-label certifications and sustainable packaging drive brand competitiveness under EU regulations.
  • Pharmacies and specialty retailers remain the largest channels, supporting premium positioning.

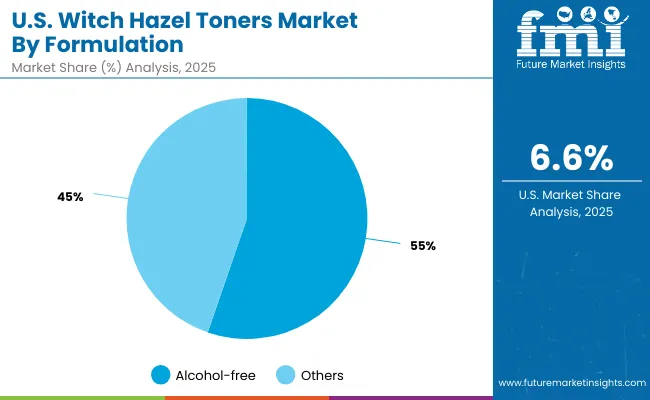
Growth Outlook for Witch Hazel Toners Market in USA

Usa Witch Hazel Toners Market By Formulation

USA By FORMULTAION Value Share% 2025
Alcohol-free 55.3%
Others 44.7%

The Witch Hazel Toners Market in the United States is projected to grow steadily at a CAGR of 6.6% between 2025 and 2035, with alcohol-free formulations holding a dominant 55.3% share in 2025. Growth is fueled by consumer preference for gentle, fragrance-free, and hypoallergenic skincare, particularly among sensitive-skin users. Pharmacies and drugstores remain the strongest retail channel, but e-commerce platforms are gaining traction, driven by indie and clean-label brands. Innovation in formulations that blend witch hazel with modern actives like salicylic acid and niacinamide is also expanding the appeal of toners among acne-prone and younger demographics.
  • Alcohol-free toners dominate with over half of the USA market share in 2025.
  • Pharmacies and drugstores remain leading channels, with strong e-commerce expansion.
  • Hybrid formulations with actives are attracting younger consumers seeking multifunctional skincare.

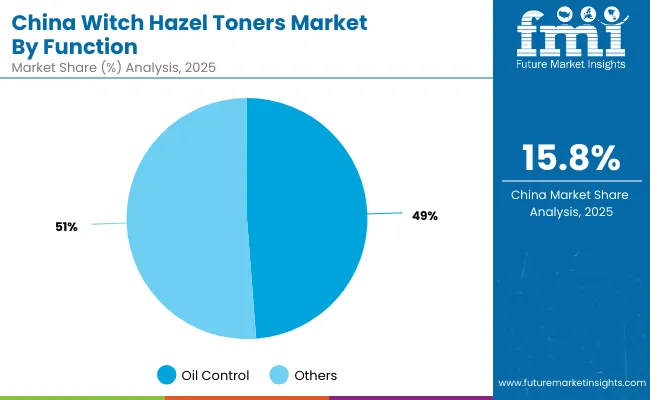
Opportunity Analysis of China Witch Hazel Toners Market

China Witch Hazel Toners Market By Function

China By Function Value Share% 2025
Oil control 48.8%
Others 51.2%

The Witch Hazel Toners Market in China offers significant opportunities, projected to expand at a CAGR of 15.8% between 2025 and 2035. Oil-control formulations, holding 48.8% share in 2025, present strong growth prospects given the country’s large population of young, acne-prone consumers. Expanding middle-class spending power and a cultural preference for multi-step skincare routines create fertile ground for toners that combine witch hazel with modern actives like niacinamide and salicylic acid. E-commerce platforms such as Tmall and JD.com, paired with influencer-driven marketing, are further accelerating adoption. The market opportunity lies in scaling affordable alcohol-free solutions while premium brands capitalize on clean-label and vegan claims.
  • Oil-control toners resonate strongly with China’s large acne-prone youth population.
  • Blended actives (niacinamide, salicylic acid) create premiumization opportunities.
  • E-commerce ecosystems and KOL marketing amplify product visibility and adoption.

Competitive Landscape of Witch Hazel Toners Market

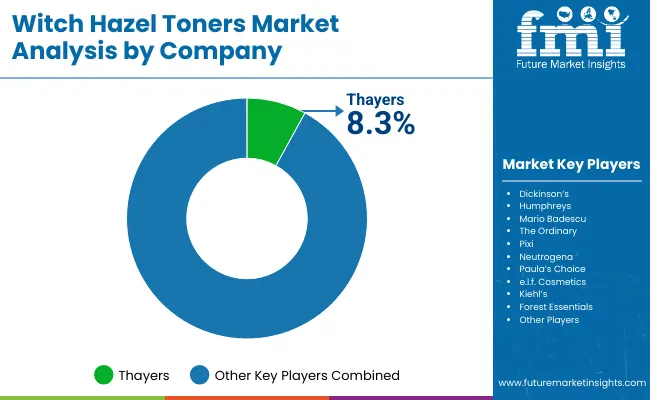
Witch Hazel Toners Market By Company

Company Global Value Share 2025
Thayers 8.3%
Others 91.7%

The Witch Hazel Toners Market is moderately fragmented, with global heritage brands, mid-sized innovators, and niche-focused natural skincare specialists competing for share. Thayers, with 8.3% global value share in 2025, leads the market by leveraging its strong heritage positioning, alcohol-free formulations, and clean-label appeal. Other established players like Dickinson’s, Humphreys, and Mario Badescu maintain strong footholds through pharmacies and drugstores, while premium brands such as The Ordinary, Pixi, and Paula’s Choice capture younger, ingredient-savvy consumers with active-infused blends.

Niche players, including Forest Essentials and e.l.f. Cosmetics, are expanding via vegan, Ayurvedic-inspired, and affordable positioning, supported by rapid e-commerce penetration. Competitive differentiation is shifting from heritage and price toward sustainability, hybrid actives integration, and transparent ingredient sourcing. Digital-first marketing strategies, influencer-driven campaigns, and eco-conscious packaging have become critical for maintaining relevance. As a result, the landscape favors brands that can balance tradition with innovation and adapt to regional skincare preferences.

Key Developments in Witch Hazel Toners Market

  • On February 5, 2025, Thayers launched a new line of alcohol-free witch hazel toners infused with hyaluronic acid and niacinamide, targeting hydration alongside oil control. This launch reflects the growing trend of hybrid toners that blend natural botanicals with modern actives to appeal to ingredient-conscious consumers.
  • On March 22, 2025, Pixi Beauty announced the rollout of eco-friendly packaged witch hazel toners in the European market, featuring recyclable bottles and clean-label certification. This move underscores the brand’s strategy to capture environmentally aware consumers in Germany and the UK, where sustainable packaging is a critical purchase driver.

Scope of the Report

Item Value
Quantitative Units USD 1,052.1 Million
Function Oil control, Soothing & redness reduction, Pore minimizing, Acne/blemish treatment
Formulation Alcohol-free, Alcohol-based, Blended with actives ( niacinamide, salicylic acid)
Product Type Toners, Mists, Pads, Essences
Channel E-commerce, Pharmacies/drugstores, Specialty beauty retail, Mass retail
Claim Clean-label, Fragrance-free, Vegan, Hypoallergenic
Regions Covered North America, Europe, Asia-Pacific, Latin America, Middle East & Africa
Country Covered United States, Canada, Germany, France, United Kingdom, China, Japan, India, Brazil, South Africa
Key Companies Profiled Thayers, Dickinson’s, Humphreys, Mario Badescu, The Ordinary, Pixi, Neutrogena, Paula’s Choice, e.l.f . Cosmetics, Kiehl’s, Forest Essentials
Additional Attributes Dollar sales by formulation and channel, rising demand for alcohol-free and hypoallergenic products, and growing adoption of active-infused toners for acne and oil control. E-commerce and specialty retailers are driving revenue, while sustainability, clean-label claims, and recyclable packaging shape brand positioning. Regional growth is fueled by natural and vegan trends, with innovation focused on microbiome-friendly actives and fragrance-free formulations.

Key Segmentation

By Function:

  • Oil control
  • Soothing & redness reduction
  • Pore minimizing
  • Acne/blemish treatment

By Formulation:

  • Alcohol-free
  • Alcohol-based
  • Blended with actives

By Product Type:

  • Toners
  • Mists
  • Pads
  • Essences

By Channel:

  • E-commerce
  • Pharmacies/drugstores
  • Specialty beauty retail
  • Mass retail

By Claim:

  • Clean-label
  • Fragrance-free
  • Vegan
  • Hypoallergenic

By Region:

  • North America
  • Latin America
  • Europe
  • East Asia
  • South Asia & Pacific
  • Middle East and Africa

Table of Content

  1. Executive Summary
    • Global Market Outlook
    • Demand-side Trends
    • Supply-side Trends
    • Technology Roadmap Analysis
    • Analysis and Recommendations
  2. Market Overview
    • Market Coverage / Taxonomy
    • Market Definition / Scope / Limitations
  3. Market Background
    • Market Dynamics
      • Drivers
      • Restraints
      • Opportunity
      • Trends
    • Scenario Forecast
      • Demand in Optimistic Scenario
      • Demand in Likely Scenario
      • Demand in Conservative Scenario
    • Opportunity Map Analysis
    • Product Life Cycle Analysis
    • Supply Chain Analysis
    • Investment Feasibility Matrix
    • Value Chain Analysis
    • PESTLE and Porter’s Analysis
    • Regulatory Landscape
    • Regional Parent Market Outlook
    • Production and Consumption Statistics
    • Import and Export Statistics
  4. Global Market Analysis 2020 to 2024 and Forecast, 2025 to 2035
    • Historical Market Size Value (USD Million) Analysis, 2020 to 2024
    • Current and Future Market Size Value (USD Million) Projections, 2025 to 2035
      • Y-o-Y Growth Trend Analysis
      • Absolute $ Opportunity Analysis
  5. Global Market Pricing Analysis 2020 to 2024 and Forecast 2025 to 2035
  6. Global Market Analysis 2020 to 2024 and Forecast 2025 to 2035, By Function
    • Introduction / Key Findings
    • Historical Market Size Value (USD Million) Analysis By Function, 2020 to 2024
    • Current and Future Market Size Value (USD Million) Analysis and Forecast By Function, 2025 to 2035
      • Oil control
      • Soothing & redness reduction
      • Pore minimizing
      • Acne/blemish treatment
    • Y-o-Y Growth Trend Analysis By Function, 2020 to 2024
    • Absolute $ Opportunity Analysis By Function, 2025 to 2035
  7. Global Market Analysis 2020 to 2024 and Forecast 2025 to 2035, By Formulation
    • Introduction / Key Findings
    • Historical Market Size Value (USD Million) Analysis By Formulation, 2020 to 2024
    • Current and Future Market Size Value (USD Million) Analysis and Forecast By Formulation, 2025 to 2035
      • Alcohol-free
      • Alcohol-based
      • Blended with actives
    • Y-o-Y Growth Trend Analysis By Formulation, 2020 to 2024
    • Absolute $ Opportunity Analysis By Formulation, 2025 to 2035
  8. Global Market Analysis 2020 to 2024 and Forecast 2025 to 2035, By Product Type
    • Introduction / Key Findings
    • Historical Market Size Value (USD Million) Analysis By Product Type, 2020 to 2024
    • Current and Future Market Size Value (USD Million) Analysis and Forecast By Product Type, 2025 to 2035
      • Toners
      • Mists
      • Pads
      • Essences
    • Y-o-Y Growth Trend Analysis By Product Type, 2020 to 2024
    • Absolute $ Opportunity Analysis By Product Type, 2025 to 2035
  9. Global Market Analysis 2020 to 2024 and Forecast 2025 to 2035, By Channel
    • Introduction / Key Findings
    • Historical Market Size Value (USD Million) Analysis By Channel, 2020 to 2024
    • Current and Future Market Size Value (USD Million) Analysis and Forecast By Channel, 2025 to 2035
      • E-commerce
      • Pharmacies/drugstores
      • Specialty beauty retail
      • Mass retail
    • Y-o-Y Growth Trend Analysis By Channel, 2020 to 2024
    • Absolute $ Opportunity Analysis By Channel, 2025 to 2035
  10. Global Market Analysis 2020 to 2024 and Forecast 2025 to 2035, By Claim
    • Introduction / Key Findings
    • Historical Market Size Value (USD Million) Analysis By Claim, 2020 to 2024
    • Current and Future Market Size Value (USD Million) Analysis and Forecast By Claim, 2025 to 2035
      • Clean-label
      • Fragrance-free
      • Vegan
      • Hypoallergenic
    • Y-o-Y Growth Trend Analysis By Claim, 2020 to 2024
    • Absolute $ Opportunity Analysis By Claim, 2025 to 2035
  11. Global Market Analysis 2020 to 2024 and Forecast 2025 to 2035, By Region
    • Introduction
    • Historical Market Size Value (USD Million) Analysis By Region, 2020 to 2024
    • Current Market Size Value (USD Million) Analysis and Forecast By Region, 2025 to 2035
      • North America
      • Latin America
      • Europe
      • East Asia
      • South Asia & Pacific
      • Middle East and Africa
    • Market Attractiveness Analysis By Region
  12. North America Market Analysis 2020 to 2024 and Forecast 2025 to 2035, By Country
    • Historical Market Size Value (USD Million) Trend Analysis By Market Taxonomy, 2020 to 2024
    • Market Size Value (USD Million) Forecast By Market Taxonomy, 2025 to 2035
      • By Country
        • USA
        • Canada
      • By Function
      • By Formulation
      • By Product Type
      • By Channel
      • By Claim
    • Market Attractiveness Analysis
      • By Country
      • By Function
      • By Formulation
      • By Product Type
      • By Channel
      • By Claim
    • Key Takeaways
  13. Latin America Market Analysis 2020 to 2024 and Forecast 2025 to 2035, By Country
    • Historical Market Size Value (USD Million) Trend Analysis By Market Taxonomy, 2020 to 2024
    • Market Size Value (USD Million) Forecast By Market Taxonomy, 2025 to 2035
      • By Country
        • Brazil
        • Mexico
        • Colombia
        • Rest of Latin America
      • By Function
      • By Formulation
      • By Product Type
      • By Channel
      • By Claim
    • Market Attractiveness Analysis
      • By Country
      • By Function
      • By Formulation
      • By Product Type
      • By Channel
      • By Claim
    • Key Takeaways
  14. Europe Market Analysis 2020 to 2024 and Forecast 2025 to 2035, By Country
    • Historical Market Size Value (USD Million) Trend Analysis By Market Taxonomy, 2020 to 2024
    • Market Size Value (USD Million) Forecast By Market Taxonomy, 2025 to 2035
      • By Country
        • Germany
        • UK
        • France
        • Italy
        • Spain
        • Belgium
        • Netherlands
        • Nordic
        • Switzerland
        • Russia
        • Poland
        • Rest of Europe
      • By Function
      • By Formulation
      • By Product Type
      • By Channel
      • By Claim
    • Market Attractiveness Analysis
      • By Country
      • By Function
      • By Formulation
      • By Product Type
      • By Channel
      • By Claim
    • Key Takeaways
  15. East Asia Market Analysis 2020 to 2024 and Forecast 2025 to 2035, By Country
    • Historical Market Size Value (USD Million) Trend Analysis By Market Taxonomy, 2020 to 2024
    • Market Size Value (USD Million) Forecast By Market Taxonomy, 2025 to 2035
      • By Country
        • China
        • Japan
        • South Korea
      • By Function
      • By Formulation
      • By Product Type
      • By Channel
      • By Claim
    • Market Attractiveness Analysis
      • By Country
      • By Function
      • By Formulation
      • By Product Type
      • By Channel
      • By Claim
    • Key Takeaways
  16. South Asia & Pacific Market Analysis 2020 to 2024 and Forecast 2025 to 2035, By Country
    • Historical Market Size Value (USD Million) Trend Analysis By Market Taxonomy, 2020 to 2024
    • Market Size Value (USD Million) Forecast By Market Taxonomy, 2025 to 2035
      • By Country
        • India
        • Thailand
        • Malaysia
        • Indonesia
        • Singapore
        • Vietnam
        • Australia
        • New Zealand
        • Rest of South Asia
      • By Function
      • By Formulation
      • By Product Type
      • By Channel
      • By Claim
    • Market Attractiveness Analysis
      • By Country
      • By Function
      • By Formulation
      • By Product Type
      • By Channel
      • By Claim
    • Key Takeaways
  17. Middle East and Africa Market Analysis 2020 to 2024 and Forecast 2025 to 2035, By Country
    • Historical Market Size Value (USD Million) Trend Analysis By Market Taxonomy, 2020 to 2024
    • Market Size Value (USD Million) Forecast By Market Taxonomy, 2025 to 2035
      • By Country
        • Turkey
        • UAE
        • Saudi Arabia
        • Israel
        • Other GCC Countries
        • North Africa
        • South Africa
      • By Function
      • By Formulation
      • By Product Type
      • By Channel
      • By Claim
    • Market Attractiveness Analysis
      • By Country
      • By Function
      • By Formulation
      • By Product Type
      • By Channel
      • By Claim
    • Key Takeaways
  18. Key Countries Market Analysis
    • USA
      • Pricing Analysis
      • Market Share Analysis, 2024
        • By Function
        • By Formulation
        • By Product Type
        • By Channel
        • By Claim
    • Canada
      • Pricing Analysis
      • Market Share Analysis, 2024
        • By Function
        • By Formulation
        • By Product Type
        • By Channel
        • By Claim
    • Mexico
      • Pricing Analysis
      • Market Share Analysis, 2024
        • By Function
        • By Formulation
        • By Product Type
        • By Channel
        • By Claim
    • Brazil
      • Pricing Analysis
      • Market Share Analysis, 2024
        • By Function
        • By Formulation
        • By Product Type
        • By Channel
        • By Claim
    • Germany
      • Pricing Analysis
      • Market Share Analysis, 2024
        • By Function
        • By Formulation
        • By Product Type
        • By Channel
        • By Claim
    • UK
      • Pricing Analysis
      • Market Share Analysis, 2024
        • By Function
        • By Formulation
        • By Product Type
        • By Channel
        • By Claim
    • Italy
      • Pricing Analysis
      • Market Share Analysis, 2024
        • By Function
        • By Formulation
        • By Product Type
        • By Channel
        • By Claim
    • Spain
      • Pricing Analysis
      • Market Share Analysis, 2024
        • By Function
        • By Formulation
        • By Product Type
        • By Channel
        • By Claim
    • France
      • Pricing Analysis
      • Market Share Analysis, 2024
        • By Function
        • By Formulation
        • By Product Type
        • By Channel
        • By Claim
    • India
      • Pricing Analysis
      • Market Share Analysis, 2024
        • By Function
        • By Formulation
        • By Product Type
        • By Channel
        • By Claim
    • Australia & New Zealand
      • Pricing Analysis
      • Market Share Analysis, 2024
        • By Function
        • By Formulation
        • By Product Type
        • By Channel
        • By Claim
    • China
      • Pricing Analysis
      • Market Share Analysis, 2024
        • By Function
        • By Formulation
        • By Product Type
        • By Channel
        • By Claim
    • Japan
      • Pricing Analysis
      • Market Share Analysis, 2024
        • By Function
        • By Formulation
        • By Product Type
        • By Channel
        • By Claim
    • South Korea
      • Pricing Analysis
      • Market Share Analysis, 2024
        • By Function
        • By Formulation
        • By Product Type
        • By Channel
        • By Claim
    • Russia
      • Pricing Analysis
      • Market Share Analysis, 2024
        • By Function
        • By Formulation
        • By Product Type
        • By Channel
        • By Claim
    • Poland
      • Pricing Analysis
      • Market Share Analysis, 2024
        • By Function
        • By Formulation
        • By Product Type
        • By Channel
        • By Claim
    • Hungary
      • Pricing Analysis
      • Market Share Analysis, 2024
        • By Function
        • By Formulation
        • By Product Type
        • By Channel
        • By Claim
    • Kingdom of Saudi Arabia
      • Pricing Analysis
      • Market Share Analysis, 2024
        • By Function
        • By Formulation
        • By Product Type
        • By Channel
        • By Claim
    • South Africa
      • Pricing Analysis
      • Market Share Analysis, 2024
        • By Function
        • By Formulation
        • By Product Type
        • By Channel
        • By Claim
  19. Market Structure Analysis
    • Competition Dashboard
    • Competition Benchmarking
    • Market Share Analysis of Top Players
      • By Regional
      • By Function
      • By Formulation
      • By Product Type
      • By Channel
      • By Claim
  20. Competition Analysis
    • Competition Deep Dive
      • Thayers
        • Overview
        • Product Portfolio
        • Profitability by Market Segments (Product/Age /Sales Channel/Region)
        • Sales Footprint
        • Strategy Overview
        • Dickinson’s
        • Humphreys
        • Mario Badescu
        • The Ordinary
        • Pixi
        • Neutrogena
        • Paula’s Choice
        • e.l.f. Cosmetics
        • Kiehl’s
        • Forest Essentials
    • Assumptions & Acronyms Used
    • Research Methodology

List of Tables

  • Table 1: Global Market Value (USD Million) Forecast by Region, 2020-2035
  • Table 2: Global Market Value (USD Million) Forecast by Function, 2020-2035
  • Table 3: Global Market Value (USD Million) Forecast by Formulation, 2020-2035
  • Table 4: Global Market Value (USD Million) Forecast by Product Type, 2020-2035
  • Table 5: Global Market Value (USD Million) Forecast by Channel, 2020-2035
  • Table 6: Global Market Value (USD Million) Forecast by Claim, 2020-2035
  • Table 7: North America Market Value (USD Million) Forecast by Country, 2020-2035
  • Table 8: North America Market Value (USD Million) Forecast by Function, 2020-2035
  • Table 9: North America Market Value (USD Million) Forecast by Formulation, 2020-2035
  • Table 10: North America Market Value (USD Million) Forecast by Product Type, 2020-2035
  • Table 11: North America Market Value (USD Million) Forecast by Channel, 2020-2035
  • Table 12: North America Market Value (USD Million) Forecast by Claim, 2020-2035
  • Table 13: Latin America Market Value (USD Million) Forecast by Country, 2020-2035
  • Table 14: Latin America Market Value (USD Million) Forecast by Function, 2020-2035
  • Table 15: Latin America Market Value (USD Million) Forecast by Formulation, 2020-2035
  • Table 16: Latin America Market Value (USD Million) Forecast by Product Type, 2020-2035
  • Table 17: Latin America Market Value (USD Million) Forecast by Channel, 2020-2035
  • Table 18: Latin America Market Value (USD Million) Forecast by Claim, 2020-2035
  • Table 19: Europe Market Value (USD Million) Forecast by Country, 2020-2035
  • Table 20: Europe Market Value (USD Million) Forecast by Function, 2020-2035
  • Table 21: Europe Market Value (USD Million) Forecast by Formulation, 2020-2035
  • Table 22: Europe Market Value (USD Million) Forecast by Product Type, 2020-2035
  • Table 23: Europe Market Value (USD Million) Forecast by Channel, 2020-2035
  • Table 24: Europe Market Value (USD Million) Forecast by Claim, 2020-2035
  • Table 25: East Asia Market Value (USD Million) Forecast by Country, 2020-2035
  • Table 26: East Asia Market Value (USD Million) Forecast by Function, 2020-2035
  • Table 27: East Asia Market Value (USD Million) Forecast by Formulation, 2020-2035
  • Table 28: East Asia Market Value (USD Million) Forecast by Product Type, 2020-2035
  • Table 29: East Asia Market Value (USD Million) Forecast by Channel, 2020-2035
  • Table 30: East Asia Market Value (USD Million) Forecast by Claim, 2020-2035
  • Table 31: South Asia & Pacific Market Value (USD Million) Forecast by Country, 2020-2035
  • Table 32: South Asia & Pacific Market Value (USD Million) Forecast by Function, 2020-2035
  • Table 33: South Asia & Pacific Market Value (USD Million) Forecast by Formulation, 2020-2035
  • Table 34: South Asia & Pacific Market Value (USD Million) Forecast by Product Type, 2020-2035
  • Table 35: South Asia & Pacific Market Value (USD Million) Forecast by Channel, 2020-2035
  • Table 36: South Asia & Pacific Market Value (USD Million) Forecast by Claim, 2020-2035
  • Table 37: Middle East and Africa Market Value (USD Million) Forecast by Country, 2020-2035
  • Table 38: Middle East and Africa Market Value (USD Million) Forecast by Function, 2020-2035
  • Table 39: Middle East and Africa Market Value (USD Million) Forecast by Formulation, 2020-2035
  • Table 40: Middle East and Africa Market Value (USD Million) Forecast by Product Type, 2020-2035
  • Table 41: Middle East and Africa Market Value (USD Million) Forecast by Channel, 2020-2035
  • Table 42: Middle East and Africa Market Value (USD Million) Forecast by Claim, 2020-2035

List of Figures

  • Figure 1: Global Market Pricing Analysis
  • Figure 2: Global Market Value (USD Million) Forecast 2020-2035
  • Figure 3: Global Market Value Share and BPS Analysis by Function, 2025 and 2035
  • Figure 4: Global Market Y-o-Y Growth Comparison by Function, 2025-2035
  • Figure 5: Global Market Attractiveness Analysis by Function
  • Figure 6: Global Market Value Share and BPS Analysis by Formulation, 2025 and 2035
  • Figure 7: Global Market Y-o-Y Growth Comparison by Formulation, 2025-2035
  • Figure 8: Global Market Attractiveness Analysis by Formulation
  • Figure 9: Global Market Value Share and BPS Analysis by Product Type, 2025 and 2035
  • Figure 10: Global Market Y-o-Y Growth Comparison by Product Type, 2025-2035
  • Figure 11: Global Market Attractiveness Analysis by Product Type
  • Figure 12: Global Market Value Share and BPS Analysis by Channel, 2025 and 2035
  • Figure 13: Global Market Y-o-Y Growth Comparison by Channel, 2025-2035
  • Figure 14: Global Market Attractiveness Analysis by Channel
  • Figure 15: Global Market Value Share and BPS Analysis by Claim, 2025 and 2035
  • Figure 16: Global Market Y-o-Y Growth Comparison by Claim, 2025-2035
  • Figure 17: Global Market Attractiveness Analysis by Claim
  • Figure 18: Global Market Value (USD Million) Share and BPS Analysis by Region, 2025 and 2035
  • Figure 19: Global Market Y-o-Y Growth Comparison by Region, 2025-2035
  • Figure 20: Global Market Attractiveness Analysis by Region
  • Figure 21: North America Market Incremental $ Opportunity, 2025-2035
  • Figure 22: Latin America Market Incremental $ Opportunity, 2025-2035
  • Figure 23: Europe Market Incremental $ Opportunity, 2025-2035
  • Figure 24: East Asia Market Incremental $ Opportunity, 2025-2035
  • Figure 25: South Asia & Pacific Market Incremental $ Opportunity, 2025-2035
  • Figure 26: Middle East and Africa Market Incremental $ Opportunity, 2025-2035
  • Figure 27: North America Market Value Share and BPS Analysis by Country, 2025 and 2035
  • Figure 28: North America Market Value Share and BPS Analysis by Function, 2025 and 2035
  • Figure 29: North America Market Y-o-Y Growth Comparison by Function, 2025-2035
  • Figure 30: North America Market Attractiveness Analysis by Function
  • Figure 31: North America Market Value Share and BPS Analysis by Formulation, 2025 and 2035
  • Figure 32: North America Market Y-o-Y Growth Comparison by Formulation, 2025-2035
  • Figure 33: North America Market Attractiveness Analysis by Formulation
  • Figure 34: North America Market Value Share and BPS Analysis by Product Type, 2025 and 2035
  • Figure 35: North America Market Y-o-Y Growth Comparison by Product Type, 2025-2035
  • Figure 36: North America Market Attractiveness Analysis by Product Type
  • Figure 37: North America Market Value Share and BPS Analysis by Channel, 2025 and 2035
  • Figure 38: North America Market Y-o-Y Growth Comparison by Channel, 2025-2035
  • Figure 39: North America Market Attractiveness Analysis by Channel
  • Figure 40: North America Market Value Share and BPS Analysis by Claim, 2025 and 2035
  • Figure 41: North America Market Y-o-Y Growth Comparison by Claim, 2025-2035
  • Figure 42: North America Market Attractiveness Analysis by Claim
  • Figure 43: Latin America Market Value Share and BPS Analysis by Country, 2025 and 2035
  • Figure 44: Latin America Market Value Share and BPS Analysis by Function, 2025 and 2035
  • Figure 45: Latin America Market Y-o-Y Growth Comparison by Function, 2025-2035
  • Figure 46: Latin America Market Attractiveness Analysis by Function
  • Figure 47: Latin America Market Value Share and BPS Analysis by Formulation, 2025 and 2035
  • Figure 48: Latin America Market Y-o-Y Growth Comparison by Formulation, 2025-2035
  • Figure 49: Latin America Market Attractiveness Analysis by Formulation
  • Figure 50: Latin America Market Value Share and BPS Analysis by Product Type, 2025 and 2035
  • Figure 51: Latin America Market Y-o-Y Growth Comparison by Product Type, 2025-2035
  • Figure 52: Latin America Market Attractiveness Analysis by Product Type
  • Figure 53: Latin America Market Value Share and BPS Analysis by Channel, 2025 and 2035
  • Figure 54: Latin America Market Y-o-Y Growth Comparison by Channel, 2025-2035
  • Figure 55: Latin America Market Attractiveness Analysis by Channel
  • Figure 56: Latin America Market Value Share and BPS Analysis by Claim, 2025 and 2035
  • Figure 57: Latin America Market Y-o-Y Growth Comparison by Claim, 2025-2035
  • Figure 58: Latin America Market Attractiveness Analysis by Claim
  • Figure 59: Europe Market Value Share and BPS Analysis by Country, 2025 and 2035
  • Figure 60: Europe Market Value Share and BPS Analysis by Function, 2025 and 2035
  • Figure 61: Europe Market Y-o-Y Growth Comparison by Function, 2025-2035
  • Figure 62: Europe Market Attractiveness Analysis by Function
  • Figure 63: Europe Market Value Share and BPS Analysis by Formulation, 2025 and 2035
  • Figure 64: Europe Market Y-o-Y Growth Comparison by Formulation, 2025-2035
  • Figure 65: Europe Market Attractiveness Analysis by Formulation
  • Figure 66: Europe Market Value Share and BPS Analysis by Product Type, 2025 and 2035
  • Figure 67: Europe Market Y-o-Y Growth Comparison by Product Type, 2025-2035
  • Figure 68: Europe Market Attractiveness Analysis by Product Type
  • Figure 69: Europe Market Value Share and BPS Analysis by Channel, 2025 and 2035
  • Figure 70: Europe Market Y-o-Y Growth Comparison by Channel, 2025-2035
  • Figure 71: Europe Market Attractiveness Analysis by Channel
  • Figure 72: Europe Market Value Share and BPS Analysis by Claim, 2025 and 2035
  • Figure 73: Europe Market Y-o-Y Growth Comparison by Claim, 2025-2035
  • Figure 74: Europe Market Attractiveness Analysis by Claim
  • Figure 75: East Asia Market Value Share and BPS Analysis by Country, 2025 and 2035
  • Figure 76: East Asia Market Value Share and BPS Analysis by Function, 2025 and 2035
  • Figure 77: East Asia Market Y-o-Y Growth Comparison by Function, 2025-2035
  • Figure 78: East Asia Market Attractiveness Analysis by Function
  • Figure 79: East Asia Market Value Share and BPS Analysis by Formulation, 2025 and 2035
  • Figure 80: East Asia Market Y-o-Y Growth Comparison by Formulation, 2025-2035
  • Figure 81: East Asia Market Attractiveness Analysis by Formulation
  • Figure 82: East Asia Market Value Share and BPS Analysis by Product Type, 2025 and 2035
  • Figure 83: East Asia Market Y-o-Y Growth Comparison by Product Type, 2025-2035
  • Figure 84: East Asia Market Attractiveness Analysis by Product Type
  • Figure 85: East Asia Market Value Share and BPS Analysis by Channel, 2025 and 2035
  • Figure 86: East Asia Market Y-o-Y Growth Comparison by Channel, 2025-2035
  • Figure 87: East Asia Market Attractiveness Analysis by Channel
  • Figure 88: East Asia Market Value Share and BPS Analysis by Claim, 2025 and 2035
  • Figure 89: East Asia Market Y-o-Y Growth Comparison by Claim, 2025-2035
  • Figure 90: East Asia Market Attractiveness Analysis by Claim
  • Figure 91: South Asia & Pacific Market Value Share and BPS Analysis by Country, 2025 and 2035
  • Figure 92: South Asia & Pacific Market Value Share and BPS Analysis by Function, 2025 and 2035
  • Figure 93: South Asia & Pacific Market Y-o-Y Growth Comparison by Function, 2025-2035
  • Figure 94: South Asia & Pacific Market Attractiveness Analysis by Function
  • Figure 95: South Asia & Pacific Market Value Share and BPS Analysis by Formulation, 2025 and 2035
  • Figure 96: South Asia & Pacific Market Y-o-Y Growth Comparison by Formulation, 2025-2035
  • Figure 97: South Asia & Pacific Market Attractiveness Analysis by Formulation
  • Figure 98: South Asia & Pacific Market Value Share and BPS Analysis by Product Type, 2025 and 2035
  • Figure 99: South Asia & Pacific Market Y-o-Y Growth Comparison by Product Type, 2025-2035
  • Figure 100: South Asia & Pacific Market Attractiveness Analysis by Product Type
  • Figure 101: South Asia & Pacific Market Value Share and BPS Analysis by Channel, 2025 and 2035
  • Figure 102: South Asia & Pacific Market Y-o-Y Growth Comparison by Channel, 2025-2035
  • Figure 103: South Asia & Pacific Market Attractiveness Analysis by Channel
  • Figure 104: South Asia & Pacific Market Value Share and BPS Analysis by Claim, 2025 and 2035
  • Figure 105: South Asia & Pacific Market Y-o-Y Growth Comparison by Claim, 2025-2035
  • Figure 106: South Asia & Pacific Market Attractiveness Analysis by Claim
  • Figure 107: Middle East and Africa Market Value Share and BPS Analysis by Country, 2025 and 2035
  • Figure 108: Middle East and Africa Market Value Share and BPS Analysis by Function, 2025 and 2035
  • Figure 109: Middle East and Africa Market Y-o-Y Growth Comparison by Function, 2025-2035
  • Figure 110: Middle East and Africa Market Attractiveness Analysis by Function
  • Figure 111: Middle East and Africa Market Value Share and BPS Analysis by Formulation, 2025 and 2035
  • Figure 112: Middle East and Africa Market Y-o-Y Growth Comparison by Formulation, 2025-2035
  • Figure 113: Middle East and Africa Market Attractiveness Analysis by Formulation
  • Figure 114: Middle East and Africa Market Value Share and BPS Analysis by Product Type, 2025 and 2035
  • Figure 115: Middle East and Africa Market Y-o-Y Growth Comparison by Product Type, 2025-2035
  • Figure 116: Middle East and Africa Market Attractiveness Analysis by Product Type
  • Figure 117: Middle East and Africa Market Value Share and BPS Analysis by Channel, 2025 and 2035
  • Figure 118: Middle East and Africa Market Y-o-Y Growth Comparison by Channel, 2025-2035
  • Figure 119: Middle East and Africa Market Attractiveness Analysis by Channel
  • Figure 120: Middle East and Africa Market Value Share and BPS Analysis by Claim, 2025 and 2035
  • Figure 121: Middle East and Africa Market Y-o-Y Growth Comparison by Claim, 2025-2035
  • Figure 122: Middle East and Africa Market Attractiveness Analysis by Claim
  • Figure 123: Global Market - Tier Structure Analysis
  • Figure 124: Global Market - Company Share Analysis

Frequently Asked Questions

How big is the Witch Hazel Toners Market in 2025?

The global Witch Hazel Toners Market is estimated to be valued at USD 1,052.1 million in 2025.

What will be the size of Witch Hazel Toners Market in 2035?

The market size for the Witch Hazel Toners Market is projected to reach USD 3,102.1 million by 2035.

How much will be the Witch Hazel Toners Market growth between 2025 and 2035?

The Witch Hazel Toners Market is expected to grow at a 11.4% CAGR between 2025 and 2035.

What are the key product types in the Witch Hazel Toners Market?

The key product types in the Witch Hazel Toners Market are toners, mists, pads, and essences.

Which range segment to contribute significant share in the Witch Hazel Toners Market in 2025?

n terms of function, oil control products are expected to contribute a significant share of the Witch Hazel Toners Market in 2025, supported by rising consumer preference for acne and blemish prevention.

Explore Similar Insights

Future Market Insights

Witch Hazel Toners Market

Chat With

MaRIA

Hi There, I am MaRIA, Your Market Research Intelligence Assistant. How may I help you?