Wrap Around Cartoners Market Size and Share Forecast Outlook 2025 to 2035

The Wrap Around Cartoners Market is estimated to be valued at USD 1.6 billion in 2025 and is projected to reach USD 2.0 billion by 2035, registering a compound annual growth rate (CAGR) of 2.5% over the forecast period.

The Wrap Around Cartoners market is experiencing robust growth driven by the increasing demand for automated packaging solutions across the food, beverage, and consumer goods sectors. The future outlook of this market is shaped by the rising need for efficient production lines that reduce labor costs and enhance operational productivity. Continuous advancements in cartoning technology, including improved speed, precision, and adaptability, have enabled manufacturers to meet the growing expectations of end users.

The emphasis on sustainable and minimal packaging, coupled with the rising popularity of ready-to-eat and packaged foods, is further supporting market expansion. Integration of software-driven controls and flexible packaging designs is facilitating the adoption of wrap around cartoners across diverse production environments.

Additionally, regulatory compliance regarding food safety and hygiene standards is driving investment in automated packaging systems As manufacturers aim to streamline operations and improve packaging efficiency, the Wrap Around Cartoners market is poised for sustained growth, particularly in regions witnessing increased consumption of packaged goods and rapid industrialization.
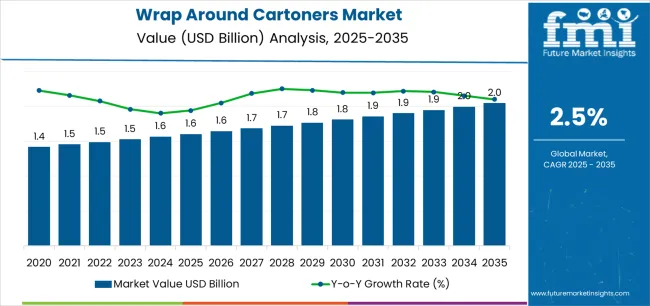
Quick Stats for Wrap Around Cartoners Market

  • Wrap Around Cartoners Market Industry Value (2025): USD 1.6 billion
  • Wrap Around Cartoners Market Forecast Value (2035): USD 2.0 billion
  • Wrap Around Cartoners Market Forecast CAGR: 2.5%
  • Leading Segment in Wrap Around Cartoners Market in 2025: Horizontal (55.0%)
  • Key Growth Region in Wrap Around Cartoners Market: North America, Asia-Pacific, Europe
  • Top Key Players in Wrap Around Cartoners Market: Mpac Group plc., I.M.A. INDUSTRIA MACCHINE AUTOMATICHE S.P.A., SHIBUYA CORPORATION, Omori Machinery Co. Ltd., Coesia S.p.A., OPTIMA packaging group GmbH, HANGZHOU YOUNGSUN INTELLIGENT EQUIPMENT CO., LTD, Cama Group, Syntegon Technology GmbH, Douglas Machine Inc., Econocorp Inc., Jacob White Packaging Ltd., Jochamp, EAR-FLAP® GROUP, Atlanta Packaging Technology and Machinery

Wrap Around Cartoners Market Market Value Analysis

Metric Value
Wrap Around Cartoners Market Estimated Value in (2025 E) USD 1.6 billion
Wrap Around Cartoners Market Forecast Value in (2035 F) USD 2.0 billion
Forecast CAGR (2025 to 2035) 2.5%

Segmental Analysis

The market is segmented by Orientation, Capacity, and End Use and region. By Orientation, the market is divided into Horizontal and Vertical. In terms of Capacity, the market is classified into 70 To 150 Cartons Per Minute, Less Than 70 Cartons Per Minute, 151 To 400 Cartons Per Minute, and Above 400 Cartons Per Minute. Based on End Use, the market is segmented into Food, Beverage, Healthcare, Personal Care And Cosmetics, Homecare, and Other Industrial. Regionally, the market is classified into North America, Latin America, Western Europe, Eastern Europe, Balkan & Baltic Countries, Russia & Belarus, Central Asia, East Asia, South Asia & Pacific, and the Middle East & Africa.
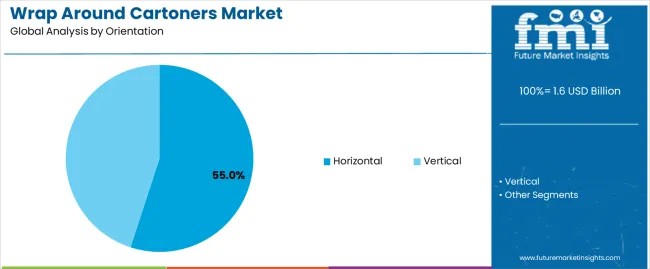
Insights into the Horizontal Orientation Segment

Wrap Around Cartoners Market Analysis By Orientation

The horizontal orientation segment is projected to hold 55.0% of the Wrap Around Cartoners market revenue share in 2025, making it the leading orientation type. The dominance of this segment is primarily attributed to its suitability for high-speed and large-volume production environments.

Horizontal cartoners offer better stability and precise product alignment, which reduces packaging errors and improves overall line efficiency. The adaptability of horizontal systems to accommodate different product sizes and shapes enhances their appeal to manufacturers across the food and consumer goods sectors.

Additionally, advancements in automation and real-time monitoring capabilities have further improved operational reliability, leading to increased adoption The focus on minimizing downtime and maximizing throughput has positioned horizontal cartoners as the preferred choice in facilities seeking consistent and efficient packaging solutions.
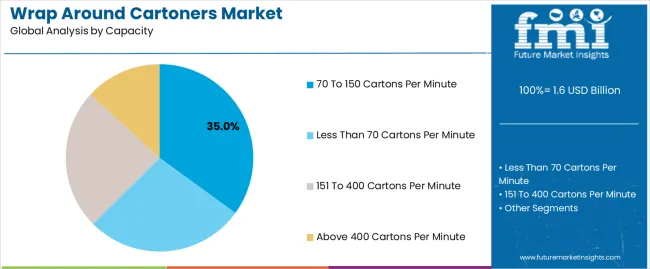
Insights into the 70 To 150 Cartons Per Minute Capacity Segment

Wrap Around Cartoners Market Analysis By Capacity

The 70 to 150 cartons per minute capacity segment is expected to capture 35.0% of the market revenue in 2025, establishing it as the leading capacity range. This growth is driven by the balance it offers between speed and operational control, making it ideal for medium-scale production environments.

The segment has benefited from increased adoption in industries where moderate output with high precision is required, including food packaging. Manufacturers prefer this capacity range as it allows flexibility in handling diverse product types while maintaining production efficiency.

The integration of software-controlled systems ensures accurate carton placement and minimal waste, reinforcing the segment’s prominence Growing demand for efficient and scalable packaging lines continues to support the adoption of wrap around cartoners within this capacity range.
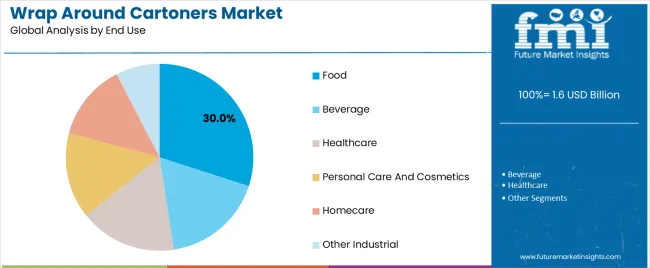
Insights into the Food End-Use Segment

Wrap Around Cartoners Market Analysis By End Use

The food end-use segment is anticipated to account for 30.0% of the Wrap Around Cartoners market revenue in 2025, making it the dominant application industry. This growth is fueled by the increasing consumption of packaged and ready-to-eat foods, which necessitates high-speed and precise cartoning solutions.

The segment benefits from stringent hygiene and safety requirements, driving the adoption of automated and software-driven cartoners to ensure consistent quality. The versatility of wrap around cartoners allows them to accommodate a wide range of food products, including confectionery, bakery items, and packaged snacks, further supporting market growth.

Additionally, the rising focus on brand presentation, sustainable packaging, and operational efficiency has encouraged manufacturers to invest in advanced cartoning technologies The combination of these factors continues to make the food segment a key driver of market revenue.

Semi Annual Market Update

The below table presents the expected CAGR for the global wrap-around cartoners market over several semi-annual periods spanning from 2025 to 2035. In the first half (H1) of the year from 2025 to 2035, the business is predicted to surge at a CAGR of 2.5%, followed by a slightly higher growth rate of 2.7% in the second half (H2) of the same year.

Particular Value CAGR
H1 2.5% (2025 to 2035)
H2 2.7% (2025 to 2035)
H1 2.3% (2025 to 2035)
H2 2.9% (2025 to 2035)

Moving into the subsequent period, from H1 2025 to H2 2035, the CAGR is projected to decrease slightly to 2.3% in the first half and remain relatively moderate at 2.9% in the second half. In the first half (H1) the market witnessed a decrease of 20 BPS while in the second half (H2), the market witnessed an increase of 20 BPS.

Key Industry Highlights

Paper Carton Recyclability Drives Demand for Wrap Around Cartoner

Paper and paperboard are the most used materials for making cartons. Carton-board packaging is widely preferred for secondary packaging over any other method due to various advantages such as completely biodegradable and recyclability, less space for its storage as it can folded till the time of usage, the ability to effectively seal by tucking in the flaps, and wide and easily printable surface for brand promotions and product details.

According to the American Forest and Paper Association, paper is considered as the most recyclable packaging material in the USA with a recycling rate of more than 82% in the past few years.

To avoid damage to the products during transit and shipping, there has been a rise in demand for protective packaging. As carton-board packaging fulfils this primary demand at the same time using paper and paperboard as its primary material, its demand is on the surge all over the globe even in countries that have stringent regulations related to the packaging product and materials.

Also, there has been high demand from various end-use industries for carton-based packaging, which has stressed the use of machines instead of the labor force to have a high production rate in less time. The recyclable nature of paper and surging demand for secured packaging such as carton packaging is driving the wrap-around cartoners market.

Automation Fueling Growth in Wrap Around Cartoner Market

With the development of automation technology across several manufacturing processes, automation in wrap-around cartoners has additional benefits over traditional semi-automated or manually operated machines.

Though automation may incur high investment costs in the initial period, but offers improved and worth the value outputs in every aspect of the production. As per the survey of MANTEC INC., among 60% of occupations across all sectors, 30% of tasks will be converted to automation.

Several benefits associated with automation in machinery include improved operation efficiency, reduced production cycle times and scale their production capacities to meet the growing market demands.

Also, it will lead to enhanced production quality by implementing strict quality control methods for wrap-around cartoners by employing cameras and sensors for careful detection of any kind of defects and ensuring consistency in terms of quality. With automation having benefits over traditional machines, the automation in wrap-around cartoners is expected to drive the market in the assessment period.

Not Profitable for Small and Medium Businesses with Low Output

Wrap-around cartons are best suited for manufacturers with high output because they greatly increase the pace of packaging the products into cartons offering higher volume manufacturing output. The investment costs associated with wrap-around cartoners are not very high for small and regional manufacturers, thus everybody cannot afford them.

Also, small and medium-sized businesses have lesser outputs as compared to bigger companies which results in high idle time of the machine affecting the productivity of the business and wastage of energy. As they require high investment costs and don’t offer the required benefits for small and medium-sized businesses, this factor may hamper the wrap-around cartoners market.

2020 to 2024 Global Wrap Around Cartoners Sales Outlook Compared to Demand Forecast from 2025 to 2035

The global wrap-around cartoners market recorded a CAGR of 1.7% during the historical period between 2020 and 2025. Market growth of the wrap-around cartoners pouch was positive as it reached a value of USD 1,515.6 million in 2025 from USD 1,394.3 million in 2020.

The wrap-around cartoners are used for packaging single products or group configurations which provides efficient protection for products during transit and on store shelves. These machines find application in many industries such as food, beverage, healthcare, personal care and cosmetics, homecare and others due to the need for protective packaging solutions.

Apart from its major applications in the above-mentioned industries, a variety of home care and DIY products like paint cans and coatings, adhesives, sealants, caulks, and tapes are packaged using wrap-around cartons to maintain product integrity, offer ease in handling and storage and also prevent the spillage or damage.

The reason for its high preference in many industries is because of its peculiar characteristics like space optimization as compared to other wrapping equipment and, the ability to incorporate features for compliance with regulatory requirements in industries like pharmaceuticals and medical devices. Also, many carton materials used are recyclable and sustainable, contributing to the overall environmental sustainability goals in packaging practices.

These beneficial characteristics encourage wrap-around cartoners manufacturers to develop such machines with improved speed and ability to handle higher production volumes. The rise in demand for safe packaging options from several end users is expected to create opportunities for the market.

Market Concentration

Tier 1 companies comprise market leaders with a market revenue of above USD 70 million capturing significant market share of 25% to 30% in global market. These market leaders are characterized by high production capacity and a wide product portfolio.

These market leaders are distinguished by their extensive expertise in manufacturing across multiple packaging formats and a broad geographical reach, underpinned by a robust consumer base. They provide a wide range of series including recycling and manufacturing utilizing the latest technology and meeting the regulatory standards providing the highest quality.

Prominent companies within tier 1 include Syntegon Technology GmbH, Coesia S.p.A., I.M.A. INDUSTRIA MACCHINE AUTOMATICHE S.P.A., OPTIMA packaging group GmbH and Omori Machinery Co. Ltd.

Tier 2 companies include mid-size players with revenue of USD 20 to 70 million having presence in specific regions and highly influencing the local market. These are characterized by a strong presence overseas and strong market knowledge. These market players have good technology and ensure regulatory compliance but may not have advanced technology and wide global reach.

Prominent companies in tier 2 include SHIBUYA CORPORATION, Mpac Group plc., HANGZHOU YOUNGSUN INTELLIGENT EQUIPMENT CO., LTD, Cama Group, Douglas Machine Inc., Econocorp Inc., Jacob White Packaging Ltd., Jochamp, EAR-FLAP® GROUP and Atlanta Packaging Technology and Machinery

Tier 3 includes the majority of small-scale companies operating at the local presence and serving niche markets having revenue below USD 20 million. These companies are notably oriented towards fulfilling local market demands and are consequently classified within the tier 3 share segment.

They are small-scale players and have limited geographical reach. Tier 3, within this context, is recognized as an unorganized market, denoting a sector characterized by a lack of extensive structure and formalization when compared to organized competitors.

Country-wise Insights

The section below covers the future forecast for the wrap around cartoners market in terms of countries. Information on key countries in several parts of the globe, including North America, Latin America, East Asia, South Asia and Pacific, Western Europe, Eastern Europe and MEA is provided.

Spain is anticipated to remain at the forefront in Europe, with a CAGR of 2.5% through 2035. In South Asia and Pacific, India is projected to witness a CAGR of 4.7% by 2035.

Countries Value CAGR (2025 to 2035)
USA 1.8%
Germany 1.1%
China 3.7%
UK 1.5%
Spain 2.5%
India 4.7%
Canada 1.4%

Surge in India's Pharmaceutical Drug Exports to Countries Across the Globe

The wrap around cartoners industry in India is projected to grow at a CAGR of 4.7% compared to other countries in the South Asia and Pacific region by 2035.

India is one of the largest providers of pharmaceutical drugs and generic medicines in the world. The country also exports wide range of drugs to more than 200 countries globally and the pharmaceutical industry is expected to generate USD 1.6 billion till 2025 and reach valuation of USD 2 billion by 2035, as reported by Invest India in 2025.

To export these products beyond the geographical boundaries, they require protective packaging solution to safeguard medicines from the impacts during the transport and storage.

Wrap around cartoner are thus used for providing secondary carton packaging due to its exclusive properties like easy handling and storage, protection during international transport and most importantly its compliance with the regulations, standards for packaging materials and recyclability.

Surging Demand for Protective Packaging in Germany Cosmetics

Germany’s wrap-around cartoner industry is expected to face huge demand due to the expansion of the cosmetics & personal care industry and the need for protective packaging solutions in the country. The country is anticipated to record a CAGR of 1.1% during the evaluation period.

The personal care and cosmetics industry in Germany is on the rise past few years because of increasing awareness of the benefits of skincare products for nourishment and beauty purposes. The country’s cosmetic and personal care products sale raised by 8.6% in 2025, as per the reports from the Industrieverband Koerperpflege- und Waschmittel e. V..

The personal care products such as creams, serums, and lotions, require efficient packaging solutions to avoid damage and spoilage. Applying spoiled skincare and cosmetic products can cause skin allergies which can have reverse impacts on the skin.

To prevent spoilage and to preserve the integrity of the product the industry is asking for a high demand for wrap-around cartoner machines that are well known for providing barrier and sturdy carton packaging, that keep these products away from external factors and make sure the customers receive the products with desired high quality.

Rising UK Food and Beverage Industry Spurs Demand for Secure Wrap-around Cartoners

The food and beverage industry in the UK is expected to create lucrative opportunities for the wrap-around cartoners market and record a CAGR of 1.5% in the assessment period. The food industry in the UK recorded a year-on-year growth of 13.2% in 2025 having major contributions to the country’s economy, as per the study by The Food and Drink Federation.

Due to the growth within these industries, there has been a necessity for secured packaging products such as cartons to avoid the tampering of beverage bottles, cans and other food products. The ability of wrap-around cartoners to fulfil the need for protective secondary packaging solutions will propel the wrap-around cartoner market over the forecast period.

Category-wise Insights

The section contains information about the leading segments in the industry. In terms of orientation, horizontal is estimated to account for a share of 86.1% by 2035. By capacity, the 70 to 150 cartons per minute segment is projected to dominate by holding a share of 33.2% by the end 2035.

Advantages of Horizontal Cartoners in Modern Packaging Solutions

Orientation Horizontal
Value CAGR (2035) 2.5%

Out of the two types of orientations, the horizontal wrap-around cartoners are expected to lead the market during the forecast period. Horizontal wrap-around cartoners are anticipated to rise at a CAGR of 2.5% and hold 86.1% of the total market share till the end of 2035.

Horizontal cartons are used more often than vertical orientation machines because of the distinct features possessed by them. Horizontal wrap-around cartoners have higher production speeds compared to vertical cartoners and it's suitable for products that need to maintain a specific orientation or stacking order inside the carton mostly for fragile or other delicate products that require careful handling during packaging.

These cartoners also have compact footprints as they accommodate less space for assembly and the packaging offered by these cartoners has finer aesthetics which offer better display options on retail shelves.

With the trend of integrating automated packaging systems, horizontal wrap-around cartons can be easily included in the existing production lines reducing the dependency on manual handling. Such advantageous factors over the vertical cartoners, make these horizontal cartoners the preferred choice in industries expecting high throughput and floor space is limited or where production lines need to be optimized for space efficiency.

Need for Safe and Efficient Packaging in Food Industry

Capacity 70 to 150 Cartons Per Minute
Value CAGR (2035) 2.3%

The 70 to 150 cartons per minute segment among other capacity range is estimated to lead the wrap-around cartoners market with a CAGR of 2.3% till 2035.

Wrap around cartoners are available in different capacity range, each of them having benefits in different end use industries.

The wrap around cartoners with 70 to 150 cartons per minute are used more often in food, healthcare, personal care and cosmetics industry because of the reliability and ease of operation as they require minimal downtime for maintenance and are capable of delivering consistent packaging quality and cost effective nature in comparison to high capacity machines as they require lower initial investment costs offering an equilibrium between performance and affordability.
Competitive Landscape

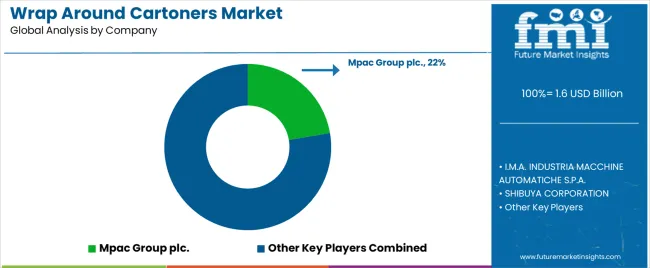
Wrap Around Cartoners Market Analysis By Company

Key players of wrap around cartoners industry are developing and launching new products in the market. They are integrating with different firms and extending their geographical presence. Few of them are also collaborating and partnering with local brands and start-up companies for new product development.

Key Developments in Wrap Around Cartoners Market

  • In May 2025, Mpac Group plc. Launched Langen OSTRO, a new automated side load cartoning machine, specifically designed to meet the distinct needs of customers looking for mid-range packaging solutions.
  • In February 2025, Coesia acquired AMC, LLC a manufacturer of material handling automation systems with integrated controls, as well as conveyors for integration into assembly systems and production lines.
  • In July 2025, Douglas introduced OPTX a continuous motion wraparound packaging machine to meet the evolving needs of manufacturers seeking seamless, high-speed, and cost-effective wraparound packaging options.

Key Players in Wrap Around Cartoners Market

  • Mpac Group plc.
  • I.M.A. INDUSTRIA MACCHINE AUTOMATICHE S.P.A.
  • SHIBUYA CORPORATION
  • Omori Machinery Co. Ltd.
  • Coesia S.p.A.
  • OPTIMA packaging group GmbH
  • HANGZHOU YOUNGSUN INTELLIGENT EQUIPMENT CO., LTD
  • Cama Group
  • Syntegon Technology GmbH
  • Douglas Machine Inc.
  • Econocorp Inc.
  • Jacob White Packaging Ltd.
  • Jochamp
  • EAR-FLAP® GROUP
  • Atlanta Packaging Technology and Machinery

Wrap Around Cartoners Market Segmentation

By Orientation:

In terms of orientation, the wrap-around cartoners market is divided into horizontal and vertical.

By Capacity:

Among capacity, the wrap-around cartoners market divided into less than 70 cartons per minute, 70 to 150 cartons per minute, 151 to 400 cartons per minute and above 400 cartons per minute.

By End Use:

Some of end users related to wrap-around cartoners market include food, beverage, healthcare, personal care and cosmetics, homecare and other industrial.

By Region:

Key countries of North America, Latin America, East Asia, South Asia and Pacific, Western Europe, Eastern Europe, Middle East and Africa are covered.

Frequently Asked Questions

How big is the wrap around cartoners market in 2025?

The global wrap around cartoners market is estimated to be valued at USD 1.6 billion in 2025.

What will be the size of wrap around cartoners market in 2035?

The market size for the wrap around cartoners market is projected to reach USD 2.0 billion by 2035.

How much will be the wrap around cartoners market growth between 2025 and 2035?

The wrap around cartoners market is expected to grow at a 2.5% CAGR between 2025 and 2035.

What are the key product types in the wrap around cartoners market?

The key product types in wrap around cartoners market are horizontal and vertical.

Which capacity segment to contribute significant share in the wrap around cartoners market in 2025?

In terms of capacity, 70 to 150 cartons per minute segment to command 35.0% share in the wrap around cartoners market in 2025.

Table of Content

  1. Executive Summary
    • Global Market Outlook
    • Demand-side Trends
    • Supply-side Trends
    • Technology Roadmap Analysis
    • Analysis and Recommendations
  2. Market Overview
    • Market Coverage / Taxonomy
    • Market Definition / Scope / Limitations
  3. Market Background
    • Market Dynamics
      • Drivers
      • Restraints
      • Opportunity
      • Trends
    • Scenario Forecast
      • Demand in Optimistic Scenario
      • Demand in Likely Scenario
      • Demand in Conservative Scenario
    • Opportunity Map Analysis
    • Product Life Cycle Analysis
    • Supply Chain Analysis
    • Investment Feasibility Matrix
    • Value Chain Analysis
    • PESTLE and Porter’s Analysis
    • Regulatory Landscape
    • Regional Parent Market Outlook
    • Production and Consumption Statistics
    • Import and Export Statistics
  4. Global Market Analysis 2020 to 2024 and Forecast, 2025 to 2035
    • Historical Market Size Value (USD Million) Analysis, 2020 to 2024
    • Current and Future Market Size Value (USD Million) Projections, 2025 to 2035
      • Y-o-Y Growth Trend Analysis
      • Absolute $ Opportunity Analysis
  5. Global Market Pricing Analysis 2020 to 2024 and Forecast 2025 to 2035
  6. Global Market Analysis 2020 to 2024 and Forecast 2025 to 2035, By Orientation
    • Introduction / Key Findings
    • Historical Market Size Value (USD Million) Analysis By Orientation , 2020 to 2024
    • Current and Future Market Size Value (USD Million) Analysis and Forecast By Orientation , 2025 to 2035
      • Horizontal
      • Vertical
    • Y-o-Y Growth Trend Analysis By Orientation , 2020 to 2024
    • Absolute $ Opportunity Analysis By Orientation , 2025 to 2035
  7. Global Market Analysis 2020 to 2024 and Forecast 2025 to 2035, By Capacity
    • Introduction / Key Findings
    • Historical Market Size Value (USD Million) Analysis By Capacity, 2020 to 2024
    • Current and Future Market Size Value (USD Million) Analysis and Forecast By Capacity, 2025 to 2035
      • 70 To 150 Cartons Per Minute
      • Less Than 70 Cartons Per Minute
      • 151 To 400 Cartons Per Minute
      • Above 400 Cartons Per Minute
    • Y-o-Y Growth Trend Analysis By Capacity, 2020 to 2024
    • Absolute $ Opportunity Analysis By Capacity, 2025 to 2035
  8. Global Market Analysis 2020 to 2024 and Forecast 2025 to 2035, By End Use
    • Introduction / Key Findings
    • Historical Market Size Value (USD Million) Analysis By End Use, 2020 to 2024
    • Current and Future Market Size Value (USD Million) Analysis and Forecast By End Use, 2025 to 2035
      • Food
      • Beverage
      • Healthcare
      • Personal Care And Cosmetics
      • Homecare
      • Other Industrial
    • Y-o-Y Growth Trend Analysis By End Use, 2020 to 2024
    • Absolute $ Opportunity Analysis By End Use, 2025 to 2035
  9. Global Market Analysis 2020 to 2024 and Forecast 2025 to 2035, By Region
    • Introduction
    • Historical Market Size Value (USD Million) Analysis By Region, 2020 to 2024
    • Current Market Size Value (USD Million) Analysis and Forecast By Region, 2025 to 2035
      • North America
      • Latin America
      • Western Europe
      • Eastern Europe
      • East Asia
      • South Asia and Pacific
      • Middle East & Africa
    • Market Attractiveness Analysis By Region
  10. North America Market Analysis 2020 to 2024 and Forecast 2025 to 2035, By Country
    • Historical Market Size Value (USD Million) Trend Analysis By Market Taxonomy, 2020 to 2024
    • Market Size Value (USD Million) Forecast By Market Taxonomy, 2025 to 2035
      • By Country
        • USA
        • Canada
        • Mexico
      • By Orientation
      • By Capacity
      • By End Use
    • Market Attractiveness Analysis
      • By Country
      • By Orientation
      • By Capacity
      • By End Use
    • Key Takeaways
  11. Latin America Market Analysis 2020 to 2024 and Forecast 2025 to 2035, By Country
    • Historical Market Size Value (USD Million) Trend Analysis By Market Taxonomy, 2020 to 2024
    • Market Size Value (USD Million) Forecast By Market Taxonomy, 2025 to 2035
      • By Country
        • Brazil
        • Chile
        • Rest of Latin America
      • By Orientation
      • By Capacity
      • By End Use
    • Market Attractiveness Analysis
      • By Country
      • By Orientation
      • By Capacity
      • By End Use
    • Key Takeaways
  12. Western Europe Market Analysis 2020 to 2024 and Forecast 2025 to 2035, By Country
    • Historical Market Size Value (USD Million) Trend Analysis By Market Taxonomy, 2020 to 2024
    • Market Size Value (USD Million) Forecast By Market Taxonomy, 2025 to 2035
      • By Country
        • Germany
        • UK
        • Italy
        • Spain
        • France
        • Nordic
        • BENELUX
        • Rest of Western Europe
      • By Orientation
      • By Capacity
      • By End Use
    • Market Attractiveness Analysis
      • By Country
      • By Orientation
      • By Capacity
      • By End Use
    • Key Takeaways
  13. Eastern Europe Market Analysis 2020 to 2024 and Forecast 2025 to 2035, By Country
    • Historical Market Size Value (USD Million) Trend Analysis By Market Taxonomy, 2020 to 2024
    • Market Size Value (USD Million) Forecast By Market Taxonomy, 2025 to 2035
      • By Country
        • Russia
        • Poland
        • Hungary
        • Balkan & Baltic
        • Rest of Eastern Europe
      • By Orientation
      • By Capacity
      • By End Use
    • Market Attractiveness Analysis
      • By Country
      • By Orientation
      • By Capacity
      • By End Use
    • Key Takeaways
  14. East Asia Market Analysis 2020 to 2024 and Forecast 2025 to 2035, By Country
    • Historical Market Size Value (USD Million) Trend Analysis By Market Taxonomy, 2020 to 2024
    • Market Size Value (USD Million) Forecast By Market Taxonomy, 2025 to 2035
      • By Country
        • China
        • Japan
        • South Korea
      • By Orientation
      • By Capacity
      • By End Use
    • Market Attractiveness Analysis
      • By Country
      • By Orientation
      • By Capacity
      • By End Use
    • Key Takeaways
  15. South Asia and Pacific Market Analysis 2020 to 2024 and Forecast 2025 to 2035, By Country
    • Historical Market Size Value (USD Million) Trend Analysis By Market Taxonomy, 2020 to 2024
    • Market Size Value (USD Million) Forecast By Market Taxonomy, 2025 to 2035
      • By Country
        • India
        • ASEAN
        • Australia & New Zealand
        • Rest of South Asia and Pacific
      • By Orientation
      • By Capacity
      • By End Use
    • Market Attractiveness Analysis
      • By Country
      • By Orientation
      • By Capacity
      • By End Use
    • Key Takeaways
  16. Middle East & Africa Market Analysis 2020 to 2024 and Forecast 2025 to 2035, By Country
    • Historical Market Size Value (USD Million) Trend Analysis By Market Taxonomy, 2020 to 2024
    • Market Size Value (USD Million) Forecast By Market Taxonomy, 2025 to 2035
      • By Country
        • Kingdom of Saudi Arabia
        • Other GCC Countries
        • Turkiye
        • South Africa
        • Other African Union
        • Rest of Middle East & Africa
      • By Orientation
      • By Capacity
      • By End Use
    • Market Attractiveness Analysis
      • By Country
      • By Orientation
      • By Capacity
      • By End Use
    • Key Takeaways
  17. Key Countries Market Analysis
    • USA
      • Pricing Analysis
      • Market Share Analysis, 2024
        • By Orientation
        • By Capacity
        • By End Use
    • Canada
      • Pricing Analysis
      • Market Share Analysis, 2024
        • By Orientation
        • By Capacity
        • By End Use
    • Mexico
      • Pricing Analysis
      • Market Share Analysis, 2024
        • By Orientation
        • By Capacity
        • By End Use
    • Brazil
      • Pricing Analysis
      • Market Share Analysis, 2024
        • By Orientation
        • By Capacity
        • By End Use
    • Chile
      • Pricing Analysis
      • Market Share Analysis, 2024
        • By Orientation
        • By Capacity
        • By End Use
    • Germany
      • Pricing Analysis
      • Market Share Analysis, 2024
        • By Orientation
        • By Capacity
        • By End Use
    • UK
      • Pricing Analysis
      • Market Share Analysis, 2024
        • By Orientation
        • By Capacity
        • By End Use
    • Italy
      • Pricing Analysis
      • Market Share Analysis, 2024
        • By Orientation
        • By Capacity
        • By End Use
    • Spain
      • Pricing Analysis
      • Market Share Analysis, 2024
        • By Orientation
        • By Capacity
        • By End Use
    • France
      • Pricing Analysis
      • Market Share Analysis, 2024
        • By Orientation
        • By Capacity
        • By End Use
    • India
      • Pricing Analysis
      • Market Share Analysis, 2024
        • By Orientation
        • By Capacity
        • By End Use
    • ASEAN
      • Pricing Analysis
      • Market Share Analysis, 2024
        • By Orientation
        • By Capacity
        • By End Use
    • Australia & New Zealand
      • Pricing Analysis
      • Market Share Analysis, 2024
        • By Orientation
        • By Capacity
        • By End Use
    • China
      • Pricing Analysis
      • Market Share Analysis, 2024
        • By Orientation
        • By Capacity
        • By End Use
    • Japan
      • Pricing Analysis
      • Market Share Analysis, 2024
        • By Orientation
        • By Capacity
        • By End Use
    • South Korea
      • Pricing Analysis
      • Market Share Analysis, 2024
        • By Orientation
        • By Capacity
        • By End Use
    • Russia
      • Pricing Analysis
      • Market Share Analysis, 2024
        • By Orientation
        • By Capacity
        • By End Use
    • Poland
      • Pricing Analysis
      • Market Share Analysis, 2024
        • By Orientation
        • By Capacity
        • By End Use
    • Hungary
      • Pricing Analysis
      • Market Share Analysis, 2024
        • By Orientation
        • By Capacity
        • By End Use
    • Kingdom of Saudi Arabia
      • Pricing Analysis
      • Market Share Analysis, 2024
        • By Orientation
        • By Capacity
        • By End Use
    • Turkiye
      • Pricing Analysis
      • Market Share Analysis, 2024
        • By Orientation
        • By Capacity
        • By End Use
    • South Africa
      • Pricing Analysis
      • Market Share Analysis, 2024
        • By Orientation
        • By Capacity
        • By End Use
  18. Market Structure Analysis
    • Competition Dashboard
    • Competition Benchmarking
    • Market Share Analysis of Top Players
      • By Regional
      • By Orientation
      • By Capacity
      • By End Use
  19. Competition Analysis
    • Competition Deep Dive
      • Mpac Group plc.
        • Overview
        • Product Portfolio
        • Profitability by Market Segments (Product/Age /Sales Channel/Region)
        • Sales Footprint
        • Strategy Overview
          • Marketing Strategy
          • Product Strategy
          • Channel Strategy
      • I.M.A. INDUSTRIA MACCHINE AUTOMATICHE S.P.A.
      • SHIBUYA CORPORATION
      • Omori Machinery Co. Ltd.
      • Coesia S.p.A.
      • OPTIMA packaging group GmbH
      • HANGZHOU YOUNGSUN INTELLIGENT EQUIPMENT CO., LTD
      • Cama Group
      • Syntegon Technology GmbH
      • Douglas Machine Inc.
      • Econocorp Inc.
      • Jacob White Packaging Ltd.
      • Jochamp
      • EAR-FLAP® GROUP
      • Atlanta Packaging Technology and Machinery
  20. Assumptions & Acronyms Used
  21. Research Methodology

List of Tables

  • Table 1: Global Market Value (USD Million) Forecast by Region, 2020 to 2035
  • Table 2: Global Market Value (USD Million) Forecast by Orientation , 2020 to 2035
  • Table 3: Global Market Value (USD Million) Forecast by Capacity, 2020 to 2035
  • Table 4: Global Market Value (USD Million) Forecast by End Use, 2020 to 2035
  • Table 5: North America Market Value (USD Million) Forecast by Country, 2020 to 2035
  • Table 6: North America Market Value (USD Million) Forecast by Orientation , 2020 to 2035
  • Table 7: North America Market Value (USD Million) Forecast by Capacity, 2020 to 2035
  • Table 8: North America Market Value (USD Million) Forecast by End Use, 2020 to 2035
  • Table 9: Latin America Market Value (USD Million) Forecast by Country, 2020 to 2035
  • Table 10: Latin America Market Value (USD Million) Forecast by Orientation , 2020 to 2035
  • Table 11: Latin America Market Value (USD Million) Forecast by Capacity, 2020 to 2035
  • Table 12: Latin America Market Value (USD Million) Forecast by End Use, 2020 to 2035
  • Table 13: Western Europe Market Value (USD Million) Forecast by Country, 2020 to 2035
  • Table 14: Western Europe Market Value (USD Million) Forecast by Orientation , 2020 to 2035
  • Table 15: Western Europe Market Value (USD Million) Forecast by Capacity, 2020 to 2035
  • Table 16: Western Europe Market Value (USD Million) Forecast by End Use, 2020 to 2035
  • Table 17: Eastern Europe Market Value (USD Million) Forecast by Country, 2020 to 2035
  • Table 18: Eastern Europe Market Value (USD Million) Forecast by Orientation , 2020 to 2035
  • Table 19: Eastern Europe Market Value (USD Million) Forecast by Capacity, 2020 to 2035
  • Table 20: Eastern Europe Market Value (USD Million) Forecast by End Use, 2020 to 2035
  • Table 21: East Asia Market Value (USD Million) Forecast by Country, 2020 to 2035
  • Table 22: East Asia Market Value (USD Million) Forecast by Orientation , 2020 to 2035
  • Table 23: East Asia Market Value (USD Million) Forecast by Capacity, 2020 to 2035
  • Table 24: East Asia Market Value (USD Million) Forecast by End Use, 2020 to 2035
  • Table 25: South Asia and Pacific Market Value (USD Million) Forecast by Country, 2020 to 2035
  • Table 26: South Asia and Pacific Market Value (USD Million) Forecast by Orientation , 2020 to 2035
  • Table 27: South Asia and Pacific Market Value (USD Million) Forecast by Capacity, 2020 to 2035
  • Table 28: South Asia and Pacific Market Value (USD Million) Forecast by End Use, 2020 to 2035
  • Table 29: Middle East & Africa Market Value (USD Million) Forecast by Country, 2020 to 2035
  • Table 30: Middle East & Africa Market Value (USD Million) Forecast by Orientation , 2020 to 2035
  • Table 31: Middle East & Africa Market Value (USD Million) Forecast by Capacity, 2020 to 2035
  • Table 32: Middle East & Africa Market Value (USD Million) Forecast by End Use, 2020 to 2035

List of Figures

  • Figure 1: Global Market Pricing Analysis
  • Figure 2: Global Market Value (USD Million) Forecast 2020-2035
  • Figure 3: Global Market Value Share and BPS Analysis by Orientation , 2025 and 2035
  • Figure 4: Global Market Y-o-Y Growth Comparison by Orientation , 2025-2035
  • Figure 5: Global Market Attractiveness Analysis by Orientation
  • Figure 6: Global Market Value Share and BPS Analysis by Capacity, 2025 and 2035
  • Figure 7: Global Market Y-o-Y Growth Comparison by Capacity, 2025-2035
  • Figure 8: Global Market Attractiveness Analysis by Capacity
  • Figure 9: Global Market Value Share and BPS Analysis by End Use, 2025 and 2035
  • Figure 10: Global Market Y-o-Y Growth Comparison by End Use, 2025-2035
  • Figure 11: Global Market Attractiveness Analysis by End Use
  • Figure 12: Global Market Value (USD Million) Share and BPS Analysis by Region, 2025 and 2035
  • Figure 13: Global Market Y-o-Y Growth Comparison by Region, 2025-2035
  • Figure 14: Global Market Attractiveness Analysis by Region
  • Figure 15: North America Market Incremental Dollar Opportunity, 2025-2035
  • Figure 16: Latin America Market Incremental Dollar Opportunity, 2025-2035
  • Figure 17: Western Europe Market Incremental Dollar Opportunity, 2025-2035
  • Figure 18: Eastern Europe Market Incremental Dollar Opportunity, 2025-2035
  • Figure 19: East Asia Market Incremental Dollar Opportunity, 2025-2035
  • Figure 20: South Asia and Pacific Market Incremental Dollar Opportunity, 2025-2035
  • Figure 21: Middle East & Africa Market Incremental Dollar Opportunity, 2025-2035
  • Figure 22: North America Market Value Share and BPS Analysis by Country, 2025 and 2035
  • Figure 23: North America Market Value Share and BPS Analysis by Orientation , 2025 and 2035
  • Figure 24: North America Market Y-o-Y Growth Comparison by Orientation , 2025-2035
  • Figure 25: North America Market Attractiveness Analysis by Orientation
  • Figure 26: North America Market Value Share and BPS Analysis by Capacity, 2025 and 2035
  • Figure 27: North America Market Y-o-Y Growth Comparison by Capacity, 2025-2035
  • Figure 28: North America Market Attractiveness Analysis by Capacity
  • Figure 29: North America Market Value Share and BPS Analysis by End Use, 2025 and 2035
  • Figure 30: North America Market Y-o-Y Growth Comparison by End Use, 2025-2035
  • Figure 31: North America Market Attractiveness Analysis by End Use
  • Figure 32: Latin America Market Value Share and BPS Analysis by Country, 2025 and 2035
  • Figure 33: Latin America Market Value Share and BPS Analysis by Orientation , 2025 and 2035
  • Figure 34: Latin America Market Y-o-Y Growth Comparison by Orientation , 2025-2035
  • Figure 35: Latin America Market Attractiveness Analysis by Orientation
  • Figure 36: Latin America Market Value Share and BPS Analysis by Capacity, 2025 and 2035
  • Figure 37: Latin America Market Y-o-Y Growth Comparison by Capacity, 2025-2035
  • Figure 38: Latin America Market Attractiveness Analysis by Capacity
  • Figure 39: Latin America Market Value Share and BPS Analysis by End Use, 2025 and 2035
  • Figure 40: Latin America Market Y-o-Y Growth Comparison by End Use, 2025-2035
  • Figure 41: Latin America Market Attractiveness Analysis by End Use
  • Figure 42: Western Europe Market Value Share and BPS Analysis by Country, 2025 and 2035
  • Figure 43: Western Europe Market Value Share and BPS Analysis by Orientation , 2025 and 2035
  • Figure 44: Western Europe Market Y-o-Y Growth Comparison by Orientation , 2025-2035
  • Figure 45: Western Europe Market Attractiveness Analysis by Orientation
  • Figure 46: Western Europe Market Value Share and BPS Analysis by Capacity, 2025 and 2035
  • Figure 47: Western Europe Market Y-o-Y Growth Comparison by Capacity, 2025-2035
  • Figure 48: Western Europe Market Attractiveness Analysis by Capacity
  • Figure 49: Western Europe Market Value Share and BPS Analysis by End Use, 2025 and 2035
  • Figure 50: Western Europe Market Y-o-Y Growth Comparison by End Use, 2025-2035
  • Figure 51: Western Europe Market Attractiveness Analysis by End Use
  • Figure 52: Eastern Europe Market Value Share and BPS Analysis by Country, 2025 and 2035
  • Figure 53: Eastern Europe Market Value Share and BPS Analysis by Orientation , 2025 and 2035
  • Figure 54: Eastern Europe Market Y-o-Y Growth Comparison by Orientation , 2025-2035
  • Figure 55: Eastern Europe Market Attractiveness Analysis by Orientation
  • Figure 56: Eastern Europe Market Value Share and BPS Analysis by Capacity, 2025 and 2035
  • Figure 57: Eastern Europe Market Y-o-Y Growth Comparison by Capacity, 2025-2035
  • Figure 58: Eastern Europe Market Attractiveness Analysis by Capacity
  • Figure 59: Eastern Europe Market Value Share and BPS Analysis by End Use, 2025 and 2035
  • Figure 60: Eastern Europe Market Y-o-Y Growth Comparison by End Use, 2025-2035
  • Figure 61: Eastern Europe Market Attractiveness Analysis by End Use
  • Figure 62: East Asia Market Value Share and BPS Analysis by Country, 2025 and 2035
  • Figure 63: East Asia Market Value Share and BPS Analysis by Orientation , 2025 and 2035
  • Figure 64: East Asia Market Y-o-Y Growth Comparison by Orientation , 2025-2035
  • Figure 65: East Asia Market Attractiveness Analysis by Orientation
  • Figure 66: East Asia Market Value Share and BPS Analysis by Capacity, 2025 and 2035
  • Figure 67: East Asia Market Y-o-Y Growth Comparison by Capacity, 2025-2035
  • Figure 68: East Asia Market Attractiveness Analysis by Capacity
  • Figure 69: East Asia Market Value Share and BPS Analysis by End Use, 2025 and 2035
  • Figure 70: East Asia Market Y-o-Y Growth Comparison by End Use, 2025-2035
  • Figure 71: East Asia Market Attractiveness Analysis by End Use
  • Figure 72: South Asia and Pacific Market Value Share and BPS Analysis by Country, 2025 and 2035
  • Figure 73: South Asia and Pacific Market Value Share and BPS Analysis by Orientation , 2025 and 2035
  • Figure 74: South Asia and Pacific Market Y-o-Y Growth Comparison by Orientation , 2025-2035
  • Figure 75: South Asia and Pacific Market Attractiveness Analysis by Orientation
  • Figure 76: South Asia and Pacific Market Value Share and BPS Analysis by Capacity, 2025 and 2035
  • Figure 77: South Asia and Pacific Market Y-o-Y Growth Comparison by Capacity, 2025-2035
  • Figure 78: South Asia and Pacific Market Attractiveness Analysis by Capacity
  • Figure 79: South Asia and Pacific Market Value Share and BPS Analysis by End Use, 2025 and 2035
  • Figure 80: South Asia and Pacific Market Y-o-Y Growth Comparison by End Use, 2025-2035
  • Figure 81: South Asia and Pacific Market Attractiveness Analysis by End Use
  • Figure 82: Middle East & Africa Market Value Share and BPS Analysis by Country, 2025 and 2035
  • Figure 83: Middle East & Africa Market Value Share and BPS Analysis by Orientation , 2025 and 2035
  • Figure 84: Middle East & Africa Market Y-o-Y Growth Comparison by Orientation , 2025-2035
  • Figure 85: Middle East & Africa Market Attractiveness Analysis by Orientation
  • Figure 86: Middle East & Africa Market Value Share and BPS Analysis by Capacity, 2025 and 2035
  • Figure 87: Middle East & Africa Market Y-o-Y Growth Comparison by Capacity, 2025-2035
  • Figure 88: Middle East & Africa Market Attractiveness Analysis by Capacity
  • Figure 89: Middle East & Africa Market Value Share and BPS Analysis by End Use, 2025 and 2035
  • Figure 90: Middle East & Africa Market Y-o-Y Growth Comparison by End Use, 2025-2035
  • Figure 91: Middle East & Africa Market Attractiveness Analysis by End Use
  • Figure 92: Global Market - Tier Structure Analysis
  • Figure 93: Global Market - Company Share Analysis
Dashboard
Dashboard
Dashboard
Dashboard
Dashboard
Dashboard

Full Research Suite comprises of:

Market outlook & trends analysis

Market outlook & trends analysis

Interviews & case studies

Interviews & case studies

Strategic recommendations

Strategic recommendations

Vendor profiles & capabilities analysis

Vendor profiles & capabilities analysis

5-year forecasts

5-year forecasts

8 regions and 60+ country-level data splits

8 regions and 60+ country-level data splits

Market segment data splits

Market segment data splits

12 months of continuous data updates

12 months of continuous data updates

DELIVERED AS:

PDF EXCEL ONLINE

Full Research Suite


$5000

$7500

$10000

Buy Report Now
Similar Industry Reports

Similar Industry Reports

Wrapping and Bundling Machines Market

Wrapping and Bundling Machines Market Size and Share Forecast Outlook 2025 to 2035

Wrapping Tissues Market

Wrapping Tissues Market Analysis – Size & Forecast 2024-2034

Wrapping Machine Market

Wrapping Machine Market

Wraparound Case Packers Market

Wraparound Case Packers Market Size and Share Forecast Outlook 2025 to 2035

Wrap Around Label Films Market

Wrap Around Label Films Market Size and Share Forecast Outlook 2025 to 2035

Wrap-Around Label Market Share Analysis

Market Positioning & Share in the Wrap-Around Label Industry

Wrap-Around Label Market

Wrap-Around Label Market from 2025 to 2035

Wrap Around Labelling Machine Market

Wrap Around Labelling Machine Market

C Wrap Labelling Machine Market

C Wrap Labelling Machine Market

Overwrapping Machines Market

Overwrapping Machines Market Size and Share Forecast Outlook 2025 to 2035

Overwrapping Machines Market Share Analysis

Market Share Distribution Among Overwrapping Machine Manufacturers

Flow Wrappers Market

Flow Wrappers Market Size and Share Forecast Outlook 2025 to 2035

Greenwrap Market
Greenwrap Market

Greenwrap Market Analysis - Size, Share, and Forecast Outlook 2025 to 2035

Book Wraps Market
Book Wraps Market

Book Wraps Market Size and Share Forecast Outlook 2025 to 2035

Flow Wrap Packaging Market

Flow Wrap Packaging Market Growth from 2025 to 2035

Flow Wrap Machines Market

Flow Wrap Machines Market by Horizontal & Vertical Systems Through 2025 to 2035

Hand Wrappers Market

Hand Wrappers Market Trends - Growth & Forecast 2025 to 2035

Flow Wrap Machines Market Analysis

Flow Wrap Machines Market Analysis – Size, Share & Industry Trends 2025-2035

Book Wraps Market Share Analysis

Industry Share & Competitive Positioning in Book Wraps Market

Stem Wrap Market
Stem Wrap Market

Stem Wrap Market Trends – Growth & Demand Forecast 2024-2034

Future Market Insights

Wrap Around Cartoners Market

Chat With MaRIA

Chat With

MaRIA

Hi There, I am MaRIA, Your Market Research Intelligence Assistant. How may I help you?