AI based Triage Tools Market Size and Share Forecast Outlook 2025 to 2035

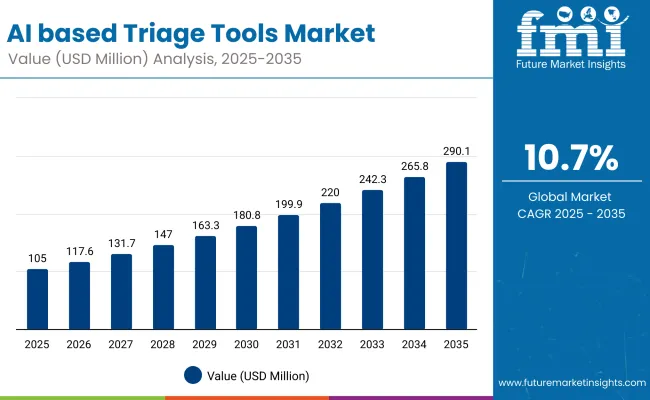
The Global AI based Triage Tools Market has been forecasted to attain a valuation of USD 104.97 million in 2025, rising to USD 290.10 million by 2035, resulting in an incremental gain of USD 185.1 million, which reflects a 36.2% increase over the forecast decade. A compound annual growth rate (CAGR) of 10.7% is expected to be recorded, indicating a rapid expansion trajectory for the global AI based triage tools market.
Ai Based Triage Tools Market

Global AI based Triage Tools Market Key Takeaways

Metric Value
Global AI based Triage Tools Market Estimated Value in (2025E) USD 104.9 million
Global AI based Triage Tools Market Forecast Value in (2035F) USD 290.1 million
Forecast CAGR (2025 to 2035) 10.7 %

Between 2025 and 2030, AI-based triage tools are expected to see broader adoption across hospitals, diagnostic imaging centers, and specialty clinics, as healthcare providers increasingly rely on AI to streamline patient prioritization, reduce diagnostic delays, and optimize workflow efficiency.

It will grow upto USD 69.5 million in that period from USD 104.9 million in 2025 to USD 174.5 million in 2030. Advances in deep learning algorithms, integration with electronic health records (EHRs), and user-friendly interfaces are making these solutions more accessible, driving adoption even among mid-tier hospitals and outpatient facilities.

Between 2030 and 2035, the market is projected to expand further by USD 115.6 million, fueled by demand from specialized care units, telemedicine platforms, and emergency response systems. Continuous improvements in natural language processing, real-time predictive analytics, and multi-modal imaging integration will define the next generation of AI-based triage tools, enabling faster, more accurate patient risk stratification.

From 2020 to 2024, the global AI based triage tools market, expanded from USD 60.4million to USD 95.7 million, transitioning from early-stage pilot deployments in select hospitals to broader commercial adoption. During this period, technology vendors partnered with healthcare institutions to integrate AI models with hospital IT infrastructure, optimize clinical workflows, and ensure regulatory compliance laying the foundation for widespread adoption of AI-driven patient triage across healthcare systems.

Looking ahead, the AI-based triage ecosystem is expected to evolve with real-time decision support, predictive outcome modeling, and interoperability with other clinical decision-making tools such as diagnostic imaging AI and remote patient monitoring. These innovations aim to reduce clinical workload, enhance patient outcomes, and expand adoption across diverse healthcare settings, positioning AI-based triage tools as a core component of modern healthcare delivery.

Why the Global AI based Triage Tools Market is growing?

The growth of the global AI based triage tools market is reinforced by the unique ability of these solutions to rapidly assess patient risk levels, prioritize care delivery, and optimize healthcare workflows capabilities that conventional triage and manual systems cannot match. By combining advanced algorithms with multimodal data inputs, AI-based triage tools provide real-time insights into patient acuity, enabling faster and more accurate decision-making in high-pressure clinical environments.

Over the last decade, the scope of AI-based triage has expanded beyond experimental pilot projects into mainstream healthcare delivery. Hospitals, emergency departments, and telemedicine providers now rely on these tools to reduce wait times, enhance diagnostic accuracy, and allocate limited resources more effectively. As patient volumes rise and healthcare systems face workforce shortages, AI-driven triage is becoming an indispensable component of digital health infrastructure.

Another factor driving adoption is the integration of triage tools with existing clinical workflows. Vendors are offering turnkey platforms that seamlessly connect with electronic health records (EHRs), imaging systems, and hospital IT networks, minimizing setup complexity and ensuring interoperability. This ease of deployment is accelerating adoption not only in advanced healthcare systems but also in mid-sized hospitals and emerging-market healthcare networks.

Moreover, increasing demand from interdisciplinary domains including emergency medicine, radiology, and telehealth is fostering the development of specialized triage solutions, such as imaging-based AI triage for stroke and cardiac events or symptom-checker integration for remote patient management. These innovations are directly addressing the need for scalable, cost-efficient, and accurate patient assessment across diverse care settings.

Collectively, these clinical and technological drivers are positioning the AI-based triage tools market for sustained expansion, fueled by its critical role in enhancing patient outcomes, improving healthcare efficiency, and supporting the broader transformation toward AI-powered medical ecosystems.

Segmental Analysis

The market is segmented by type, component, deployment, end user, and region.Type includes pre-hospital triage, hospital-based triage, disaster/mass casualty triage, tele-/remote/virtual triage, and others. Component classification covers software, hardware, services, wearables/IoT integration, and others. Based on deployment, the segmentation includes on-premises, cloud-based, web-based, and mobile/app-based.

By end user, the market is segmented into hospitals/emergency departments, ambulatory surgical centers, clinics, telemedicine providers/virtual clinics, and others. Regionally, the scope spans North America, Latin America, Western and Eastern Europe, East Asia, South Asia and Pacific, and the Middle East and Africa.
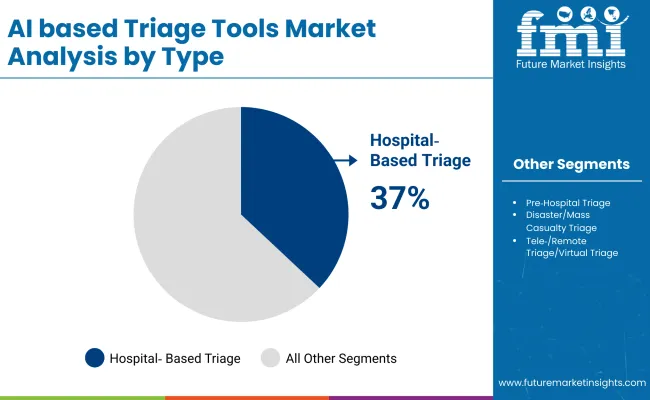
Insights into the Type Segment with Hospitalbased Triage Leading the Demand

Ai Based Triage Tools Market By Type

Type Market Value Share, 2025
Pre hospital Triage 16.4%
Hospital based Triage 37.0%
Disaster/Mass Casualty Triage 7.0%
Tele /Remote Triage/Virtual Triage 26.0%
Others 13.6%

Hospital-based triage is projected to lead the type category with a 37.0% market share in 2025, and is expected to maintain this dominance due to its pivotal role in emergency and acute care environments. Unlike pre-hospital or remote triage models, hospital-based systems integrate directly into emergency departments and inpatient workflows allowing providers to prioritize patients based on acuity, resource availability, and treatment urgency with unmatched reliability. These solutions form the foundation of structured patient flow management, ensuring that life-saving interventions are directed to the most critical cases first.

Recent advances in AI-driven algorithms, EHR integration, and predictive analytics have significantly enhanced hospital-based triage capabilities. Modern platforms can automate acuity scoring, streamline admissions, and generate real-time alerts for conditions such as sepsis or cardiac arrest functions that were previously reliant on manual assessment. Moreover, the incorporation of natural language processing and imaging-based decision support allows for faster, more accurate categorization across diverse patient presentations.

A key factor driving this segment’s strength is its institutional adoption at scale. Hospitals worldwide are increasingly implementing standardized triage protocols supported by software platforms that require minimal calibration and training. With the rise of cloud and mobile-compatible solutions, deployment is no longer confined to tertiary centers community hospitals and regional facilities are also rapidly adopting these tools.

As global healthcare systems continue to experience rising patient volumes and resource constraints, hospital-based triage remains indispensable. Its ability to balance patient safety with operational efficiency ensures that it continues to serve as the backbone of modern triage workflows, cementing its position as the dominant model across emergency and inpatient care settings.
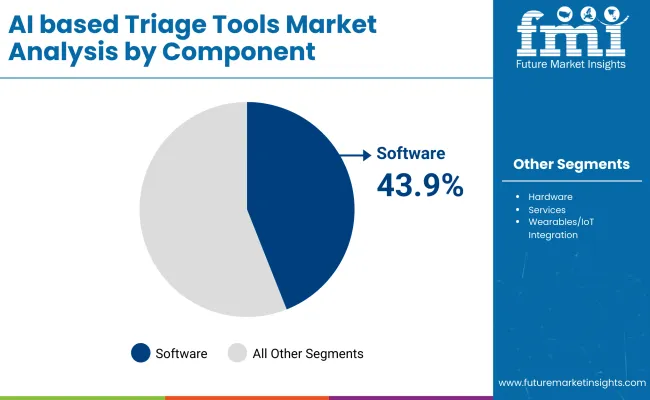
Insights into the component segment with software dominating the market

Ai Based Triage Tools Market By Component

Component Market Value Share, 2025
Software 43.9%
Hardware 24.3%
Services 15.6%
Wearables / IoT Integration 9.2%
Others 7.0%

Software continues to dominate the component landscape, accounting for 43.9% of total demand in 2025. This segment forms the backbone of AI-enabled triage, driving the core functionalities that allow healthcare providers to rapidly assess, categorize, and prioritize patients across diverse care settings. By embedding advanced algorithms, decision-support frameworks, and interoperability with electronic health records (EHRs), software solutions deliver the intelligence layer that underpins modern triage workflows.

What makes software irreplaceable is its scalability, adaptability, and continual evolution through updates and AI model training. Hospitals, clinics, and telemedicine providers can implement triage software without major hardware overhauls, enabling cost-efficient adoption. Many platforms are cloud-based, making them accessible in both high-resource hospitals and smaller or rural facilities. Over time, these systems accumulate large patient datasets, enhancing predictive accuracy and supporting comparative studies across populations.

Recent improvements in user interfaces, natural language processing, and predictive analytics have further advanced the usability and precision of software-driven triage. Integration with real-time monitoring systems and imaging tools has expanded their scope beyond symptom-checking, making them indispensable in detecting acute conditions such as sepsis, stroke, or cardiac events.

A key driver of this segment’s dominance is the institutional demand for workflow optimization. As healthcare facilities face rising patient volumes and resource strain, software solutions provide automated prioritization, reduce human error, and ensure compliance with standardized triage protocols. Additionally, their modular architecture allows customization for specific clinical environments ranging from emergency departments to virtual clinics.

While hardware, services, and IoT-enabled wearables are gaining ground in complementary roles, software remains the mainstay of the AI triage tools market, largely due to its versatility, accessibility, and central role in enabling data-driven decision-making across the healthcare ecosystem.

What are the Drivers, Restraints, and Key Trends of the Global AI based Triage Tools Market?

The adoption of AI-based triage tools is accelerating across healthcare systems worldwide as technological and clinical advancements converge to improve patient assessment and care delivery. While the market is expanding rapidly, adoption also faces structural challenges tied to infrastructure, data management, and staff readiness.

Rising patient volumes and clinician shortages are boosting adoption of AI based triage toolsThe global healthcare sector is experiencing unprecedented patient demand, driven by aging populations, increasing chronic disease prevalence, and a rising incidence of complex medical conditions. This surge in patient volume has placed significant strain on healthcare providers, contributing to clinician burnout and inefficiencies in patient flow management. AI-based triage tools have emerged as a strategic solution to address these challenges.

By leveraging advanced algorithms and machine learning models, these systems can automatically assess patient symptoms, prioritize high-risk cases, and recommend appropriate care pathways. This reduces the burden on medical staff, minimizes delays in patient evaluation, and optimizes resource allocation.

Hospitals, outpatient clinics, and telehealth platforms are increasingly deploying AI triage solutions to streamline operations while maintaining quality of care. Industry analysts note that these technologies not only enhance operational efficiency but also support better clinical decision-making by providing standardized, evidence-based guidance. As healthcare demand continues to rise globally, the adoption of AI-based triage tools is expected to accelerate, positioning them as a critical component in modern healthcare delivery and digital transformation strategies.

Shift to cloud- and mobile-enabled triage platforms for 24/7 accessCloud deployment offers centralized storage, real-time AI model updates, and seamless integration with electronic health records (EHRs) and telehealth systems, reducing reliance on local IT infrastructure. This enables healthcare providers to scale services efficiently across multiple sites while maintaining data consistency and accessibility.

Mobile-enabled triage solutions further enhance patient engagement by providing 24/7 access to symptom assessment tools through smartphones, tablets, and web applications. Patients in remote or underserved regions can receive timely guidance, reducing unnecessary hospital visits and improving overall care accessibility.

Additionally, cloud-based platforms facilitate data analytics and predictive insights, enabling providers to identify high-risk populations and manage care proactively. Experts suggest that this shift not only expands the reach of AI-based triage solutions but also supports integration with other digital health services, including telemedicine consultations and remote monitoring. As a result, cloud and mobile adoption is becoming a defining factor in the competitive positioning of vendors and the overall growth trajectory of the market.

Integration challenges with hospital IT systems and data privacy compliance.

Integrating AI triage systems with existing hospital IT infrastructure, including electronic health records (EHRs) and patient management platforms, often requires significant customization and workflow alignment. Legacy systems in many healthcare facilities may lack interoperability, creating additional barriers for seamless deployment. In addition, strict regulatory frameworks governing patient data privacy and security, such as HIPAA in the United States and GDPR in Europe, necessitate robust safeguards to protect sensitive health information.

Non-compliance can lead to substantial legal and financial repercussions, deterring smaller hospitals and clinics from adopting these solutions. Moreover, ongoing maintenance, software updates, and training of medical personnel are required to ensure accurate use and interpretation of AI-generated outputs.

Analysts highlight that these integration and compliance challenges may slow market penetration, particularly in resource-limited settings. Consequently, while AI-based triage tools offer significant potential for improving efficiency and patient outcomes, overcoming these technical and regulatory barriers remains critical for realizing their full adoption across global healthcare systems.
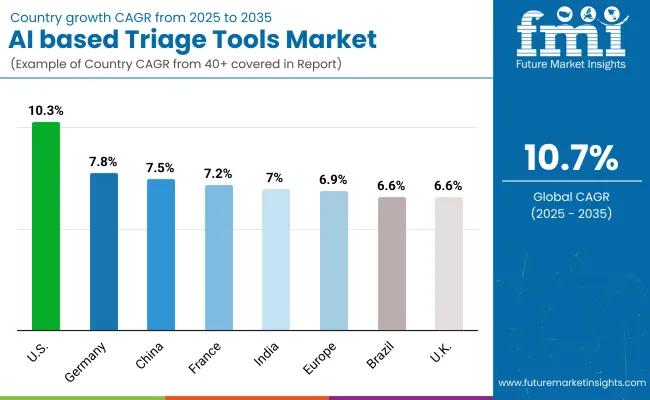
Analysis of Global AI based Triage Tools Market, By Key Countries

Ai Based Triage Tools Market Country Wise Analysis

Country CAGR
USA 10.3%
Brazil 6.6%
China 7.5%
India 7.0%
Europe 6.9%
Germany 7.8%
France 7.2%
UK 6.6%

The adoption and growth patterns of AI-based triage tools vary across regions, shaped by healthcare infrastructure maturity, regulatory frameworks, and the prevalence of digital health initiatives.

In the United States, the market is driven by a combination of high patient volumes, advanced hospital networks, and widespread adoption of electronic health records (EHRs). Hospitals and emergency departments are increasingly integrating AI-based triage systems to optimize patient flow, reduce wait times, and enhance critical decision-making.

Telemedicine providers and virtual care platforms are also accelerating adoption, supported by favorable reimbursement policies and regulatory support for digital health solutions. The USA market benefits from significant investments in AI healthcare technologies, a robust vendor ecosystem, and early adoption by leading academic medical centers. The market is projected to grow at a CAGR of 10.3%.

In Europe, countries such as Germany, France, and the UK are leading the adoption of AI-based triage tools, driven by advanced healthcare infrastructure, supportive government initiatives, and the growing integration of digital health solutions. Hospitals and emergency departments are increasingly deploying AI-driven triage systems to optimize patient flow, improve care prioritization, and enhance operational efficiency. Telemedicine and cloud-based platforms further support market expansion, particularly in remote and outpatient care settings.

The market is projected to account for 8.2% in Germany, 7.6% in France, and 6.9% in the UK, reflecting both the maturity of healthcare systems and the cautious yet steady adoption of AI technologies. Regulatory support, strategic funding, and investments in healthcare digitization continue to foster growth, while considerations around data security, staff training, and workflow integration moderate the pace of adoption.

Overall, the AI-based triage tools market in Europe reflects a careful balance between technological innovation, policy support, and institutional readiness, highlighting the key role that regional healthcare priorities and infrastructure play in shaping adoption trajectories.
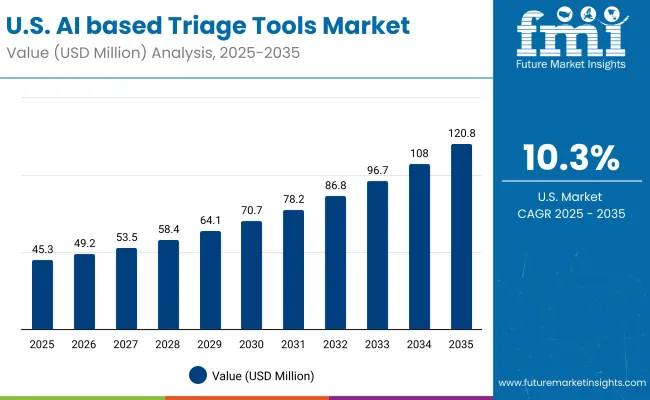
Sales Outlook for Global AI based Triage Tools in the United States

Usa Ai Based Triage Tools Market

The AI-based triage tools market in the United States is projected to grow at a CAGR of 10.3% between 2025 and 2035. The USA remains the most mature and research-intensive market for AI-enabled triage, with wide integration into hospital emergency departments, large health systems, and telemedicine networks. Academic medical centers such as Mayo Clinic, Cleveland Clinic, and Johns Hopkins Hospital have been pivotal in demonstrating the clinical value of AI triage in emergency care and inpatient workflows.

  • Commercial interest from hospital networks and digital health startups is driving adoption, particularly for patient flow optimization and early warning systems.
  • Vendors such as Canon Medical Systems, and Fujifilm are developing AI-integrated imaging platforms with predictive algorithms and EHR interoperability, reducing staff training time and enhancing usability. These solutions enable automated workflow management, faster image analysis, and improved diagnostic consistency, allowing healthcare facilities to adopt advanced imaging technologies with minimal disruption to existing operations.
  • Cross-disciplinary collaborations between clinicians, data scientists, and IT specialists are fostering hybrid programs where AI triage is integrated with remote monitoring, wearable devices, and telehealth platforms.

Growth and Expansion Outlook for Global AI based Triage Tools Market in India

The global AI-based triage tools market in India is expected to grow at a CAGR of 7.0% between 2025 and 2035, driven by rising healthcare digitization and increased adoption of telemedicine. Hospitals and health networks in Delhi, Mumbai, and Bangalore are pioneering AI-enabled triage implementations, but widespread deployment remains limited due to infrastructure gaps and uneven digital literacy.

  • Most deployments are grant- or government-funded, with pilot projects supported by initiatives from the Ministry of Health and state digital health programs.
  • Telemedicine adoption is critical, as AI-based triage is often combined with virtual consultations to extend access to rural and underserved areas.
  • Startups and small vendors are experimenting with cost-effective AI solutions, including mobile-based and cloud-hosted platforms, to overcome infrastructure and training barriers.

Sales Outlook for Global AI based Triage Tools in China

China’s global AI-based triage tools market is projected to expand at a CAGR of 7.5% from 2025 to 2035. Growth is driven by government investment in smart hospital infrastructure, large-scale telehealth platforms, and AI-powered patient management systems. Tsinghua University has officially launched Agent Hospital, the world’s first fully AI-powered virtual hospital.

This facility employs autonomous AI agents to simulate the entire patient care cycle, including triage. Powered by the MedAgent-Zero framework developed by Tsinghua’s Institute for AI Industry Research (AIR), Agent Hospital enables AI agents to self-evolve by interacting with simulated patients.
  • Domestic vendors such as Neusoft Corporation and Winning Health Technology Group are offering modular, scalable platforms designed for both large hospitals and smaller community clinics, focusing on easy integration with existing HIS and EHR systems.
  • Integration with wearables and IoT devices allows real-time patient monitoring and dynamic triage decisions.
  • Regional governments provide co-funding and incentives for adoption in Tier 1 and Tier 2 cities, expanding the market beyond major metropolitan centers.

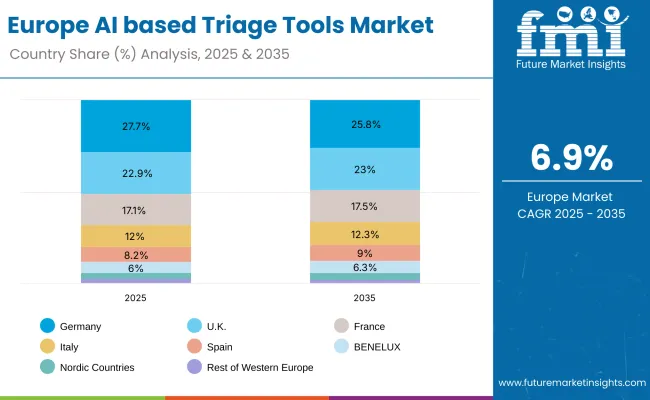
Sales Outlook for Global AI based Triage Tools in Europe

Europe Ai Based Triage Tools Market

Europe Country 2025
Germany 27.7%
UK 22.9%
France 17.1%
Italy 12.0%
Spain 8.2%
BENELUX 6.0%
Nordic Countries 3.4%
Rest of Western Europe 2.7%
Europe Country 2035
Germany 25.8%
UK 23.0%
France 17.5%
Italy 12.3%
Spain 9.0%
BENELUX 6.3%
Nordic Countries 4.1%
Rest of Western Europe 2.0%

Growth and Expansion Outlook for Global AI based Triage Tools Market in the United Kingdom

The AI-based triage tools market in the United Kingdom is projected to grow at a CAGR of 6.6% between 2025 and 2035. The market is supported by advanced hospital networks, national digital health initiatives, and growing interest in AI-enabled patient triage. NHS institutions are actively piloting AI-based triage systems to enhance patient care. For instance, King's College Hospital and Guy's and St Thomas' NHS Foundation Trusts are collaborating with King's College London and UCL to develop and test AI tools that predict medical events and support clinical decision-making.

  • Government-backed programs, including NHSX and the NHS AI Lab, provide funding and guidance for AI adoption in clinical workflows.
  • Pilot programs and cross-institution training improve staff readiness and demonstrate AI efficacy in patient triage.
  • AI triage solutions are also being explored in private clinics and virtual care platforms to extend access to outpatient and telemedicine services.

In-depth Analysis of Global AI based Triage Tools in Germany

The AI-based triage tools market in Germany is expected to grow at a CAGR of 7.8% between 2025 and 2035. Germany’s strong healthcare infrastructure, emphasis on hospital digitization, and academic research programs are driving interest in AI triage solutionsCharité’s AI Hub and the Charité Lab for Artificial Intelligence in Medicine (CLAIM) develop and validate machine learning models, including predictive algorithms relevant to emergency and outpatient triage.

Real-world testing provides insights into accuracy, reliability, and usability, supporting both local adoption and global applications. These initiatives contribute directly to the growth and deployment of AI-based triage tools in the international healthcare market.
  • German vendors offer modular, interoperable AI platforms compatible with hospital information systems (HIS) and electronic health records (EHRs).
  • AI triage is being combined with telemedicine, wearable monitoring, and remote patient assessment programs to enhance care delivery.
  • Federal and regional funding initiatives support adoption in urban and regional hospitals, expanding reach beyond major metropolitan centers.

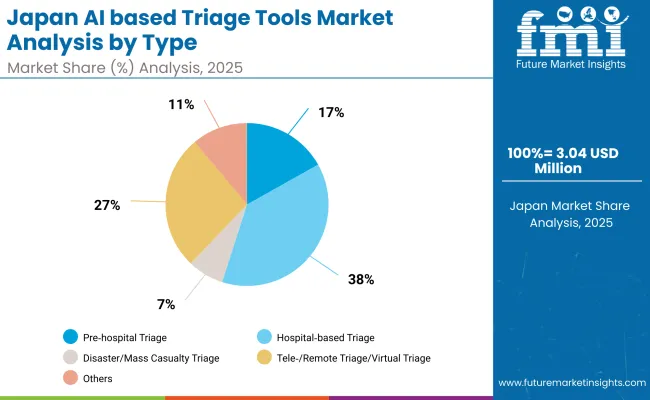
Growth Outlook for Global AI based Triage Tools Market in Japan

Japan Ai Based Triage Tools Market By Type

Type Market Value Share, 2025
Pre hospital Triage 16.9%
Hospital based Triage 38.1%
Disaster/Mass Casualty Triage 7.2%
Tele /Remote Triage/Virtual Triage 26.8%
Others 11.1%

The AI-based triage tools market in Japan has been projected to reach USD 3.0 million by 2025 with hospital-based triage leading the landscape at 38.1%, followed by tele-/remote triage at 26.8%. The market is shaped by Japan’s strong emphasis on digital healthcare, emergency medicine, and telehealth innovation.

Hospitals and healthcare institutions, including University of Tokyo Hospital, Keio University Hospital, and Osaka University Hospital, are increasingly piloting AI-driven triage systems to improve patient prioritization, optimize workflow, and extend care access to both urban and rural areas.

Many institutions are implementing AI platforms that integrate predictive algorithms, electronic health record (EHR) interoperability, and remote monitoring, enabling real-time triage decisions across pre-hospital, in-hospital, and virtual care settings. This multi-modal approach allows clinicians to respond more effectively to high-acuity cases, monitor chronic patients remotely, and manage patient flow during emergencies.
  • Government initiatives and digital health programs are providing funding for AI-based triage pilot projects and research collaborations across hospitals and telemedicine networks.
  • Tele- and remote triage is gaining traction, leveraging wearable devices and IoT-enabled monitoring to extend access to underserved regions.
  • Hospital-based deployments are supported by advanced clinical IT infrastructure, enabling seamless integration of AI recommendations into emergency department workflows.

Opportunity Analysis of South Korea Global AI based Triage Tools Market

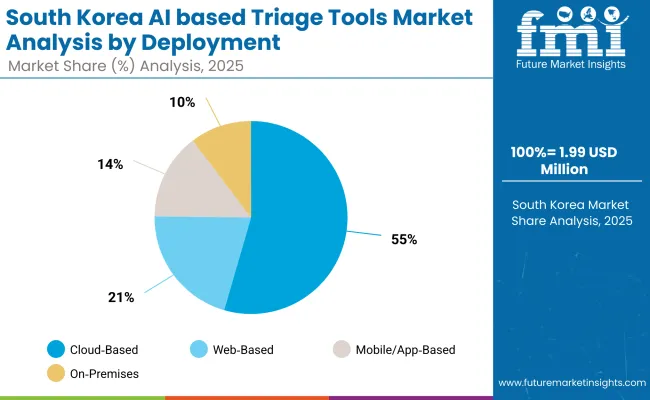
South Korea Ai Based Triage Tools Market By Deployment

Deployment Market Value Share, 2025
On premises 10.3%
Cloud based 54.5%
Web based 20.7%
Mobile/App based 14.5%

The AI-based triage tools market in South Korea has been projected to reach USD 1.99 million in 2025 with cloud-based deployment leading the segment at 54.5%, followed by web-based platforms at 20.7%. South Korea’s market is evolving from pilot projects in major hospitals toward broader national adoption across emergency care, telemedicine, and digital health services.

Leading institutions such as Seoul National University Hospital, Samsung Medical Center, and Asan Medical Center are actively testing AI triage platforms to optimize patient flow, improve early warning systems, and integrate remote monitoring with in-hospital workflows.

Many hospitals are deploying cloud-enabled AI platforms that combine predictive algorithms, electronic health record (EHR) interoperability, and real-time patient monitoring, enabling rapid triage decisions across multiple care settings. This approach allows clinicians to prioritize high-acuity cases efficiently, support telemedicine consultations, and extend triage capabilities to regional and rural healthcare centers.
  • Government initiatives and national digital health programs are providing funding for AI-based triage pilots, research collaborations, and infrastructure upgrades.
  • Cloud and web-based solutions are gaining traction due to high internet penetration, robust healthcare IT infrastructure, and centralized data analytics platforms.
  • Mobile/app-based deployment supports remote triage, real-time alerts, and integration with wearable devices, enabling adaptive care for both urban and underserved regions.

Competitive Landscape of Global AI based Triage Tools Market

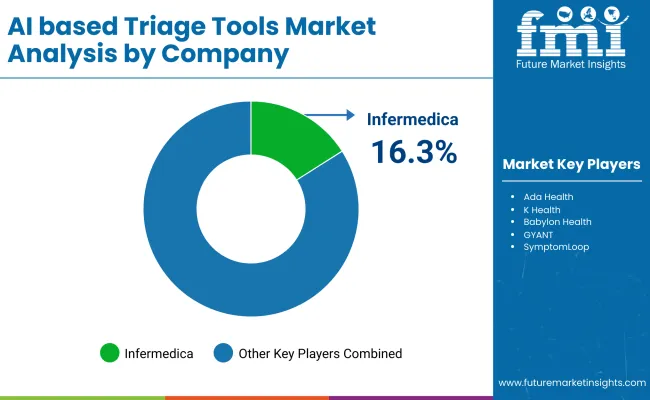
Ai Based Triage Tools Market By Company

Company Global Value Share 2024
Infermedica 16.3%
Others 83.7%

The AI-based triage tools market is moderately concentrated, with Infermedica holding a leading global position due to its advanced AI symptom checker, clinical decision support algorithms, and seamless integration with electronic health record (EHR) systems.

The company’s dominance is rooted in its platform approach offering cloud-based and mobile-compatible solutions, predictive triage analytics, and workflow optimization tools. Infermedica also provides robust support for multi-language deployment and telemedicine integration, positioning itself as a go-to vendor for AI-assisted patient triage across hospitals, clinics, and virtual care networks.

Other key players include Ada Health, K Health, Babylon Health, GYANT, Rapid Health, SymptomLoop, Sully.ai, Predictmedix, aiTriage, Aidoc, Mediktor, Buoy Health, Sensely, HealthTap, TriageLogic, and eConsult Health, each addressing different segments of the AI triage ecosystem.

Key Developments in Global AI based Triage Tools Market

  • On November, 2024 Infermedica introduced "Conversational Triage," integrating Large Language Models (LLMs) with Bayesian knowledge graphs. This tool aims to enhance patient navigation by providing personalized medical guidance.
  • On October 2023, Rapid Health's launched Smart Triage, which is a fully autonomous AI-powered system that automates patient triage and appointment booking, helping practices meet the 2025 GP contract requirements by enabling 24/7 online access and reducing staff workload, the system was being implemented at various GP practices across the UK, including Park Medical Practice.

Scope of the Report

Item Value
Quantitative Units USD 104.97 million
By Type Pre hospital triage, hospital based triage, disaster/mass casualty triage, tele /remote triage/virtual triage, others
Component Software, hardware, services, wearables / IoT integration, others
Deployment On premises, cloud based, web based, mobile/app based
Regions Covered North America, Latin America, Western Europe, Eastern Europe, East Asia, South Asia & Pacific, Middle East & Africa
Countries Covered USA, Brazil, China, India, Europe, Germany, France and UK
Key Companies Profiled Infermedica , Ada Health, K Health, Babylon Health, GYANT, Rapid Health, SymptomLoop , Sully.ai, Predictmedix , aiTriage , Aidoc , Mediktor , Buoy Health, Sensely , HealthTap , TriageLogic , eConsult Health and others

Key Segments

By Type:

  • Pre hospital Triage
  • Hospital based Triage
  • Disaster/Mass Casualty Triage
  • Tele /Remote Triage/Virtual Triage
  • Others

By Component:

  • Software
  • Hardware
  • Services
  • Wearables / IoT Integration
  • Others

By Deployment:

  • On premises
  • Cloud based
  • Web based
  • Mobile/App based

By End User:

  • Hospitals/Emergency Departments
  • Ambulatory Surgical Centers
  • Clinics
  • Telemedicine Providers/Virtual Clinics
  • Others

By Region:

  • North America
  • Latin America
  • Western Europe
  • Eastern Europe
  • East Asia
  • South Asia
  • MEA

Table of Content

  1. Executive Summary
    • Global Market Outlook
    • Demand-side Trends
    • Supply-side Trends
    • Technology Roadmap Analysis
    • Analysis and Recommendations
  2. Market Overview
    • Market Coverage / Taxonomy
    • Market Definition / Scope / Limitations
  3. Market Background
    • Market Dynamics
      • Drivers
      • Restraints
      • Opportunity
      • Trends
    • Scenario Forecast
      • Demand in Optimistic Scenario
      • Demand in Likely Scenario
      • Demand in Conservative Scenario
    • Opportunity Map Analysis
    • Product Life Cycle Analysis
    • Technological Advancement
    • Investment Feasibility Matrix
    • PESTLE and Porter’s Analysis
    • Regulatory Landscape
  4. 3.9.1. By Key Regions
  5. 3.9.2. By Key Countries
    • Regional Parent Market Outlook
    • Recent Product Launches/Approvals
  6. Global Global Market Analysis 2020 to 2024 and Forecast, 2025 to 2035
    • Historical Market Size Value (USD Million) Analysis, 2020 to 2024
    • Current and Future Market Size Value (USD Million) Projections, 2025 to 2035
      • Y-o-Y Growth Trend Analysis
      • Absolute $ Opportunity Analysis
  7. Global Global Market Analysis 2020 to 2024 and Forecast 2025 to 2035, By Type
    • Introduction / Key Findings
    • Historical Market Size Value (USD Million) Analysis By Type, 2020 to 2024
    • Current and Future Market Size Value (USD Million) Analysis and Forecast By Type, 2025 to 2035
      • Pre hospital Triage
      • Hospital based Triage
      • Disaster/Mass Casualty Triage
      • Tele /Remote Triage/Virtual Triage
      • Others
    • Y-o-Y Growth Trend Analysis By Type, 2020 to 2024
    • Absolute $ Opportunity Analysis By Type, 2025 to 2035
  8. Global Global Market Analysis 2020 to 2024 and Forecast 2025 to 2035, By Component
    • Introduction / Key Findings
    • Historical Market Size Value (USD Million) Analysis By Component, 2020 to 2024
    • Current and Future Market Size Value (USD Million) Analysis and Forecast By Component, 2025 to 2035
      • Software
      • Hardware
      • Services
      • Wearables / IoT Integration
      • Others
    • Y-o-Y Growth Trend Analysis By Component, 2020 to 2024
    • Absolute $ Opportunity Analysis By Component, 2025 to 2035
  9. Global Global Market Analysis 2020 to 2024 and Forecast 2025 to 2035, By Deployment
    • Introduction / Key Findings
    • Historical Market Size Value (USD Million) Analysis By Deployment, 2020 to 2024
    • Current and Future Market Size Value (USD Million) Analysis and Forecast By Deployment, 2025 to 2035
      • On premises
      • Cloud based
      • Web based
      • Mobile/App based
    • Y-o-Y Growth Trend Analysis By Deployment, 2020 to 2024
    • Absolute $ Opportunity Analysis By Deployment, 2025 to 2035
  10. Global Global Market Analysis 2020 to 2024 and Forecast 2025 to 2035, By End User
    • Introduction / Key Findings
    • Historical Market Size Value (USD Million) Analysis By End User, 2020 to 2024
    • Current and Future Market Size Value (USD Million) Analysis and Forecast By End User, 2025 to 2035
      • Hospitals/Emergency Departments
      • Ambulatory Surgical Centers
      • Clinics
      • Telemedicine Providers/Virtual Clinics
      • Others
    • Y-o-Y Growth Trend Analysis By End User, 2020 to 2024
    • Absolute $ Opportunity Analysis By End User, 2025 to 2035
  11. Global Global Market Analysis 2020 to 2024 and Forecast 2025 to 2035, By Region
    • Introduction
    • Historical Market Size Value (USD Million) Analysis By Region, 2020 to 2024
    • Current Market Size Value (USD Million) Analysis and Forecast By Region, 2025 to 2035
      • North America
      • Latin America
      • Western Europe
      • Eastern Europe
      • East Asia
      • South Asia
      • MEA
    • Market Attractiveness Analysis By Region
  12. North America Global Market Analysis 2020 to 2024 and Forecast 2025 to 2035, By Country
    • Historical Market Size Value (USD Million) Trend Analysis By Market Taxonomy, 2020 to 2024
    • Market Size Value (USD Million) Forecast By Market Taxonomy, 2025 to 2035
      • By Country
        • USA
        • Canada
        • Mexico
      • By Type
      • By Component
      • By Deployment
      • By End User
    • Market Attractiveness Analysis
      • By Country
      • By Type
      • By Component
      • By Deployment
      • By End User
    • Key Takeaways
  13. Latin America Global Market Analysis 2020 to 2024 and Forecast 2025 to 2035, By Country
    • Historical Market Size Value (USD Million) Trend Analysis By Market Taxonomy, 2020 to 2024
    • Market Size Value (USD Million) Forecast By Market Taxonomy, 2025 to 2035
      • By Country
        • Brazil
        • Argentina
        • Rest of Latin America
      • By Type
      • By Component
      • By Deployment
      • By End User
    • Market Attractiveness Analysis
      • By Country
      • By Type
      • By Component
      • By Deployment
      • By End User
    • Key Takeaways
  14. Western Europe Global Market Analysis 2020 to 2024 and Forecast 2025 to 2035, By Country
    • Historical Market Size Value (USD Million) Trend Analysis By Market Taxonomy, 2020 to 2024
    • Market Size Value (USD Million) Forecast By Market Taxonomy, 2025 to 2035
      • By Country
        • Germany
        • Italy
        • France
        • UK
        • Spain
        • BENELUX
        • Nordic Countries
        • Rest of Western Europe
      • By Type
      • By Component
      • By Deployment
      • By End User
    • Market Attractiveness Analysis
      • By Country
      • By Type
      • By Component
      • By Deployment
      • By End User
    • Key Takeaways
  15. Eastern Europe Global Market Analysis 2020 to 2024 and Forecast 2025 to 2035, By Country
    • Historical Market Size Value (USD Million) Trend Analysis By Market Taxonomy, 2020 to 2024
    • Market Size Value (USD Million) Forecast By Market Taxonomy, 2025 to 2035
      • By Country
        • Russia
        • Hungry
        • Poland
        • Rest of Eastern Europe
      • By Type
      • By Component
      • By Deployment
      • By End User
    • Market Attractiveness Analysis
      • By Country
      • By Type
      • By Component
      • By Deployment
      • By End User
    • Key Takeaways
  16. East Asia Global Market Analysis 2020 to 2024 and Forecast 2025 to 2035, By Country
    • Historical Market Size Value (USD Million) Trend Analysis By Market Taxonomy, 2020 to 2024
    • Market Size Value (USD Million) Forecast By Market Taxonomy, 2025 to 2035
      • By Country
        • China
        • Japan
        • South Korea
      • By Type
      • By Component
      • By Deployment
      • By End User
    • Market Attractiveness Analysis
      • By Country
      • By Type
      • By Component
      • By Deployment
      • By End User
    • Key Takeaways
  17. South Asia Global Market Analysis 2020 to 2024 and Forecast 2025 to 2035, By Country
    • Historical Market Size Value (USD Million) Trend Analysis By Market Taxonomy, 2020 to 2024
    • Market Size Value (USD Million) Forecast By Market Taxonomy, 2025 to 2035
      • By Country
        • India
        • ASIAN Countries
        • Australia & New Zealand
        • Rest of South Asia
      • By Type
      • By Component
      • By Deployment
      • By End User
    • Market Attractiveness Analysis
      • By Country
      • By Type
      • By Component
      • By Deployment
      • By End User
    • Key Takeaways
  18. MEA Global Market Analysis 2020 to 2024 and Forecast 2025 to 2035, By Country
    • Historical Market Size Value (USD Million) Trend Analysis By Market Taxonomy, 2020 to 2024
    • Market Size Value (USD Million) Forecast By Market Taxonomy, 2025 to 2035
      • By Country
        • Saudi Arabia
        • Türkiye
        • South Africa
        • Other African Union
        • Rest of MEA
      • By Type
      • By Component
      • By Deployment
      • By End User
    • Market Attractiveness Analysis
      • By Country
      • By Type
      • By Component
      • By Deployment
      • By End User
    • Key Takeaways
  19. Key Countries Global Market Analysis
    • USA
      • Pricing Analysis
      • Market Share Analysis, 2024
        • By Type
        • By Component
        • By Deployment
        • By End User
    • Brazil
      • Pricing Analysis
      • Market Share Analysis, 2024
        • By Type
        • By Component
        • By Deployment
        • By End User
    • China
      • Pricing Analysis
      • Market Share Analysis, 2024
        • By Type
        • By Component
        • By Deployment
        • By End User
    • India
      • Pricing Analysis
      • Market Share Analysis, 2024
        • By Type
        • By Component
        • By Deployment
        • By End User
    • Europe
      • Pricing Analysis
      • Market Share Analysis, 2024
        • By Type
        • By Component
        • By Deployment
        • By End User
    • Germany
      • Pricing Analysis
      • Market Share Analysis, 2024
        • By Type
        • By Component
        • By Deployment
        • By End User
    • France
      • Pricing Analysis
      • Market Share Analysis, 2024
        • By Type
        • By Component
        • By Deployment
        • By End User
    • UK
      • Pricing Analysis
      • Market Share Analysis, 2024
        • By Type
        • By Component
        • By Deployment
        • By End User
  20. Market Structure Analysis
    • Competition Dashboard
    • Competition Benchmarking
    • Market Share Analysis of Top Players
      • By Regional
      • By Type
      • By Component
      • By Deployment
      • By End User
  21. Competition Analysis
    • Competition Deep Dive
      • Infermedica
        • Overview
        • Product Portfolio
        • Profitability by Market Segments
        • Sales Footprint
        • Strategy Overview
          • Marketing Strategy
          • Product Strategy
          • Channel Strategy
      • Ada Health
        • Overview
        • Product Portfolio
        • Profitability by Market Segments
        • Sales Footprint
        • Strategy Overview
          • Marketing Strategy
          • Product Strategy
          • Channel Strategy
      • K Health
        • Overview
        • Product Portfolio
        • Profitability by Market Segments
        • Sales Footprint
        • Strategy Overview
          • Marketing Strategy
          • Product Strategy
          • Channel Strategy
      • Babylon Health
        • Overview
        • Product Portfolio
        • Profitability by Market Segments
        • Sales Footprint
        • Strategy Overview
          • Marketing Strategy
          • Product Strategy
          • Channel Strategy
      • GYANT
        • Overview
        • Product Portfolio
        • Profitability by Market Segments
        • Sales Footprint
        • Strategy Overview
          • Marketing Strategy
          • Product Strategy
          • Channel Strategy
      • Rapid Health
        • Overview
        • Product Portfolio
        • Profitability by Market Segments
        • Sales Footprint
        • Strategy Overview
          • Marketing Strategy
          • Product Strategy
          • Channel Strategy
      • SymptomLoop
        • Overview
        • Product Portfolio
        • Profitability by Market Segments
        • Sales Footprint
        • Strategy Overview
          • Marketing Strategy
          • Product Strategy
          • Channel Strategy
      • Sully.ai
        • Overview
        • Product Portfolio
        • Profitability by Market Segments
        • Sales Footprint
        • Strategy Overview
          • Marketing Strategy
          • Product Strategy
          • Channel Strategy
      • Predictmedix
        • Overview
        • Product Portfolio
        • Profitability by Market Segments
        • Sales Footprint
        • Strategy Overview
          • Marketing Strategy
          • Product Strategy
          • Channel Strategy
      • aiTriage
        • Overview
        • Product Portfolio
        • Profitability by Market Segments
        • Sales Footprint
        • Strategy Overview
          • Marketing Strategy
          • Product Strategy
          • Channel Strategy
      • Aidoc
        • Overview
        • Product Portfolio
        • Profitability by Market Segments
        • Sales Footprint
        • Strategy Overview
          • Marketing Strategy
          • Product Strategy
          • Channel Strategy
      • Mediktor
        • Overview
        • Product Portfolio
        • Profitability by Market Segments
        • Sales Footprint
        • Strategy Overview
          • Marketing Strategy
          • Product Strategy
          • Channel Strategy
      • Buoy Health
        • Overview
        • Product Portfolio
        • Profitability by Market Segments
        • Sales Footprint
        • Strategy Overview
          • Marketing Strategy
          • Product Strategy
          • Channel Strategy
      • Sensely
        • Overview
        • Product Portfolio
        • Profitability by Market Segments
        • Sales Footprint
        • Strategy Overview
          • Marketing Strategy
          • Product Strategy
          • Channel Strategy
      • HealthTap
        • Overview
        • Product Portfolio
        • Profitability by Market Segments
        • Sales Footprint
        • Strategy Overview
          • Marketing Strategy
          • Product Strategy
          • Channel Strategy
      • TriageLogic
        • Overview
        • Product Portfolio
        • Profitability by Market Segments
        • Sales Footprint
        • Strategy Overview
          • Marketing Strategy
          • Product Strategy
          • Channel Strategy
      • eConsult Health
        • Overview
        • Product Portfolio
        • Profitability by Market Segments
        • Sales Footprint
        • Strategy Overview
          • Marketing Strategy
          • Product Strategy
          • Channel Strategy
  22. Assumptions & Acronyms Used
  23. Research Methodology

List of Tables

  • Table 1: Global Global Market Value (USD Million) Forecast by Region, 2020-2035
  • Table 2: Global Global Market Value (USD Million) Forecast by Type, 2020-2035
  • Table 3: Global Global Market Value (USD Million) Forecast by Component, 2020-2035
  • Table 4: Global Global Market Value (USD Million) Forecast by Deployment, 2020-2035
  • Table 5: Global Global Market Value (USD Million) Forecast by End User, 2020-2035
  • Table 6: North America Global Market Value (USD Million) Forecast by Country, 2020-2035
  • Table 7: North America Global Market Value (USD Million) Forecast by Type, 2020-2035
  • Table 8: North America Global Market Value (USD Million) Forecast by Component, 2020-2035
  • Table 9: North America Global Market Value (USD Million) Forecast by Deployment, 2020-2035
  • Table 10: North America Global Market Value (USD Million) Forecast by End User, 2020-2035
  • Table 11: Latin America Global Market Value (USD Million) Forecast by Country, 2020-2035
  • Table 12: Latin America Global Market Value (USD Million) Forecast by Type, 2020-2035
  • Table 13: Latin America Global Market Value (USD Million) Forecast by Component, 2020-2035
  • Table 14: Latin America Global Market Value (USD Million) Forecast by Deployment, 2020-2035
  • Table 15: Latin America Global Market Value (USD Million) Forecast by End User, 2020-2035
  • Table 16: Western Europe Global Market Value (USD Million) Forecast by Country, 2020-2035
  • Table 17: Western Europe Global Market Value (USD Million) Forecast by Type, 2020-2035
  • Table 18: Western Europe Global Market Value (USD Million) Forecast by Component, 2020-2035
  • Table 19: Western Europe Global Market Value (USD Million) Forecast by Deployment, 2020-2035
  • Table 20: Western Europe Global Market Value (USD Million) Forecast by End User, 2020-2035
  • Table 21: Eastern Europe Global Market Value (USD Million) Forecast by Country, 2020-2035
  • Table 22: Eastern Europe Global Market Value (USD Million) Forecast by Type, 2020-2035
  • Table 23: Eastern Europe Global Market Value (USD Million) Forecast by Component, 2020-2035
  • Table 24: Eastern Europe Global Market Value (USD Million) Forecast by Deployment, 2020-2035
  • Table 25: Eastern Europe Global Market Value (USD Million) Forecast by End User, 2020-2035
  • Table 26: East Asia Global Market Value (USD Million) Forecast by Country, 2020-2035
  • Table 27: East Asia Global Market Value (USD Million) Forecast by Type, 2020-2035
  • Table 28: East Asia Global Market Value (USD Million) Forecast by Component, 2020-2035
  • Table 29: East Asia Global Market Value (USD Million) Forecast by Deployment, 2020-2035
  • Table 30: East Asia Global Market Value (USD Million) Forecast by End User, 2020-2035
  • Table 31: South Asia Global Market Value (USD Million) Forecast by Country, 2020-2035
  • Table 32: South Asia Global Market Value (USD Million) Forecast by Type, 2020-2035
  • Table 33: South Asia Global Market Value (USD Million) Forecast by Component, 2020-2035
  • Table 34: South Asia Global Market Value (USD Million) Forecast by Deployment, 2020-2035
  • Table 35: South Asia Global Market Value (USD Million) Forecast by End User, 2020-2035
  • Table 36: MEA Global Market Value (USD Million) Forecast by Country, 2020-2035
  • Table 37: MEA Global Market Value (USD Million) Forecast by Type, 2020-2035
  • Table 38: MEA Global Market Value (USD Million) Forecast by Component, 2020-2035
  • Table 39: MEA Global Market Value (USD Million) Forecast by Deployment, 2020-2035
  • Table 40: MEA Global Market Value (USD Million) Forecast by End User, 2020-2035

List of Figures

  • Figure 1: Global Global Market Value (USD Million) by Type, 2025-2035
  • Figure 2: Global Global Market Value (USD Million) by Component, 2025-2035
  • Figure 3: Global Global Market Value (USD Million) by Deployment, 2025-2035
  • Figure 4: Global Global Market Value (USD Million) by End User, 2025-2035
  • Figure 5: Global Global Market Value (USD Million) by Region, 2025-2035
  • Figure 6: Global Global Market Value (USD Million) Analysis by Region, 2020-2035
  • Figure 7: Global Global Market Value Share (%) and BPS Analysis by Region, 2025-2035
  • Figure 8: Global Global Market Y-o-Y Growth (%) Projections by Region, 2025-2035
  • Figure 9: Global Global Market Value (USD Million) Analysis by Type, 2020-2035
  • Figure 10: Global Global Market Value Share (%) and BPS Analysis by Type, 2025-2035
  • Figure 11: Global Global Market Y-o-Y Growth (%) Projections by Type, 2025-2035
  • Figure 12: Global Global Market Value (USD Million) Analysis by Component, 2020-2035
  • Figure 13: Global Global Market Value Share (%) and BPS Analysis by Component, 2025-2035
  • Figure 14: Global Global Market Y-o-Y Growth (%) Projections by Component, 2025-2035
  • Figure 15: Global Global Market Value (USD Million) Analysis by Deployment, 2020-2035
  • Figure 16: Global Global Market Value Share (%) and BPS Analysis by Deployment, 2025-2035
  • Figure 17: Global Global Market Y-o-Y Growth (%) Projections by Deployment, 2025-2035
  • Figure 18: Global Global Market Value (USD Million) Analysis by End User, 2020-2035
  • Figure 19: Global Global Market Value Share (%) and BPS Analysis by End User, 2025-2035
  • Figure 20: Global Global Market Y-o-Y Growth (%) Projections by End User, 2025-2035
  • Figure 21: Global Global Market Attractiveness by Type, 2025-2035
  • Figure 22: Global Global Market Attractiveness by Component, 2025-2035
  • Figure 23: Global Global Market Attractiveness by Deployment, 2025-2035
  • Figure 24: Global Global Market Attractiveness by End User, 2025-2035
  • Figure 25: Global Global Market Attractiveness by Region, 2025-2035
  • Figure 26: North America Global Market Value (USD Million) by Type, 2025-2035
  • Figure 27: North America Global Market Value (USD Million) by Component, 2025-2035
  • Figure 28: North America Global Market Value (USD Million) by Deployment, 2025-2035
  • Figure 29: North America Global Market Value (USD Million) by End User, 2025-2035
  • Figure 30: North America Global Market Value (USD Million) by Country, 2025-2035
  • Figure 31: North America Global Market Value (USD Million) Analysis by Country, 2020-2035
  • Figure 32: North America Global Market Value Share (%) and BPS Analysis by Country, 2025-2035
  • Figure 33: North America Global Market Y-o-Y Growth (%) Projections by Country, 2025-2035
  • Figure 34: North America Global Market Value (USD Million) Analysis by Type, 2020-2035
  • Figure 35: North America Global Market Value Share (%) and BPS Analysis by Type, 2025-2035
  • Figure 36: North America Global Market Y-o-Y Growth (%) Projections by Type, 2025-2035
  • Figure 37: North America Global Market Value (USD Million) Analysis by Component, 2020-2035
  • Figure 38: North America Global Market Value Share (%) and BPS Analysis by Component, 2025-2035
  • Figure 39: North America Global Market Y-o-Y Growth (%) Projections by Component, 2025-2035
  • Figure 40: North America Global Market Value (USD Million) Analysis by Deployment, 2020-2035
  • Figure 41: North America Global Market Value Share (%) and BPS Analysis by Deployment, 2025-2035
  • Figure 42: North America Global Market Y-o-Y Growth (%) Projections by Deployment, 2025-2035
  • Figure 43: North America Global Market Value (USD Million) Analysis by End User, 2020-2035
  • Figure 44: North America Global Market Value Share (%) and BPS Analysis by End User, 2025-2035
  • Figure 45: North America Global Market Y-o-Y Growth (%) Projections by End User, 2025-2035
  • Figure 46: North America Global Market Attractiveness by Type, 2025-2035
  • Figure 47: North America Global Market Attractiveness by Component, 2025-2035
  • Figure 48: North America Global Market Attractiveness by Deployment, 2025-2035
  • Figure 49: North America Global Market Attractiveness by End User, 2025-2035
  • Figure 50: North America Global Market Attractiveness by Country, 2025-2035
  • Figure 51: Latin America Global Market Value (USD Million) by Type, 2025-2035
  • Figure 52: Latin America Global Market Value (USD Million) by Component, 2025-2035
  • Figure 53: Latin America Global Market Value (USD Million) by Deployment, 2025-2035
  • Figure 54: Latin America Global Market Value (USD Million) by End User, 2025-2035
  • Figure 55: Latin America Global Market Value (USD Million) by Country, 2025-2035
  • Figure 56: Latin America Global Market Value (USD Million) Analysis by Country, 2020-2035
  • Figure 57: Latin America Global Market Value Share (%) and BPS Analysis by Country, 2025-2035
  • Figure 58: Latin America Global Market Y-o-Y Growth (%) Projections by Country, 2025-2035
  • Figure 59: Latin America Global Market Value (USD Million) Analysis by Type, 2020-2035
  • Figure 60: Latin America Global Market Value Share (%) and BPS Analysis by Type, 2025-2035
  • Figure 61: Latin America Global Market Y-o-Y Growth (%) Projections by Type, 2025-2035
  • Figure 62: Latin America Global Market Value (USD Million) Analysis by Component, 2020-2035
  • Figure 63: Latin America Global Market Value Share (%) and BPS Analysis by Component, 2025-2035
  • Figure 64: Latin America Global Market Y-o-Y Growth (%) Projections by Component, 2025-2035
  • Figure 65: Latin America Global Market Value (USD Million) Analysis by Deployment, 2020-2035
  • Figure 66: Latin America Global Market Value Share (%) and BPS Analysis by Deployment, 2025-2035
  • Figure 67: Latin America Global Market Y-o-Y Growth (%) Projections by Deployment, 2025-2035
  • Figure 68: Latin America Global Market Value (USD Million) Analysis by End User, 2020-2035
  • Figure 69: Latin America Global Market Value Share (%) and BPS Analysis by End User, 2025-2035
  • Figure 70: Latin America Global Market Y-o-Y Growth (%) Projections by End User, 2025-2035
  • Figure 71: Latin America Global Market Attractiveness by Type, 2025-2035
  • Figure 72: Latin America Global Market Attractiveness by Component, 2025-2035
  • Figure 73: Latin America Global Market Attractiveness by Deployment, 2025-2035
  • Figure 74: Latin America Global Market Attractiveness by End User, 2025-2035
  • Figure 75: Latin America Global Market Attractiveness by Country, 2025-2035
  • Figure 76: Western Europe Global Market Value (USD Million) by Type, 2025-2035
  • Figure 77: Western Europe Global Market Value (USD Million) by Component, 2025-2035
  • Figure 78: Western Europe Global Market Value (USD Million) by Deployment, 2025-2035
  • Figure 79: Western Europe Global Market Value (USD Million) by End User, 2025-2035
  • Figure 80: Western Europe Global Market Value (USD Million) by Country, 2025-2035
  • Figure 81: Western Europe Global Market Value (USD Million) Analysis by Country, 2020-2035
  • Figure 82: Western Europe Global Market Value Share (%) and BPS Analysis by Country, 2025-2035
  • Figure 83: Western Europe Global Market Y-o-Y Growth (%) Projections by Country, 2025-2035
  • Figure 84: Western Europe Global Market Value (USD Million) Analysis by Type, 2020-2035
  • Figure 85: Western Europe Global Market Value Share (%) and BPS Analysis by Type, 2025-2035
  • Figure 86: Western Europe Global Market Y-o-Y Growth (%) Projections by Type, 2025-2035
  • Figure 87: Western Europe Global Market Value (USD Million) Analysis by Component, 2020-2035
  • Figure 88: Western Europe Global Market Value Share (%) and BPS Analysis by Component, 2025-2035
  • Figure 89: Western Europe Global Market Y-o-Y Growth (%) Projections by Component, 2025-2035
  • Figure 90: Western Europe Global Market Value (USD Million) Analysis by Deployment, 2020-2035
  • Figure 91: Western Europe Global Market Value Share (%) and BPS Analysis by Deployment, 2025-2035
  • Figure 92: Western Europe Global Market Y-o-Y Growth (%) Projections by Deployment, 2025-2035
  • Figure 93: Western Europe Global Market Value (USD Million) Analysis by End User, 2020-2035
  • Figure 94: Western Europe Global Market Value Share (%) and BPS Analysis by End User, 2025-2035
  • Figure 95: Western Europe Global Market Y-o-Y Growth (%) Projections by End User, 2025-2035
  • Figure 96: Western Europe Global Market Attractiveness by Type, 2025-2035
  • Figure 97: Western Europe Global Market Attractiveness by Component, 2025-2035
  • Figure 98: Western Europe Global Market Attractiveness by Deployment, 2025-2035
  • Figure 99: Western Europe Global Market Attractiveness by End User, 2025-2035
  • Figure 100: Western Europe Global Market Attractiveness by Country, 2025-2035
  • Figure 101: Eastern Europe Global Market Value (USD Million) by Type, 2025-2035
  • Figure 102: Eastern Europe Global Market Value (USD Million) by Component, 2025-2035
  • Figure 103: Eastern Europe Global Market Value (USD Million) by Deployment, 2025-2035
  • Figure 104: Eastern Europe Global Market Value (USD Million) by End User, 2025-2035
  • Figure 105: Eastern Europe Global Market Value (USD Million) by Country, 2025-2035
  • Figure 106: Eastern Europe Global Market Value (USD Million) Analysis by Country, 2020-2035
  • Figure 107: Eastern Europe Global Market Value Share (%) and BPS Analysis by Country, 2025-2035
  • Figure 108: Eastern Europe Global Market Y-o-Y Growth (%) Projections by Country, 2025-2035
  • Figure 109: Eastern Europe Global Market Value (USD Million) Analysis by Type, 2020-2035
  • Figure 110: Eastern Europe Global Market Value Share (%) and BPS Analysis by Type, 2025-2035
  • Figure 111: Eastern Europe Global Market Y-o-Y Growth (%) Projections by Type, 2025-2035
  • Figure 112: Eastern Europe Global Market Value (USD Million) Analysis by Component, 2020-2035
  • Figure 113: Eastern Europe Global Market Value Share (%) and BPS Analysis by Component, 2025-2035
  • Figure 114: Eastern Europe Global Market Y-o-Y Growth (%) Projections by Component, 2025-2035
  • Figure 115: Eastern Europe Global Market Value (USD Million) Analysis by Deployment, 2020-2035
  • Figure 116: Eastern Europe Global Market Value Share (%) and BPS Analysis by Deployment, 2025-2035
  • Figure 117: Eastern Europe Global Market Y-o-Y Growth (%) Projections by Deployment, 2025-2035
  • Figure 118: Eastern Europe Global Market Value (USD Million) Analysis by End User, 2020-2035
  • Figure 119: Eastern Europe Global Market Value Share (%) and BPS Analysis by End User, 2025-2035
  • Figure 120: Eastern Europe Global Market Y-o-Y Growth (%) Projections by End User, 2025-2035
  • Figure 121: Eastern Europe Global Market Attractiveness by Type, 2025-2035
  • Figure 122: Eastern Europe Global Market Attractiveness by Component, 2025-2035
  • Figure 123: Eastern Europe Global Market Attractiveness by Deployment, 2025-2035
  • Figure 124: Eastern Europe Global Market Attractiveness by End User, 2025-2035
  • Figure 125: Eastern Europe Global Market Attractiveness by Country, 2025-2035
  • Figure 126: East Asia Global Market Value (USD Million) by Type, 2025-2035
  • Figure 127: East Asia Global Market Value (USD Million) by Component, 2025-2035
  • Figure 128: East Asia Global Market Value (USD Million) by Deployment, 2025-2035
  • Figure 129: East Asia Global Market Value (USD Million) by End User, 2025-2035
  • Figure 130: East Asia Global Market Value (USD Million) by Country, 2025-2035
  • Figure 131: East Asia Global Market Value (USD Million) Analysis by Country, 2020-2035
  • Figure 132: East Asia Global Market Value Share (%) and BPS Analysis by Country, 2025-2035
  • Figure 133: East Asia Global Market Y-o-Y Growth (%) Projections by Country, 2025-2035
  • Figure 134: East Asia Global Market Value (USD Million) Analysis by Type, 2020-2035
  • Figure 135: East Asia Global Market Value Share (%) and BPS Analysis by Type, 2025-2035
  • Figure 136: East Asia Global Market Y-o-Y Growth (%) Projections by Type, 2025-2035
  • Figure 137: East Asia Global Market Value (USD Million) Analysis by Component, 2020-2035
  • Figure 138: East Asia Global Market Value Share (%) and BPS Analysis by Component, 2025-2035
  • Figure 139: East Asia Global Market Y-o-Y Growth (%) Projections by Component, 2025-2035
  • Figure 140: East Asia Global Market Value (USD Million) Analysis by Deployment, 2020-2035
  • Figure 141: East Asia Global Market Value Share (%) and BPS Analysis by Deployment, 2025-2035
  • Figure 142: East Asia Global Market Y-o-Y Growth (%) Projections by Deployment, 2025-2035
  • Figure 143: East Asia Global Market Value (USD Million) Analysis by End User, 2020-2035
  • Figure 144: East Asia Global Market Value Share (%) and BPS Analysis by End User, 2025-2035
  • Figure 145: East Asia Global Market Y-o-Y Growth (%) Projections by End User, 2025-2035
  • Figure 146: East Asia Global Market Attractiveness by Type, 2025-2035
  • Figure 147: East Asia Global Market Attractiveness by Component, 2025-2035
  • Figure 148: East Asia Global Market Attractiveness by Deployment, 2025-2035
  • Figure 149: East Asia Global Market Attractiveness by End User, 2025-2035
  • Figure 150: East Asia Global Market Attractiveness by Country, 2025-2035
  • Figure 151: South Asia Global Market Value (USD Million) by Type, 2025-2035
  • Figure 152: South Asia Global Market Value (USD Million) by Component, 2025-2035
  • Figure 153: South Asia Global Market Value (USD Million) by Deployment, 2025-2035
  • Figure 154: South Asia Global Market Value (USD Million) by End User, 2025-2035
  • Figure 155: South Asia Global Market Value (USD Million) by Country, 2025-2035
  • Figure 156: South Asia Global Market Value (USD Million) Analysis by Country, 2020-2035
  • Figure 157: South Asia Global Market Value Share (%) and BPS Analysis by Country, 2025-2035
  • Figure 158: South Asia Global Market Y-o-Y Growth (%) Projections by Country, 2025-2035
  • Figure 159: South Asia Global Market Value (USD Million) Analysis by Type, 2020-2035
  • Figure 160: South Asia Global Market Value Share (%) and BPS Analysis by Type, 2025-2035
  • Figure 161: South Asia Global Market Y-o-Y Growth (%) Projections by Type, 2025-2035
  • Figure 162: South Asia Global Market Value (USD Million) Analysis by Component, 2020-2035
  • Figure 163: South Asia Global Market Value Share (%) and BPS Analysis by Component, 2025-2035
  • Figure 164: South Asia Global Market Y-o-Y Growth (%) Projections by Component, 2025-2035
  • Figure 165: South Asia Global Market Value (USD Million) Analysis by Deployment, 2020-2035
  • Figure 166: South Asia Global Market Value Share (%) and BPS Analysis by Deployment, 2025-2035
  • Figure 167: South Asia Global Market Y-o-Y Growth (%) Projections by Deployment, 2025-2035
  • Figure 168: South Asia Global Market Value (USD Million) Analysis by End User, 2020-2035
  • Figure 169: South Asia Global Market Value Share (%) and BPS Analysis by End User, 2025-2035
  • Figure 170: South Asia Global Market Y-o-Y Growth (%) Projections by End User, 2025-2035
  • Figure 171: South Asia Global Market Attractiveness by Type, 2025-2035
  • Figure 172: South Asia Global Market Attractiveness by Component, 2025-2035
  • Figure 173: South Asia Global Market Attractiveness by Deployment, 2025-2035
  • Figure 174: South Asia Global Market Attractiveness by End User, 2025-2035
  • Figure 175: South Asia Global Market Attractiveness by Country, 2025-2035
  • Figure 176: MEA Global Market Value (USD Million) by Type, 2025-2035
  • Figure 177: MEA Global Market Value (USD Million) by Component, 2025-2035
  • Figure 178: MEA Global Market Value (USD Million) by Deployment, 2025-2035
  • Figure 179: MEA Global Market Value (USD Million) by End User, 2025-2035
  • Figure 180: MEA Global Market Value (USD Million) by Country, 2025-2035
  • Figure 181: MEA Global Market Value (USD Million) Analysis by Country, 2020-2035
  • Figure 182: MEA Global Market Value Share (%) and BPS Analysis by Country, 2025-2035
  • Figure 183: MEA Global Market Y-o-Y Growth (%) Projections by Country, 2025-2035
  • Figure 184: MEA Global Market Value (USD Million) Analysis by Type, 2020-2035
  • Figure 185: MEA Global Market Value Share (%) and BPS Analysis by Type, 2025-2035
  • Figure 186: MEA Global Market Y-o-Y Growth (%) Projections by Type, 2025-2035
  • Figure 187: MEA Global Market Value (USD Million) Analysis by Component, 2020-2035
  • Figure 188: MEA Global Market Value Share (%) and BPS Analysis by Component, 2025-2035
  • Figure 189: MEA Global Market Y-o-Y Growth (%) Projections by Component, 2025-2035
  • Figure 190: MEA Global Market Value (USD Million) Analysis by Deployment, 2020-2035
  • Figure 191: MEA Global Market Value Share (%) and BPS Analysis by Deployment, 2025-2035
  • Figure 192: MEA Global Market Y-o-Y Growth (%) Projections by Deployment, 2025-2035
  • Figure 193: MEA Global Market Value (USD Million) Analysis by End User, 2020-2035
  • Figure 194: MEA Global Market Value Share (%) and BPS Analysis by End User, 2025-2035
  • Figure 195: MEA Global Market Y-o-Y Growth (%) Projections by End User, 2025-2035
  • Figure 196: MEA Global Market Attractiveness by Type, 2025-2035
  • Figure 197: MEA Global Market Attractiveness by Component, 2025-2035
  • Figure 198: MEA Global Market Attractiveness by Deployment, 2025-2035
  • Figure 199: MEA Global Market Attractiveness by End User, 2025-2035
  • Figure 200: MEA Global Market Attractiveness by Country, 2025-2035

Frequently Asked Questions

How big is the Global AI based Triage Tools Market in 2025?

The global AI based triage tools market is estimated to be valued at USD 104.97 million in 2025.

What will be the size of the Global AI based Triage Tools Market in 2035?

The market size for the global AI based triage tools market is projected to reach approximately USD 290.10 million by 2035.

How much will the Global AI based Triage Tools Market grow between 2025 and 2035?

The global AI based triage tools market is expected to grow at a CAGR of 10.7% between 2025 and 2035.

What are the key types in the Global AI based Triage Tools Market?

The key product formats in the global AI based triage tools market include Pre hospital triage, hospital based triage, disaster/mass casualty triage, tele /remote triage/virtual triage and others.

Which Component type segment will contribute a significant share in the Global AI based Triage Tools Market in 2025?

In terms of Component, Software is projected to command the highest share at 43.9% in the global AI based triage tools market in 2025.

Explore Similar Insights

Future Market Insights

AI based Triage Tools Market

Chat With

MaRIA

Hi There, I am MaRIA, Your Market Research Intelligence Assistant. How may I help you?