

- Market Size (2026)
- USD 125.9 Mn
- Forecast (2036)
- USD 435.0 Mn
- CAGR (2026 to 2036)
- 13.2%
How big is AI Infrastructure Validation Lab Services Market in 2026?
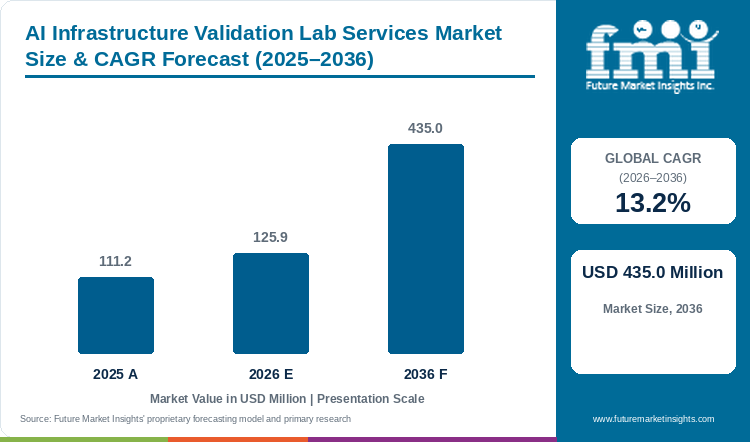
The market was valued at USD 111.2 Million in 2025 and is expected to reach USD 125.9 Million in 2026, with growth at a 13.2% CAGR from 2026 to 2036 taking its value to USD 435.0 Million by 2036.
A laboratory assignment is most useful when it resolves a defined question about the configuration a buyer intends to deploy. Hardware revisions, firmware and control settings need to be recorded so the result can support procurement without implying that a different arrangement will behave identically. Controlled testing provides a setting for investigating combined-system faults before they cause expensive site rework, although some electrical and thermal conditions remain dependent on the eventual facility. Providers need to state those limits and carry the outstanding checks into field acceptance. French and German projects may require measurable facility-performance information, while UAE buyers need clarity about the ambient and cooling conditions represented. Revenue follows the contracted validation work and its decision purpose, with the value of equipment under examination remaining outside the service estimate. [5]
Key Market Trends & Insights
- Commissioning & acceptance holds 27.0% of service scope in 2026, bringing assembled-system interactions into a test beyond separate component approvals.
- New AI hall build holds 36.0% of project stage in 2026, allowing interface questions to be investigated while design and equipment choices can still change.
- 251–500 kW holds 32.0% of AI rack density in 2026, requiring electrical and cooling behavior to be considered together under representative test conditions.
- Hyperscale AI data centers account for 46.0% of data center type in 2026, with reusable designs still needing a traceable tested configuration and explicit operating limits.
Regional Highlights
- UAE has the highest profiled CAGR at 14.6% during 2026–2036.
- The next two profiled growth rates are South Korea at 14.3% and France at 14.0% over the same period.
Market Size & Forecast
| Metric | Value |
|---|---|
| 2025 market value | USD 111.2 Million |
| 2026 market estimate | USD 125.9 Million |
| 2036 market forecast | USD 435.0 Million |
| Forecast CAGR, 2026–2036 | 13.2% |
The market covers paid laboratory and related validation services for AI infrastructure, including engineering assessment, performance testing and qualifying site-acceptance work. Hardware sales and research activities without a contracted validation-service component are excluded.
Validation laboratories need realistic data-center power conditions when testing configurations that will later operate behind site-specific electrical constraints.
Infrastructure readiness and acceptance
| Documented operating context | Source |
|---|---|
| Jacobs released an AI data-center digital-twin solution in March 2026 covering compute, power and cooling interactions. | [1] |
| Siemens and partners described a reference architecture for NVIDIA AI data centers in June 2026. | [2] |
| Schneider Electric introduced prefabricated pod and rack solutions for high-density AI applications in June 2025. | [3] |
| Vertiv launched a liquid-cooling services portfolio in February 2025 covering deployment and ongoing system support. | [4] |
Analyst Perspective
A useful laboratory result answers a procurement or design question for a recorded configuration, with the operating conditions and limits made clear. Buyers can then identify which changes need further testing and which site-dependent checks remain for commissioning, rather than treating an earlier demonstration as approval for every later installation.
- Nikhil Kaitwade, Principal Analyst at Future Market Insights
How is the AI infrastructure validation lab services market segmented?
Service Scope covers Commissioning & acceptance, Design & engineering, Performance validation, Retrofit & migration and Managed support. Project Stage covers New AI hall build, Rack/pod deployment, Capacity expansion, Legacy conversion and Ongoing operations. AI Rack Density covers 251–500 kW, 100–250 kW, Below 100 kW and Above 500 kW. Data Center Type covers Hyperscale AI data centers, Colocation AI facilities, Enterprise private AI and HPC & research centers. Commercial Model covers Direct enterprise contract, System integrator / EPC-led, Subscription / license and Managed-service contract.
A result becomes more useful to data-center infrastructure management teams when the tested configuration and any unresolved exceptions are recorded consistently.
Why does Commissioning & acceptance lead service scope demand?
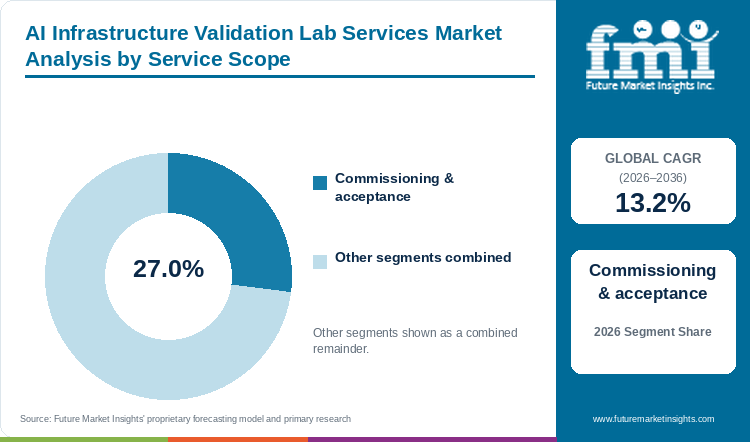
Commissioning & acceptance: 27.0% of service scope in 2026.
Laboratory acceptance examines whether an assembled configuration meets agreed requirements, allowing interactions between components to be assessed beyond their separate approvals. Versions, settings and instrumentation make the result reproducible and help the customer judge its relevance to the planned deployment. Clear failure criteria establish when revision is required, with site-dependent checks identified so that laboratory findings lead to a defined release decision and an appropriate later acceptance scope.
- The Commissioning & acceptance segment accounts for 27.0% of service scope in 2026.
- Recording the tested hardware and firmware makes it possible to identify which later changes require another validation cycle.
Why does New AI hall build lead project stage demand?
New AI hall build: 36.0% of project stage in 2026.
Early testing gives a new-hall buyer time to revise equipment interfaces before construction and procurement make changes more expensive. The configuration and operating conditions need to represent the intended installation, because an ideal demonstration arrangement offers limited protection when it cannot be reproduced at the site. Findings can then identify which behaviors still require field verification, giving laboratory work a distinct role in design selection and the subsequent acceptance plan.
- The New AI hall build segment accounts for 36.0% of project stage in 2026.
- A laboratory assignment is most useful before an unresolved interface is committed to a large equipment order or fixed site design.
What are the drivers, restraints, and opportunities in the AI infrastructure validation lab services market?
Independent validation supports infrastructure release decisions
A combined-system fault becomes harder to investigate after production GPUs depend on the installation, giving controlled testing a useful role before design release. Agreed stress conditions can examine transitions and recovery as well as steady loads, connecting the observations to a procurement or engineering decision. The service’s value lies in identifying a costly weakness while it can still be addressed with less disruption.
Test coverage and configuration control raise delivery cost
A laboratory cannot reproduce every condition at a future operating site. The buyer and provider need to agree which assumptions are represented and which remain outside the test. Configuration changes complicate this boundary because a revised component may invalidate part of an earlier result. Additional work can also be needed when suppliers disagree about the cause of a failure. Clear responsibility for diagnosis and retesting helps control cost. The final report should separate demonstrated behavior from conditions that depend on the customer's facility instead of leaving the user to infer a broader approval.
Reusable lab methods can shorten qualification cycles
Common test methods can reduce the effort needed to qualify familiar rack and cooling combinations. Open Compute Project work on coolant-distribution performance and cooling-system preparation offers a basis for more consistent terminology. A laboratory can build on that work while retaining control of the configuration actually tested. The useful extension is targeted retesting after a component changes. Customers should not have to restart an entire program when the affected interfaces can be identified precisely. Providers with field capability can also carry the laboratory findings into the site acceptance plan without confusing the different scopes.
Laboratory validation complements AI infrastructure commissioning but cannot replace site tests of interfaces that were absent from the controlled test environment.
Which country and market CAGRs are profiled for AI infrastructure validation lab services?
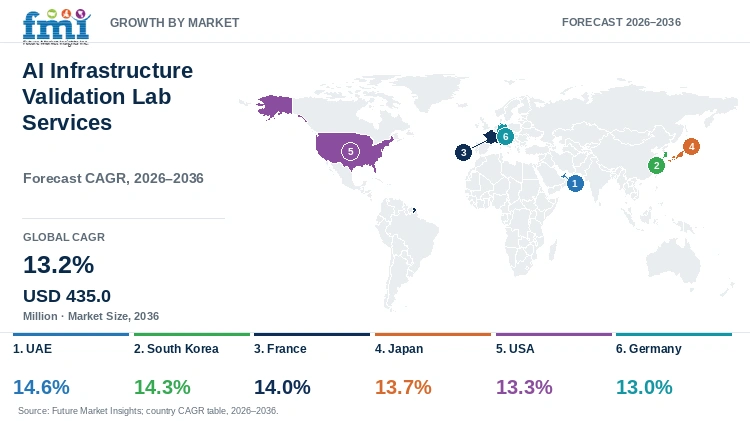
| Country | CAGR |
|---|---|
| UAE | 14.6% |
| South Korea | 14.3% |
| France | 14.0% |
| Japan | 13.7% |
| USA | 13.3% |
| Germany | 13.0% |
Country-wise Analysis
UAE
- Prolonged thermal loading and transitions to standby operation are useful questions for UAE validation work, provided the report states which temperatures and cooling arrangements were represented. A controlled hardware and firmware baseline lets customers compare the result with the proposed campus design. The UAE has the fastest profiled forecast, at a 14.6% CAGR from 2026 to 2036, with the limits of simulation remaining part of an actionable result.
South Korea
- Formal release evidence may be required within South Korea’s publicly coordinated compute procurement, making alignment with the integrator’s duties and buyer’s approval process part of laboratory delivery. Contracts need to distinguish diagnosis from certification and define when a revised configuration calls for renewed testing. South Korea’s 14.3% CAGR forecast for 2026 to 2036 accompanies this need for evidence that remains applicable as technology integration and site works evolve.
France
- French AI projects need technical findings that help buyers understand electricity and water performance once the thermal and electrical design is sufficiently defined. A report organized around demonstrated operating limits is more useful for comparison than readings without a decision context, with facility-dependent conditions carried into field acceptance. France is forecast to grow at a 14.0% CAGR from 2026 to 2036 within this service scope.
Japan
- Constrained access windows can make off-site investigation useful to Japanese buyers who need to resolve equipment and control questions before arranging tests in an operating facility. The laboratory must reproduce the intended combination and record its settings so later production differences can be investigated, while site-wide power and cooling checks remain assigned to commissioning. Japan’s forecast is a 13.7% CAGR from 2026 to 2036.
USA
- American assignments range from full design qualification to a narrower test after a platform modification, requiring different coverage and turnaround commitments. Phased campuses may remain unready for some time after laboratory work, so configuration records help prevent an old result from being applied to revised equipment. The USA is forecast to grow at a 13.3% CAGR from 2026 to 2036, with independent interpretation particularly relevant when findings inform a choice among suppliers.
Germany
- Efficiency and heat-use requirements can add facility-specific questions to German validation programs, while retrofits may depend on live systems that cannot be reproduced fully off site. A reproducible report needs to identify the arrangement tested and the remaining limits, allowing design decisions to proceed with later commissioning checks clearly assigned. Germany’s 13.0% CAGR forecast for 2026 to 2036 reflects service demand within that boundary.
Who are the notable companies in the AI infrastructure validation lab services market?
Vertiv; Siemens; Jacobs; Schneider Electric; Eaton
A validation provider needs an environment that represents the customer's proposed deployment. The breadth of equipment available matters less when the relevant combination cannot be assembled or controlled. Buyers should examine how the laboratory records revisions and investigates failures before comparing the size of its test inventory.
Competitive Benchmarking: AI Infrastructure Validation Lab Services Market
| Participant | Commercial focus | Buyer qualification priority |
|---|---|---|
| Vertiv | Power, cooling and infrastructure services | Integrated commissioning and service access |
| Siemens | Electrical and building-system integration | Protection logic and controls handover |
| Jacobs | Engineering and facility integration | Cross-system acceptance and owner requirements |
| Schneider Electric | Power, cooling and prefabricated infrastructure | Interface definition and system-level testing |
| Eaton | Power infrastructure and services | Protection coordination and recovery behavior |
Key Developments in the AI Infrastructure Validation Lab Services Market
- Jacobs released an AI data-center digital-twin solution in March 2026 covering compute, power and cooling interactions. [1]
- Siemens and partners described a reference architecture for NVIDIA AI data centers in June 2026. [2]
Key Players in the AI Infrastructure Validation Lab Services Market
- Vertiv
- Siemens
- Jacobs
- Schneider Electric
- Eaton
AI Infrastructure Validation Lab Services Market - Report Scope
| Coverage field | Report scope |
|---|---|
| Market breakdown | Service Scope; Project Stage; AI Rack Density; Data Center Type; Commercial Model; Region |
| Quantitative unit | USD Million |
| Market definition | The market covers paid laboratory and related validation services for AI infrastructure, including engineering assessment, performance testing and qualifying site-acceptance work. Hardware sales and research activities without a contracted validation-service component are excluded. |
| Regions covered | North America; Latin America; Western Europe; Eastern Europe; East Asia; South Asia and Pacific; Middle East and Africa |
| Countries / markets profiled | UAE; South Korea; France; Japan; USA; Germany |
| Key companies profiled | Vertiv; Siemens; Jacobs; Schneider Electric; Eaton |
| Base year / forecast period | 2026 / 2026–2036 |
| Estimate coverage | 2025 and 2026 market estimates; 2036 forecast; segment shares and country / market CAGRs. |
AI Infrastructure Validation Lab Services Market - Research Methodology
| Method | Application |
|---|---|
| Market definition | The analysis follows the stated product or service boundary and distinguishes direct category revenue from adjacent activities. |
| Secondary research | Official technical, regulatory, research and company publications provide the documented operating context and recent developments cited in this report. |
| Forecast and segmentation | Market estimates, segment shares and geographic forecasts are presented as analytical estimates within the stated commercial scope. |
| Competitive assessment | Participants are compared by their relevant products or services, commercial role and buyer qualification requirements. |
| Interpretation | The assessment considers purchasing conditions and the scope of the documented product, service or performance claim. |
AI Infrastructure Validation Lab Services Market by Segments
Service Scope
- Commissioning & acceptance
- Design & engineering
- Performance validation
- Retrofit & migration
- Managed support
Project Stage
- New AI hall build
- Rack/pod deployment
- Capacity expansion
- Legacy conversion
- Ongoing operations
AI Rack Density
- 251–500 kW
- 100–250 kW
- Below 100 kW
- Above 500 kW
Data Center Type
- Hyperscale AI data centers
- Colocation AI facilities
- Enterprise private AI
- HPC & research centers
Commercial Model
- Direct enterprise contract
- System integrator / EPC-led
- Subscription / license
- Managed-service contract
AI Infrastructure Validation Lab Services Market by Region
- North America
- United States
- Canada
- Latin America
- Brazil
- Mexico
- Argentina
- Chile
- Western Europe
- Germany
- France
- United Kingdom
- Italy
- Spain
- Benelux
- Nordics
- Eastern Europe
- Poland
- Czech Republic
- Romania
- Hungary
- East Asia
- China
- Japan
- South Korea
- South Asia and Pacific
- India
- ASEAN
- Australia and New Zealand
- Middle East and Africa
- GCC Countries
- South Africa
- Türkiye
- Israel
Research Sources and Bibliography
- [1] Jacobs. (2026, March 16). Jacobs releases digital twin solution for AI data centers.
- [2] Siemens. (2026, June 1). Siemens and Partners Develop Reference Architecture Purpose-Built for NVIDIA AI Data Centers.
- [3] Schneider Electric. (2025, June 11). Schneider Electric Launches New Data Center Solutions to Meet Challenges of High-Density AI and Accelerated Compute Applications.
- [4] Vertiv. (2025, February 11). Vertiv announces global launch of liquid cooling services portfolio.
- [5] Future Market Insights. (2026). AI Infrastructure Validation Lab Services Market: Global industry analysis and opportunity assessment, 2026–2036.
This Report Answers
- How large is the AI infrastructure validation lab services market in 2026?
- What value and CAGR are forecast through 2036?
- Which service scope segment leads in 2026?
- Which project stage segment has the largest share?
- Which profiled country or market has the fastest forecast growth?
- Which participants are covered in the competitive assessment?
Frequently Asked Questions
How large is the AI infrastructure validation lab services market in 2026?
The market was valued at USD 111.2 Million in 2025 and is expected to reach USD 125.9 Million in 2026.
What value and CAGR are forecast through 2036?
The market is projected to reach USD 435.0 Million by 2036, with a 13.2% CAGR during 2026–2036.
Which service scope segment leads in 2026?
The Commissioning & acceptance segment accounts for 27.0% of service scope in 2026.
Which project stage segment has the largest share?
The New AI hall build segment accounts for 36.0% of project stage in 2026.
Which profiled country or market has the fastest forecast growth?
UAE has the highest profiled CAGR at 14.6% during 2026–2036.
Which participants are covered in the competitive assessment?
The assessment covers Vertiv, Siemens, Jacobs, Schneider Electric and Eaton.
Preview the report firsthand - request a free sample
Get SampleGet the brochure for pricing and purchase details.
Get PDFTable of Content
- Key Takeaways
- Market Size and CAGR
- Top Growth Driver
- Fastest Growing Segment
- Leading Region
- Key Companies
- Emerging Opportunities
- Executive Summary
- Global Market Outlook
- Demand-side Trends
- Supply-side Trends
- Technology Roadmap Analysis
- Analysis and Recommendations
- Analyst Perspective (What is happening? Why now? What should investors know?)
- Key Questions Answered
- How large is the market?
- What is the CAGR?
- What are key trends?
- Which region dominates?
- Who are the leaders?
- Market Overview
- Market Coverage / Taxonomy
- Market Definition / Scope / Limitations
- Research Methodology
- Chapter Orientation
- Analytical Lens and Working Hypotheses
- Market Structure, Signals, and Trend Drivers
- Benchmarking and Cross-market Comparability
- Market Sizing, Forecasting, and Opportunity Mapping
- Research Design and Evidence Framework
- Desk Research Programme (Secondary Evidence)
- Expert Input and Fieldwork (Primary Evidence)
- Tooling, Models, and Reference Databases
- Data Engineering and Model Build
- Quality Assurance and Audit Trail
- Market Background
- Market Dynamics (Drivers, Restraints, Opportunity, Trends)
- Scenario Forecast (Optimistic, Likely, Conservative)
- Impact Analysis
- AI Impact
- Sustainability Impact
- Regulatory Impact
- Technology Impact
- Consumer / Buyer Analysis
- Purchase Drivers
- Adoption Barriers
- Buyer Journey
- Opportunity Map Analysis
- Product Life Cycle Analysis
- Supply Chain Analysis
- Investment Feasibility Matrix
- Value Chain Analysis
- PESTLE and Porter's Analysis
- Regulatory Landscape
- Regional Parent Market Outlook
- Production and Consumption Statistics
- Import and Export Statistics
- Global Market Analysis and Forecast, 2021 to 2036
- Historical Market Size Value (USD Million) Analysis, 2021 to 2025
- Current and Future Market Size Value (USD Million) Projections, 2026 to 2036
- Y-o-Y Growth Trend Analysis
- Absolute $ Opportunity Analysis
- Global Market Pricing Analysis, 2021 to 2036
- Global Market Analysis and Forecast, By Service Scope, 2021 to 2036
- Introduction / Key Findings
- Historical Market Size Value (USD Million) Analysis By Service Scope, 2021 to 2025
- Current and Future Market Size Value (USD Million) Analysis and Forecast By Service Scope, 2026 to 2036
- Commissioning & acceptance
- Design & engineering
- Performance validation
- Retrofit & migration
- Managed support
- Y-o-Y Growth Trend Analysis By Service Scope, 2021 to 2025
- Absolute $ Opportunity Analysis By Service Scope, 2026 to 2036
- Global Market Analysis and Forecast, By Project Stage, 2021 to 2036
- Introduction / Key Findings
- Historical Market Size Value (USD Million) Analysis By Project Stage, 2021 to 2025
- Current and Future Market Size Value (USD Million) Analysis and Forecast By Project Stage, 2026 to 2036
- New AI hall build
- Rack/pod deployment
- Capacity expansion
- Legacy conversion
- Ongoing operations
- Y-o-Y Growth Trend Analysis By Project Stage, 2021 to 2025
- Absolute $ Opportunity Analysis By Project Stage, 2026 to 2036
- Global Market Analysis and Forecast, By AI Rack Density, 2021 to 2036
- Introduction / Key Findings
- Historical Market Size Value (USD Million) Analysis By AI Rack Density, 2021 to 2025
- Current and Future Market Size Value (USD Million) Analysis and Forecast By AI Rack Density, 2026 to 2036
- 251–500 kW
- 100–250 kW
- Below 100 kW
- Above 500 kW
- Y-o-Y Growth Trend Analysis By AI Rack Density, 2021 to 2025
- Absolute $ Opportunity Analysis By AI Rack Density, 2026 to 2036
- Global Market Analysis and Forecast, By Data Center Type, 2021 to 2036
- Introduction / Key Findings
- Historical Market Size Value (USD Million) Analysis By Data Center Type, 2021 to 2025
- Current and Future Market Size Value (USD Million) Analysis and Forecast By Data Center Type, 2026 to 2036
- Hyperscale AI data centers
- Colocation AI facilities
- Enterprise private AI
- HPC & research centers
- Y-o-Y Growth Trend Analysis By Data Center Type, 2021 to 2025
- Absolute $ Opportunity Analysis By Data Center Type, 2026 to 2036
- Global Market Analysis and Forecast, By Commercial Model, 2021 to 2036
- Introduction / Key Findings
- Historical Market Size Value (USD Million) Analysis By Commercial Model, 2021 to 2025
- Current and Future Market Size Value (USD Million) Analysis and Forecast By Commercial Model, 2026 to 2036
- Direct enterprise contract
- System integrator / EPC-led
- Subscription / license
- Managed-service contract
- Y-o-Y Growth Trend Analysis By Commercial Model, 2021 to 2025
- Absolute $ Opportunity Analysis By Commercial Model, 2026 to 2036
- Global Market Analysis and Forecast, By Region, 2021 to 2036
- Introduction
- Historical Market Size Value (USD Million) Analysis By Region, 2021 to 2025
- Current Market Size Value (USD Million) Analysis and Forecast By Region, 2026 to 2036
- North America
- Latin America
- Western Europe
- Eastern Europe
- East Asia
- South Asia and Pacific
- Middle East and Africa
- Market Attractiveness Analysis By Region
- North America Market Analysis and Forecast, By Country, 2021 to 2036
- Historical Market Size Value (USD Million) Trend Analysis By Market Taxonomy, 2021 to 2025
- Market Size Value (USD Million) Forecast By Market Taxonomy, 2026 to 2036
- By Country
- United States
- Canada
- By Service Scope
- By Project Stage
- By AI Rack Density
- By Data Center Type
- By Commercial Model
- By Country
- Market Attractiveness Analysis
- By Country
- By Service Scope
- By Project Stage
- By AI Rack Density
- By Data Center Type
- By Commercial Model
- Key Takeaways
- Latin America Market Analysis and Forecast, By Country
- Historical Market Size Value (USD Million) Trend Analysis By Market Taxonomy, 2021 to 2025
- Market Size Value (USD Million) Forecast By Market Taxonomy, 2026 to 2036
- By Country
- Brazil
- Mexico
- Argentina
- Chile
- By Service Scope
- By Project Stage
- By AI Rack Density
- By Data Center Type
- By Commercial Model
- By Country
- Market Attractiveness Analysis
- By Country
- By Service Scope
- By Project Stage
- By AI Rack Density
- By Data Center Type
- By Commercial Model
- Key Takeaways
- Western Europe Market Analysis and Forecast, By Country
- Historical Market Size Value (USD Million) Trend Analysis By Market Taxonomy, 2021 to 2025
- Market Size Value (USD Million) Forecast By Market Taxonomy, 2026 to 2036
- By Country
- Germany
- France
- United Kingdom
- Italy
- Spain
- Benelux
- Nordics
- By Service Scope
- By Project Stage
- By AI Rack Density
- By Data Center Type
- By Commercial Model
- By Country
- Market Attractiveness Analysis
- By Country
- By Service Scope
- By Project Stage
- By AI Rack Density
- By Data Center Type
- By Commercial Model
- Key Takeaways
- Eastern Europe Market Analysis and Forecast, By Country
- Historical Market Size Value (USD Million) Trend Analysis By Market Taxonomy, 2021 to 2025
- Market Size Value (USD Million) Forecast By Market Taxonomy, 2026 to 2036
- By Country
- Poland
- Czech Republic
- Romania
- Hungary
- By Service Scope
- By Project Stage
- By AI Rack Density
- By Data Center Type
- By Commercial Model
- By Country
- Market Attractiveness Analysis
- By Country
- By Service Scope
- By Project Stage
- By AI Rack Density
- By Data Center Type
- By Commercial Model
- Key Takeaways
- East Asia Market Analysis and Forecast, By Country
- Historical Market Size Value (USD Million) Trend Analysis By Market Taxonomy, 2021 to 2025
- Market Size Value (USD Million) Forecast By Market Taxonomy, 2026 to 2036
- By Country
- China
- Japan
- South Korea
- By Service Scope
- By Project Stage
- By AI Rack Density
- By Data Center Type
- By Commercial Model
- By Country
- Market Attractiveness Analysis
- By Country
- By Service Scope
- By Project Stage
- By AI Rack Density
- By Data Center Type
- By Commercial Model
- Key Takeaways
- South Asia and Pacific Market Analysis and Forecast, By Country
- Historical Market Size Value (USD Million) Trend Analysis By Market Taxonomy, 2021 to 2025
- Market Size Value (USD Million) Forecast By Market Taxonomy, 2026 to 2036
- By Country
- India
- ASEAN
- Australia and New Zealand
- By Service Scope
- By Project Stage
- By AI Rack Density
- By Data Center Type
- By Commercial Model
- By Country
- Market Attractiveness Analysis
- By Country
- By Service Scope
- By Project Stage
- By AI Rack Density
- By Data Center Type
- By Commercial Model
- Key Takeaways
- Middle East and Africa Market Analysis and Forecast, By Country
- Historical Market Size Value (USD Million) Trend Analysis By Market Taxonomy, 2021 to 2025
- Market Size Value (USD Million) Forecast By Market Taxonomy, 2026 to 2036
- By Country
- GCC Countries
- South Africa
- Türkiye
- Israel
- By Service Scope
- By Project Stage
- By AI Rack Density
- By Data Center Type
- By Commercial Model
- By Country
- Market Attractiveness Analysis
- By Country
- By Service Scope
- By Project Stage
- By AI Rack Density
- By Data Center Type
- By Commercial Model
- Key Takeaways
- Key Countries Market Analysis
- United States
- Pricing Analysis
- Market Share Analysis, 2025
- By Service Scope
- By Project Stage
- By AI Rack Density
- By Data Center Type
- By Commercial Model
- Canada
- Pricing Analysis
- Market Share Analysis, 2025
- By Service Scope
- By Project Stage
- By AI Rack Density
- By Data Center Type
- By Commercial Model
- Mexico
- Pricing Analysis
- Market Share Analysis, 2025
- By Service Scope
- By Project Stage
- By AI Rack Density
- By Data Center Type
- By Commercial Model
- Brazil
- Pricing Analysis
- Market Share Analysis, 2025
- By Service Scope
- By Project Stage
- By AI Rack Density
- By Data Center Type
- By Commercial Model
- Chile
- Pricing Analysis
- Market Share Analysis, 2025
- By Service Scope
- By Project Stage
- By AI Rack Density
- By Data Center Type
- By Commercial Model
- Germany
- Pricing Analysis
- Market Share Analysis, 2025
- By Service Scope
- By Project Stage
- By AI Rack Density
- By Data Center Type
- By Commercial Model
- United Kingdom
- Pricing Analysis
- Market Share Analysis, 2025
- By Service Scope
- By Project Stage
- By AI Rack Density
- By Data Center Type
- By Commercial Model
- Italy
- Pricing Analysis
- Market Share Analysis, 2025
- By Service Scope
- By Project Stage
- By AI Rack Density
- By Data Center Type
- By Commercial Model
- Spain
- Pricing Analysis
- Market Share Analysis, 2025
- By Service Scope
- By Project Stage
- By AI Rack Density
- By Data Center Type
- By Commercial Model
- France
- Pricing Analysis
- Market Share Analysis, 2025
- By Service Scope
- By Project Stage
- By AI Rack Density
- By Data Center Type
- By Commercial Model
- India
- Pricing Analysis
- Market Share Analysis, 2025
- By Service Scope
- By Project Stage
- By AI Rack Density
- By Data Center Type
- By Commercial Model
- ASEAN
- Pricing Analysis
- Market Share Analysis, 2025
- By Service Scope
- By Project Stage
- By AI Rack Density
- By Data Center Type
- By Commercial Model
- Australia and New Zealand
- Pricing Analysis
- Market Share Analysis, 2025
- By Service Scope
- By Project Stage
- By AI Rack Density
- By Data Center Type
- By Commercial Model
- China
- Pricing Analysis
- Market Share Analysis, 2025
- By Service Scope
- By Project Stage
- By AI Rack Density
- By Data Center Type
- By Commercial Model
- Japan
- Pricing Analysis
- Market Share Analysis, 2025
- By Service Scope
- By Project Stage
- By AI Rack Density
- By Data Center Type
- By Commercial Model
- South Korea
- Pricing Analysis
- Market Share Analysis, 2025
- By Service Scope
- By Project Stage
- By AI Rack Density
- By Data Center Type
- By Commercial Model
- Poland
- Pricing Analysis
- Market Share Analysis, 2025
- By Service Scope
- By Project Stage
- By AI Rack Density
- By Data Center Type
- By Commercial Model
- Hungary
- Pricing Analysis
- Market Share Analysis, 2025
- By Service Scope
- By Project Stage
- By AI Rack Density
- By Data Center Type
- By Commercial Model
- Türkiye
- Pricing Analysis
- Market Share Analysis, 2025
- By Service Scope
- By Project Stage
- By AI Rack Density
- By Data Center Type
- By Commercial Model
- South Africa
- Pricing Analysis
- Market Share Analysis, 2025
- By Service Scope
- By Project Stage
- By AI Rack Density
- By Data Center Type
- By Commercial Model
- UAE
- Pricing Analysis
- Market Share Analysis, 2025
- By Service Scope
- By Project Stage
- By AI Rack Density
- By Data Center Type
- By Commercial Model
- United States
- Market Structure Analysis
- Competition Dashboard
- Competition Benchmarking
- Market Share Analysis of Top Players
- By Regional
- By Service Scope
- By Project Stage
- By AI Rack Density
- By Data Center Type
- By Commercial Model
- Emerging Startups
- Innovation Benchmarking
- Competition Analysis
- Competition Deep Dive
- Vertiv
- Overview
- Product Portfolio
- Profitability by Market Segments
- Sales Footprint
- Strategy Overview
- Marketing Strategy
- Product Strategy
- Channel Strategy
- Siemens
- Jacobs
- Schneider Electric
- Eaton
- Vertiv
- Case Studies
- Success Stories
- Recent Developments
- Competition Deep Dive
- Assumptions & Acronyms Used


