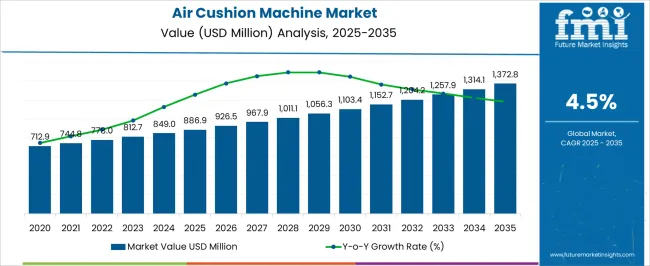
The air cushion machine market is projected to be valued at USD 511.1 million in 2023 and is expected to rise to USD 809.1 million by 2033. The sales of air cushion machines are expected to record a significant CAGR of 4.7% during the forecast period.
Expanding patient pool and rising incidence fuel growth in the blood cancer segment air-cushion machine forms air pockets in the film by sealing air, thus producing products such as bubble wraps and air pillows. Air pillows are then used between primary and secondary packaging for locking the product movement during transport. These air cushions are produced by sealing air between the layers of a plastic film using air cushion machines.
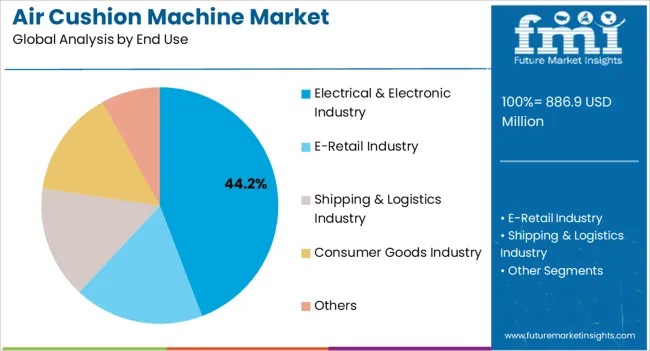
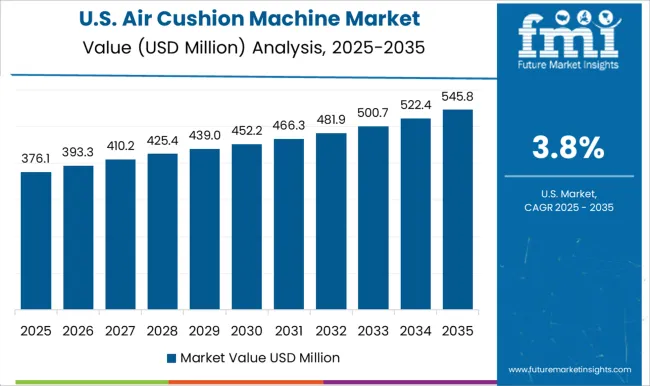
North America is considered a highly lucrative air cushion machine market, driven primarily by its utilization across different manufacturing industries focusing on developing a supply chain. The increasing market for online shopping apps in the United States is leading to increased demand for the market in the region. Increasing e-retail industries boost the growth of the air cushion machine industry.
The use of plastic films in the production process of air cushions significantly hampers the growth in the market due to the presence of laws against the use of plastic in many countries.
Attributes | Details |
---|---|
Market CAGR | 4.7% |
Market Valuation (2023) | USD 511.1 million |
Market Valuation (2033) | USD 809.1 million |
Increasing technological advancements in the packaging industry boost the growth of the air cushion machine market in the coming years. The increased demand for air cushions on the backdrop of their ability to protect the packed products drives the demand of the market.
Manufacturers of various end-use industries are focusing on strengthening their supply chain network, and protective packaging is playing an important role in the process, increasing the demand for air cushions and positively influencing the growth in the air cushion machine market. Being lightweight and compatible with production processes are some other factors boosting the growth in the air cushion machine market.
Although the air cushion machines market has numerous end-uses, numerous obstacles likely pose a challenge to market growth. The availability of other alternatives, like paper packaging, may hinder the growth of the air cushion machine market. The stringent government rules and regulations towards the use of plastic are expected to hamper the growth of the air cushion machine market in the forecasting year.
Also, the high cost of air cushion packaging is considered another restraining. In addition, the increasing use of substitutes for air cushions, such as molded fiber trays and foam, is further reducing the use of air cushions and may hinder the growth of the market.
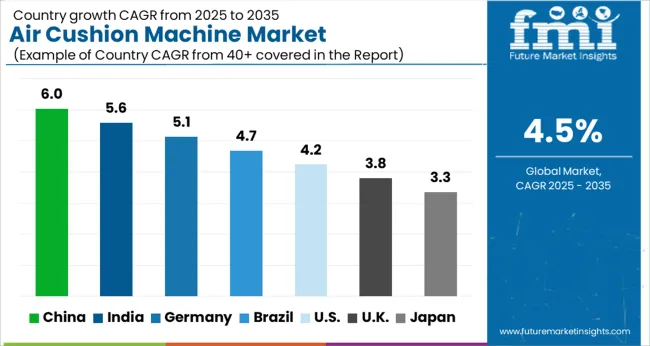
North America was the leading market for air cushion machines market, and the trend is expected to continue into the forecast period owing to the increasing disposable incomes and growing demand for consumer electronics in the region. The growing demand for air cushion machines for safe packaging purposes due to the increase in online shopping applications is expected to augment the market. As per Future Market Insight's analysis, the North American region is forecast to have a 35% total share of the market.
North America is expected to be the next dominant region, witnessing high adoption rates for the air cushion machine market during the forecast period. With a high concentration of manufacturing industries in North America, demand for the air cushion machines market is anticipated to rise.
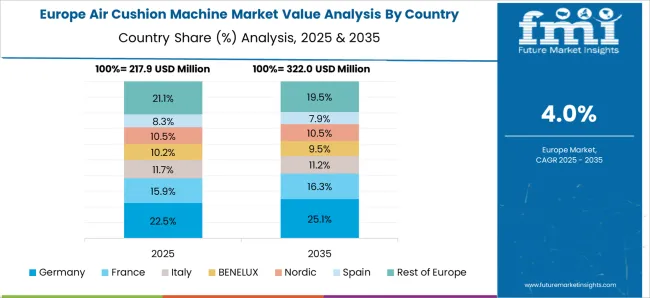
According to Future Market Insights, Europe is expected to provide immense growth opportunities for the air cushion machines market due to the growing e-consumer awareness in the region. The air cushion machines market is expected to witness sustained growth over the forecast period.
The European air cushion machines market accounts for the second-leading share of the global air cushion machine market, registering a 24% share. Advancements in packaging technology are fueling regional market growth. Increasing the use of online shopping applications directly increase the demand for air cushion packaging solution, which boost the growth of the market in the region.
In June 2021, United States-based packaging company Sealed Air invested more than USD 30 million in its Automated Packaging Systems (APS) brand to modernize and expand the capacity of its facilities. The investments see Sealed Air install ‘touchless’ automation and proprietary digital printing technologies at its APS facilities in Streetsboro and Bedford Heights, Ohio, and Keyser, West Virginia.
In March 2021, Kite Packaging Ltd expanded its product portfolio with a wide range of filler and wrapper cushions with air on demand and used 100% recyclable film. The range now comprises three unique systems, allowing customers to purchase a system specifically suited to the size and volumes.
In February 2021, German packaging firm Storopack unveiled a new paper cushion system for applications requiring high throughput and secure packaging material. The PAPERplus Track system provides paper cushions directly at the packing station, ensuring effective padding. PAPERplus Track can be used to package 5kg to 50kg products.
Attribute | Details |
---|---|
Forecast Period | 2023 to 2033 |
Historical Data Available for | 2018 to 2022 |
Market Analysis | USD million for Value |
Key Countries Covered | United States, Canada, Germany, United Kingdom, France, Italy, Spain, Russia, China, Japan, South Korea, India, Thailand, Malaysia, Indonesia, Australia, New Zealand, GCC Countries, Northern Africa, and South Africa |
Key Segments Covered | Operating Speed, End Use, Region |
Key Companies Profiled | Hangzhou Bing Jia Technology Co. Ltd.; Zhuhai E-One Science and Technology Co. Ltd.; D.J Hoogstraten; Shandong Xinyi Environmental Protection Technology Co. Ltd.; Airpack; Ameson Packaging; Focus Technology Co. Ltd.; Technology International; Sealed Air; AirPackagingMachine |
Report Coverage | Market Forecast, Company Share Analysis, Competition Intelligence, DROT Analysis, Market Dynamics and Challenges, and Strategic Growth Initiatives |
Customization & Pricing | Available upon Request |
Table 01: Global Market Value (US$ Million) Forecast by Region, 2018 to 2033
Table 02: Global Market Volume (Units) Forecast by Region, 2018 to 2033
Table 03: Global Market Value (US$ Million) Forecast by Operating Speed, 2018 to 2033
Table 04: Global Market Volume (Units) Forecast by Operating Speed, 2018 to 2033
Table 05: Global Market Value (US$ Million) Forecast by End-Use, 2018 to 2033
Table 06: Global Market Volume (Units) Forecast by End-Use, 2018 to 2033
Table 07: North America Market Value (US$ Million) Forecast by Country, 2018 to 2033
Table 08: North America Market Volume (Units) Forecast by Country, 2018 to 2033
Table 09: North America Market Value (US$ Million) Forecast by Operating Speed, 2018 to 2033
Table 10: North America Market Volume (Units) Forecast by Operating Speed, 2018 to 2033
Table 11: North America Market Value (US$ Million) Forecast by End-Use, 2018 to 2033
Table 12: North America Market Volume (Units) Forecast by End-Use, 2018 to 2033
Table 13: Latin America Market Value (US$ Million) Forecast by Country, 2018 to 2033
Table 14: Latin America Market Volume (Units) Forecast by Country, 2018 to 2033
Table 15: Latin America Market Value (US$ Million) Forecast by Operating Speed, 2018 to 2033
Table 16: Latin America Market Volume (Units) Forecast by Operating Speed, 2018 to 2033
Table 17: Latin America Market Value (US$ Million) Forecast by End-Use, 2018 to 2033
Table 18: Latin America Market Volume (Units) Forecast by End-Use, 2018 to 2033
Table 19: Western Europe Market Value (US$ Million) Forecast by Country, 2018 to 2033
Table 20: Western Europe Market Volume (Units) Forecast by Country, 2018 to 2033
Table 21: Western Europe Market Value (US$ Million) Forecast by Operating Speed, 2018 to 2033
Table 22: Western Europe Market Volume (Units) Forecast by Operating Speed, 2018 to 2033
Table 23: Western Europe Market Value (US$ Million) Forecast by End-Use, 2018 to 2033
Table 24: Western Europe Market Volume (Units) Forecast by End-Use, 2018 to 2033
Table 25: Eastern Europe Market Value (US$ Million) Forecast by Country, 2018 to 2033
Table 26: Eastern Europe Market Volume (Units) Forecast by Country, 2018 to 2033
Table 27: Eastern Europe Market Value (US$ Million) Forecast by Operating Speed, 2018 to 2033
Table 28: Eastern Europe Market Volume (Units) Forecast by Operating Speed, 2018 to 2033
Table 29: Eastern Europe Market Value (US$ Million) Forecast by End-Use, 2018 to 2033
Table 30: Eastern Europe Market Volume (Units) Forecast by End-Use, 2018 to 2033
Table 31: South Asia and Pacific Market Value (US$ Million) Forecast by Country, 2018 to 2033
Table 32: South Asia and Pacific Market Volume (Units) Forecast by Country, 2018 to 2033
Table 33: South Asia and Pacific Market Value (US$ Million) Forecast by Operating Speed, 2018 to 2033
Table 34: South Asia and Pacific Market Volume (Units) Forecast by Operating Speed, 2018 to 2033
Table 35: South Asia and Pacific Market Value (US$ Million) Forecast by End-Use, 2018 to 2033
Table 36: South Asia and Pacific Market Volume (Units) Forecast by End-Use, 2018 to 2033
Table 37: East Asia Market Value (US$ Million) Forecast by Country, 2018 to 2033
Table 38: East Asia Market Volume (Units) Forecast by Country, 2018 to 2033
Table 39: East Asia Market Value (US$ Million) Forecast by Operating Speed, 2018 to 2033
Table 40: East Asia Market Volume (Units) Forecast by Operating Speed, 2018 to 2033
Table 41: East Asia Market Value (US$ Million) Forecast by End-Use, 2018 to 2033
Table 42: East Asia Market Volume (Units) Forecast by End-Use, 2018 to 2033
Table 43: Middle East and Africa Market Value (US$ Million) Forecast by Country, 2018 to 2033
Table 44: Middle East and Africa Market Volume (Units) Forecast by Country, 2018 to 2033
Table 45: Middle East and Africa Market Value (US$ Million) Forecast by Operating Speed, 2018 to 2033
Table 46: Middle East and Africa Market Volume (Units) Forecast by Operating Speed, 2018 to 2033
Table 47: Middle East and Africa Market Value (US$ Million) Forecast by End-Use, 2018 to 2033
Table 48: Middle East and Africa Market Volume (Units) Forecast by End-Use, 2018 to 2033
Figure 01: Global Market Value (US$ Million) by Operating Speed, 2023 to 2033
Figure 02: Global Market Value (US$ Million) by End-Use, 2023 to 2033
Figure 03: Global Market Value (US$ Million) by Region, 2023 to 2033
Figure 04: Global Market Value (US$ Million) Analysis by Region, 2018 to 2033
Figure 05: Global Market Volume (Units) Analysis by Region, 2018 to 2033
Figure 06: Global Market Value Share (%) and BPS Analysis by Region, 2023 to 2033
Figure 07: Global Market Y-o-Y Growth (%) Projections by Region, 2023 to 2033
Figure 08: Global Market Value (US$ Million) Analysis by Operating Speed, 2018 to 2033
Figure 09: Global Market Volume (Units) Analysis by Operating Speed, 2018 to 2033
Figure 10: Global Market Value Share (%) and BPS Analysis by Operating Speed, 2023 to 2033
Figure 11: Global Market Y-o-Y Growth (%) Projections by Operating Speed, 2023 to 2033
Figure 12: Global Market Value (US$ Million) Analysis by End-Use, 2018 to 2033
Figure 13: Global Market Volume (Units) Analysis by End-Use, 2018 to 2033
Figure 14: Global Market Value Share (%) and BPS Analysis by End-Use, 2023 to 2033
Figure 15: Global Market Y-o-Y Growth (%) Projections by End-Use, 2023 to 2033
Figure 16: Global Market Attractiveness by Operating Speed, 2023 to 2033
Figure 17: Global Market Attractiveness by End-Use, 2023 to 2033
Figure 18: Global Market Attractiveness by Region, 2023 to 2033
Figure 19: North America Market Value (US$ Million) by Operating Speed, 2023 to 2033
Figure 20: North America Market Value (US$ Million) by End-Use, 2023 to 2033
Figure 21: North America Market Value (US$ Million) by Country, 2023 to 2033
Figure 22: North America Market Value (US$ Million) Analysis by Country, 2018 to 2033
Figure 23: North America Market Volume (Units) Analysis by Country, 2018 to 2033
Figure 24: North America Market Value Share (%) and BPS Analysis by Country, 2023 to 2033
Figure 25: North America Market Y-o-Y Growth (%) Projections by Country, 2023 to 2033
Figure 26: North America Market Value (US$ Million) Analysis by Operating Speed, 2018 to 2033
Figure 27: North America Market Volume (Units) Analysis by Operating Speed, 2018 to 2033
Figure 28: North America Market Value Share (%) and BPS Analysis by Operating Speed, 2023 to 2033
Figure 29: North America Market Y-o-Y Growth (%) Projections by Operating Speed, 2023 to 2033
Figure 30: North America Market Value (US$ Million) Analysis by End-Use, 2018 to 2033
Figure 31: North America Market Volume (Units) Analysis by End-Use, 2018 to 2033
Figure 32: North America Market Value Share (%) and BPS Analysis by End-Use, 2023 to 2033
Figure 33: North America Market Y-o-Y Growth (%) Projections by End-Use, 2023 to 2033
Figure 34: North America Market Attractiveness by Operating Speed, 2023 to 2033
Figure 35: North America Market Attractiveness by End-Use, 2023 to 2033
Figure 36: North America Market Attractiveness by Country, 2023 to 2033
Figure 37: Latin America Market Value (US$ Million) by Operating Speed, 2023 to 2033
Figure 38: Latin America Market Value (US$ Million) by End-Use, 2023 to 2033
Figure 39: Latin America Market Value (US$ Million) by Country, 2023 to 2033
Figure 40: Latin America Market Value (US$ Million) Analysis by Country, 2018 to 2033
Figure 41: Latin America Market Volume (Units) Analysis by Country, 2018 to 2033
Figure 42: Latin America Market Value Share (%) and BPS Analysis by Country, 2023 to 2033
Figure 43: Latin America Market Y-o-Y Growth (%) Projections by Country, 2023 to 2033
Figure 44: Latin America Market Value (US$ Million) Analysis by Operating Speed, 2018 to 2033
Figure 45: Latin America Market Volume (Units) Analysis by Operating Speed, 2018 to 2033
Figure 46: Latin America Market Value Share (%) and BPS Analysis by Operating Speed, 2023 to 2033
Figure 47: Latin America Market Y-o-Y Growth (%) Projections by Operating Speed, 2023 to 2033
Figure 48: Latin America Market Value (US$ Million) Analysis by End-Use, 2018 to 2033
Figure 49: Latin America Market Volume (Units) Analysis by End-Use, 2018 to 2033
Figure 50: Latin America Market Value Share (%) and BPS Analysis by End-Use, 2023 to 2033
Figure 51: Latin America Market Y-o-Y Growth (%) Projections by End-Use, 2023 to 2033
Figure 52: Latin America Market Attractiveness by Operating Speed, 2023 to 2033
Figure 53: Latin America Market Attractiveness by End-Use, 2023 to 2033
Figure 54: Latin America Market Attractiveness by Country, 2023 to 2033
Figure 55: Western Europe Market Value (US$ Million) by Operating Speed, 2023 to 2033
Figure 56: Western Europe Market Value (US$ Million) by End-Use, 2023 to 2033
Figure 57: Western Europe Market Value (US$ Million) by Country, 2023 to 2033
Figure 58: Western Europe Market Value (US$ Million) Analysis by Country, 2018 to 2033
Figure 59: Western Europe Market Volume (Units) Analysis by Country, 2018 to 2033
Figure 60: Western Europe Market Value Share (%) and BPS Analysis by Country, 2023 to 2033
Figure 61: Western Europe Market Y-o-Y Growth (%) Projections by Country, 2023 to 2033
Figure 62: Western Europe Market Value (US$ Million) Analysis by Operating Speed, 2018 to 2033
Figure 63: Western Europe Market Volume (Units) Analysis by Operating Speed, 2018 to 2033
Figure 64: Western Europe Market Value Share (%) and BPS Analysis by Operating Speed, 2023 to 2033
Figure 65: Western Europe Market Y-o-Y Growth (%) Projections by Operating Speed, 2023 to 2033
Figure 66: Western Europe Market Value (US$ Million) Analysis by End-Use, 2018 to 2033
Figure 67: Western Europe Market Volume (Units) Analysis by End-Use, 2018 to 2033
Figure 68: Western Europe Market Value Share (%) and BPS Analysis by End-Use, 2023 to 2033
Figure 69: Western Europe Market Y-o-Y Growth (%) Projections by End-Use, 2023 to 2033
Figure 70: Western Europe Market Attractiveness by Operating Speed, 2023 to 2033
Figure 71: Western Europe Market Attractiveness by End-Use, 2023 to 2033
Figure 72: Western Europe Market Attractiveness by Country, 2023 to 2033
Figure 73: Eastern Europe Market Value (US$ Million) by Operating Speed, 2023 to 2033
Figure 74: Eastern Europe Market Value (US$ Million) by End-Use, 2023 to 2033
Figure 75: Eastern Europe Market Value (US$ Million) by Country, 2023 to 2033
Figure 76: Eastern Europe Market Value (US$ Million) Analysis by Country, 2018 to 2033
Figure 77: Eastern Europe Market Volume (Units) Analysis by Country, 2018 to 2033
Figure 78: Eastern Europe Market Value Share (%) and BPS Analysis by Country, 2023 to 2033
Figure 79: Eastern Europe Market Y-o-Y Growth (%) Projections by Country, 2023 to 2033
Figure 80: Eastern Europe Market Value (US$ Million) Analysis by Operating Speed, 2018 to 2033
Figure 81: Eastern Europe Market Volume (Units) Analysis by Operating Speed, 2018 to 2033
Figure 82: Eastern Europe Market Value Share (%) and BPS Analysis by Operating Speed, 2023 to 2033
Figure 83: Eastern Europe Market Y-o-Y Growth (%) Projections by Operating Speed, 2023 to 2033
Figure 84: Eastern Europe Market Value (US$ Million) Analysis by End-Use, 2018 to 2033
Figure 85: Eastern Europe Market Volume (Units) Analysis by End-Use, 2018 to 2033
Figure 86: Eastern Europe Market Value Share (%) and BPS Analysis by End-Use, 2023 to 2033
Figure 87: Eastern Europe Market Y-o-Y Growth (%) Projections by End-Use, 2023 to 2033
Figure 88: Eastern Europe Market Attractiveness by Operating Speed, 2023 to 2033
Figure 89: Eastern Europe Market Attractiveness by End-Use, 2023 to 2033
Figure 90: Eastern Europe Market Attractiveness by Country, 2023 to 2033
Figure 91: South Asia and Pacific Market Value (US$ Million) by Operating Speed, 2023 to 2033
Figure 92: South Asia and Pacific Market Value (US$ Million) by End-Use, 2023 to 2033
Figure 93: South Asia and Pacific Market Value (US$ Million) by Country, 2023 to 2033
Figure 94: South Asia and Pacific Market Value (US$ Million) Analysis by Country, 2018 to 2033
Figure 95: South Asia and Pacific Market Volume (Units) Analysis by Country, 2018 to 2033
Figure 96: South Asia and Pacific Market Value Share (%) and BPS Analysis by Country, 2023 to 2033
Figure 97: South Asia and Pacific Market Y-o-Y Growth (%) Projections by Country, 2023 to 2033
Figure 98: South Asia and Pacific Market Value (US$ Million) Analysis by Operating Speed, 2018 to 2033
Figure 99: South Asia and Pacific Market Volume (Units) Analysis by Operating Speed, 2018 to 2033
Figure 100: South Asia and Pacific Market Value Share (%) and BPS Analysis by Operating Speed, 2023 to 2033
Figure 101: South Asia and Pacific Market Y-o-Y Growth (%) Projections by Operating Speed, 2023 to 2033
Figure 102: South Asia and Pacific Market Value (US$ Million) Analysis by End-Use, 2018 to 2033
Figure 103: South Asia and Pacific Market Volume (Units) Analysis by End-Use, 2018 to 2033
Figure 104: South Asia and Pacific Market Value Share (%) and BPS Analysis by End-Use, 2023 to 2033
Figure 105: South Asia and Pacific Market Y-o-Y Growth (%) Projections by End-Use, 2023 to 2033
Figure 106: South Asia and Pacific Market Attractiveness by Operating Speed, 2023 to 2033
Figure 107: South Asia and Pacific Market Attractiveness by End-Use, 2023 to 2033
Figure 108: South Asia and Pacific Market Attractiveness by Country, 2023 to 2033
Figure 109: East Asia Market Value (US$ Million) by Operating Speed, 2023 to 2033
Figure 110: East Asia Market Value (US$ Million) by End-Use, 2023 to 2033
Figure 111: East Asia Market Value (US$ Million) by Country, 2023 to 2033
Figure 112: East Asia Market Value (US$ Million) Analysis by Country, 2018 to 2033
Figure 113: East Asia Market Volume (Units) Analysis by Country, 2018 to 2033
Figure 114: East Asia Market Value Share (%) and BPS Analysis by Country, 2023 to 2033
Figure 115: East Asia Market Y-o-Y Growth (%) Projections by Country, 2023 to 2033
Figure 116: East Asia Market Value (US$ Million) Analysis by Operating Speed, 2018 to 2033
Figure 117: East Asia Market Volume (Units) Analysis by Operating Speed, 2018 to 2033
Figure 118: East Asia Market Value Share (%) and BPS Analysis by Operating Speed, 2023 to 2033
Figure 119: East Asia Market Y-o-Y Growth (%) Projections by Operating Speed, 2023 to 2033
Figure 120: East Asia Market Value (US$ Million) Analysis by End-Use, 2018 to 2033
Figure 121: East Asia Market Volume (Units) Analysis by End-Use, 2018 to 2033
Figure 122: East Asia Market Value Share (%) and BPS Analysis by End-Use, 2023 to 2033
Figure 123: East Asia Market Y-o-Y Growth (%) Projections by End-Use, 2023 to 2033
Figure 124: East Asia Market Attractiveness by Operating Speed, 2023 to 2033
Figure 125: East Asia Market Attractiveness by End-Use, 2023 to 2033
Figure 126: East Asia Market Attractiveness by Country, 2023 to 2033
Figure 127: Middle East and Africa Market Value (US$ Million) by Operating Speed, 2023 to 2033
Figure 128: Middle East and Africa Market Value (US$ Million) by End-Use, 2023 to 2033
Figure 129: Middle East and Africa Market Value (US$ Million) by Country, 2023 to 2033
Figure 130: Middle East and Africa Market Value (US$ Million) Analysis by Country, 2018 to 2033
Figure 131: Middle East and Africa Market Volume (Units) Analysis by Country, 2018 to 2033
Figure 132: Middle East and Africa Market Value Share (%) and BPS Analysis by Country, 2023 to 2033
Figure 133: Middle East and Africa Market Y-o-Y Growth (%) Projections by Country, 2023 to 2033
Figure 134: Middle East and Africa Market Value (US$ Million) Analysis by Operating Speed, 2018 to 2033
Figure 135: Middle East and Africa Market Volume (Units) Analysis by Operating Speed, 2018 to 2033
Figure 136: Middle East and Africa Market Value Share (%) and BPS Analysis by Operating Speed, 2023 to 2033
Figure 137: Middle East and Africa Market Y-o-Y Growth (%) Projections by Operating Speed, 2023 to 2033
Figure 138: Middle East and Africa Market Value (US$ Million) Analysis by End-Use, 2018 to 2033
Figure 139: Middle East and Africa Market Volume (Units) Analysis by End-Use, 2018 to 2033
Figure 140: Middle East and Africa Market Value Share (%) and BPS Analysis by End-Use, 2023 to 2033
Figure 141: Middle East and Africa Market Y-o-Y Growth (%) Projections by End-Use, 2023 to 2033
Figure 142: Middle East and Africa Market Attractiveness by Operating Speed, 2023 to 2033
Figure 143: Middle East and Africa Market Attractiveness by End-Use, 2023 to 2033
Figure 144: Middle East and Africa Market Attractiveness by Country, 2023 to 2033
The sales of air cushion machine are anticipated to be worth USD 809.1 million by 2033.
The growth potential of the market is 4.7% through 2033.
Increasing demand for primary and secondary packaging, in conjunction with expanding manufacturing industries is fueling market growth.
Technological advances and growing concerns about products in transit are consolidating the sales of air cushion machines.
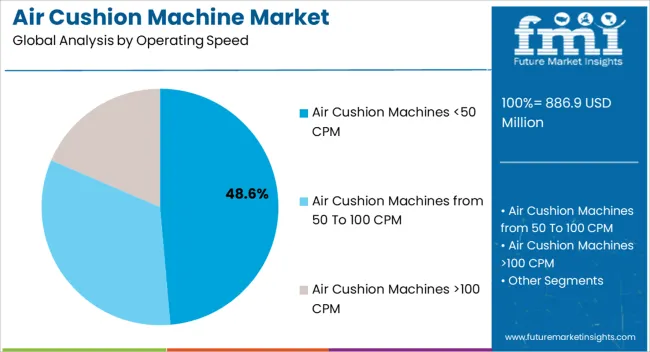
Air cushion machines > 100 CPM is being extensively deployed.
Explore Packaging Machinery Insights
Thank you!
You will receive an email from our Business Development Manager. Please be sure to check your SPAM/JUNK folder too.