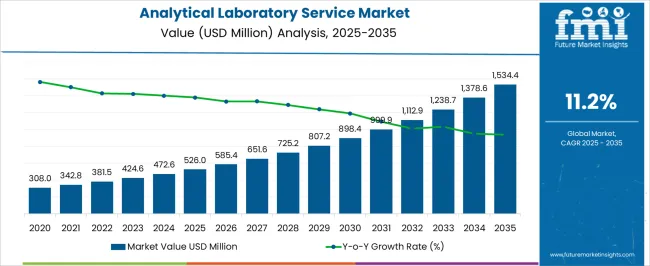
The global analytical laboratory service market is anticipated to be worth USD 1,375.0 million by 2034. According to the estimates, the market is projected to clock a staggering 11.3% CAGR until 2034. In 2024, the analytical laboratory service industry is valued at USD 472.6 million.
Attributes | Details |
---|---|
Analytical Laboratory Service Market Size, 2023 | USD 413.5 million |
Analytical Laboratory Service Market Size, 2024 | USD 472.6 million |
Analytical Laboratory Service Market Size, 2034 | USD 1,375.0 million |
Value CAGR (2024 to 2034) | 11.3% |
Growing Demand for Point-of-Care Testing Reshapes the Market Landscape
The market for analytical laboratory services is undergoing shifts due to the growing popularity of point-of-care testing, especially in the healthcare industry. This trend highlights how crucial it is to perform diagnostic tests closer to the patient to expedite sample processing and shipping. Point-of-care testing laboratories meet the increasing need for quick, on-site diagnostic solutions.
This approach makes healthcare services more efficient and establishes analytical laboratories as essential players in the larger movement toward patient-centered and individualized healthcare delivery models.
Adoption of Smart Lab Infrastructure with Sensor Networks Rises in the Market
The implementation of smart lab infrastructure with sensor networks is a significant step in developing data-driven laboratory environments. Sensor networks facilitate proactive maintenance and resource management by supplying real-time data on vital parameters.
The deployment of smart lab infrastructure is consistent with a business strategy emphasizing data-driven decision-making and operational efficiency. Utilizing sensor networks gives laboratories a competitive advantage by guaranteeing equipment dependability, decreasing downtime, and showcasing a dedication to state-of-the-art technology in providing superior analytical services.
Flourishing Biopharmaceutical and Biotechnology Sectors Present Opportunities in the Market
Analytical labs have the chance to provide specialized services for the testing and characterization of cutting-edge biopharmaceutical products due to the expanding biopharmaceutical and biotechnology industries. This covers biosimilars, gene treatments, and monoclonal antibodies.
By specializing in advanced analytical methods unique to the biopharmaceutical development industry, laboratories can gain a competitive edge and establish themselves as the preferred suppliers for companies involved in these fast-growing industries.
Attributes | Details |
---|---|
Trends | In analytical laboratories, a notable trend is the combination of automation, digital technology, and data analytics. This involves maximizing the effectiveness and precision of analytical procedures by utilizing machine learning (ML) and artificial intelligence (AI) algorithms for data analysis, interpretation, and decision-making. Blockchain technology is becoming increasingly popular in analytical labs, particularly in medicines and food safety. There is a growing market that demands specialized and customized testing services that are suited to certain industry requirements. To meet customers' changing needs in industries like healthcare and life sciences, laboratories are providing specialized services like genomics, proteomics, and metabolomics. Analytical laboratories are implementing sustainable practices. This complies with the worldwide focus on environmental sustainability and involves using eco-friendly materials, energy-efficient technology, and green laboratory efforts. Analytical equipment is outfitted with Internet of Things (IoT) integration, allowing for remote instrument operation, data collecting, and real-time monitoring. Predictive maintenance is made easier by this connectedness, which also improves the overall effectiveness of laboratory operations. |
Opportunities | The use of cutting-edge technology to provide remote testing services allows laboratories to meet the changing demands of their clientele, particularly when physical presence is difficult. There is a chance for laboratories to provide more complex solutions and in-depth insights due to the growing demand for advanced data analytics services. Laboratories can create and supply specific testing services in emerging sectors like biopharmaceuticals and cannabis testing. As environmental concerns grow, laboratories have more opportunities to offer services linked to sustainability and ecological monitoring. Labs that use blockchain technology to handle and trace data securely can set themselves apart by providing tamper-proof records and increasing customer trust in the veracity of test findings. |
Challenges | The operational continuity of laboratories is threatened by events like pandemics, which also affect personnel availability, supply networks, and overall corporate resilience. Quick technological advances could prove problematic for well-established labs that find it difficult to stay up to date with new developments and risk becoming obsolete. |
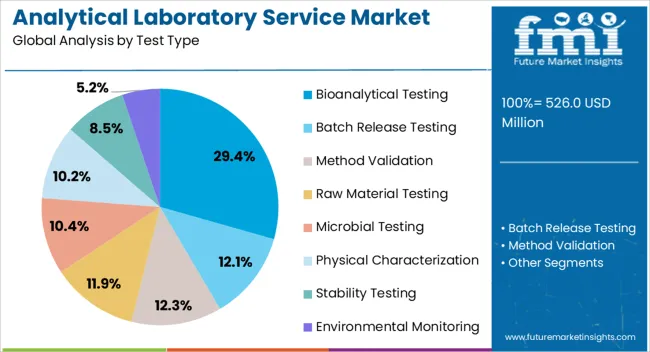
Segment | Bioanalytical Testing (Test Type) |
---|---|
Value CAGR (2024 to 2034) | 11.1% |
Based on test type, the bioanalytical testing segment is projected to lead with an 11.1% CAGR through 2034. This is attributable to the following factors:
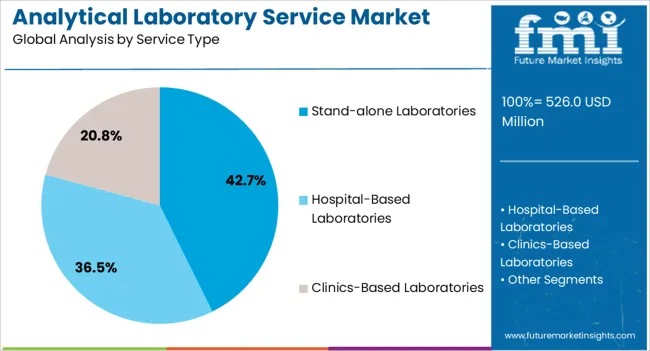
Segment | Hospital-based Laboratories (Service Type) |
---|---|
Value CAGR (2024 to 2034) | 10.8% |
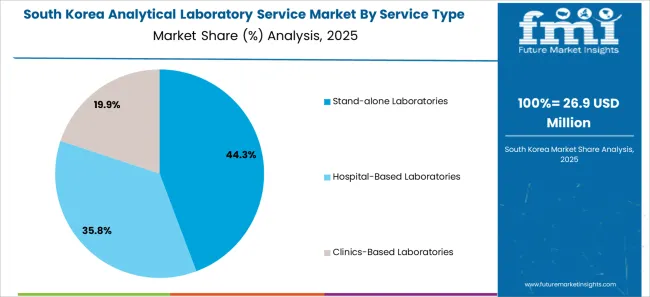
Based on service type, the hospital-based laboratories segment is anticipated to dominate with a 10.8% CAGR through 2034. The key factors boosting the segment’s growth are:
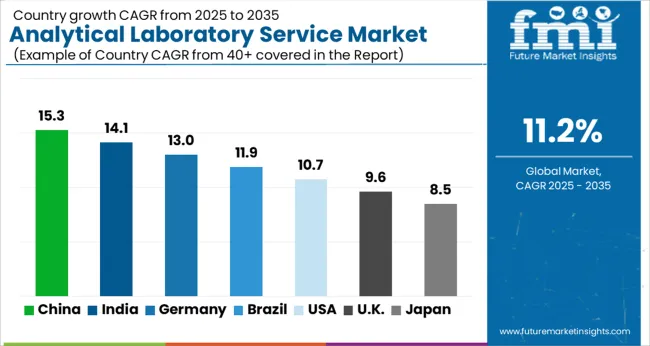
Country | Value CAGR (2024 to 2034) |
---|---|
United States | 11.6% |
United Kingdom | 12.5% |
China | 11.9% |
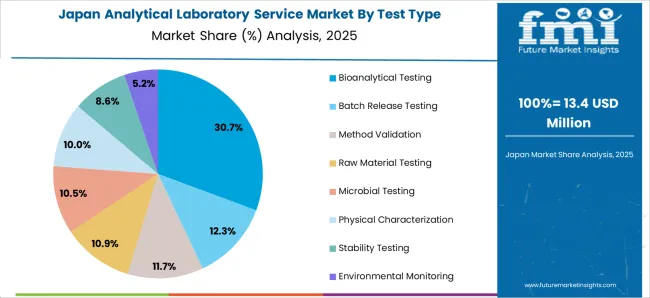
Japan | 12.8% |
South Korea | 13.1% |
The analytical laboratory services market size in the United States is projected to rise at an 11.1% CAGR through 2034. The key drivers are:
The demand for analytical laboratory services in the United Kingdom is anticipated to surge at a 12.5% CAGR through 2034. The key factors are:
The growth of the analytical laboratory service market in China is estimated at an 11.9% CAGR through 2034. The key drivers are:
The demand for analytical laboratory services in Japan is expected to increase at a 12.8% CAGR through 2034. The key factors are:
The analytical laboratory services market size in South Korea is projected to rise at a 13.1% CAGR through 2034. The key drivers are:
Specialized analytical services are necessary, given South Korea's emphasis on the development of nanotechnology and innovative materials. Testing facilities for high-performance materials, sophisticated polymers, and nanomaterials help South Korean firms succeed in producing innovative goods.
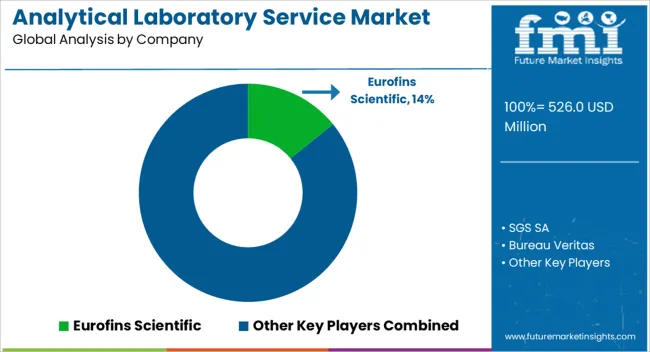
The global analytical laboratory service market is highly competitive, with top rivals struggling for market share and advantageous positioning. Well-known international firms with a wide global presence and diverse testing service offerings, such as Bureau Veritas, SGS SA, and Eurofins Scientific, influence the market.
These industry titans make use of economies of scale to make substantial investments in state-of-the-art analytical technologies, which allow them to serve a variety of industries, such as biotechnology, pharmaceuticals, environmental testing, and industrial testing.
Recent Developments
Table 1: Global Market Value (US$ Million) Forecast by Region, 2019 to 2034
Table 2: Global Market Value (US$ Million) Forecast by Test Type, 2019 to 2034
Table 3: Global Market Value (US$ Million) Forecast by Service Type, 2019 to 2034
Table 4: Global Market Value (US$ Million) Forecast by Method Type, 2019 to 2034
Table 5: Global Market Value (US$ Million) Forecast by Application, 2019 to 2034
Table 6: Global Market Value (US$ Million) Forecast by Technology, 2019 to 2034
Table 7: Global Market Value (US$ Million) Forecast by End-User, 2019 to 2034
Table 8: North America Market Value (US$ Million) Forecast by Country, 2019 to 2034
Table 9: North America Market Value (US$ Million) Forecast by Test Type, 2019 to 2034
Table 10: North America Market Value (US$ Million) Forecast by Service Type, 2019 to 2034
Table 11: North America Market Value (US$ Million) Forecast by Method Type, 2019 to 2034
Table 12: North America Market Value (US$ Million) Forecast by Application, 2019 to 2034
Table 13: North America Market Value (US$ Million) Forecast by Technology, 2019 to 2034
Table 14: North America Market Value (US$ Million) Forecast by End-User, 2019 to 2034
Table 15: Latin America Market Value (US$ Million) Forecast by Country, 2019 to 2034
Table 16: Latin America Market Value (US$ Million) Forecast by Test Type, 2019 to 2034
Table 17: Latin America Market Value (US$ Million) Forecast by Service Type, 2019 to 2034
Table 18: Latin America Market Value (US$ Million) Forecast by Method Type, 2019 to 2034
Table 19: Latin America Market Value (US$ Million) Forecast by Application, 2019 to 2034
Table 20: Latin America Market Value (US$ Million) Forecast by Technology, 2019 to 2034
Table 21: Latin America Market Value (US$ Million) Forecast by End-User, 2019 to 2034
Table 22: Western Europe Market Value (US$ Million) Forecast by Country, 2019 to 2034
Table 23: Western Europe Market Value (US$ Million) Forecast by Test Type, 2019 to 2034
Table 24: Western Europe Market Value (US$ Million) Forecast by Service Type, 2019 to 2034
Table 25: Western Europe Market Value (US$ Million) Forecast by Method Type, 2019 to 2034
Table 26: Western Europe Market Value (US$ Million) Forecast by Application, 2019 to 2034
Table 27: Western Europe Market Value (US$ Million) Forecast by Technology, 2019 to 2034
Table 28: Western Europe Market Value (US$ Million) Forecast by End-User, 2019 to 2034
Table 29: Eastern Europe Market Value (US$ Million) Forecast by Country, 2019 to 2034
Table 30: Eastern Europe Market Value (US$ Million) Forecast by Test Type, 2019 to 2034
Table 31: Eastern Europe Market Value (US$ Million) Forecast by Service Type, 2019 to 2034
Table 32: Eastern Europe Market Value (US$ Million) Forecast by Method Type, 2019 to 2034
Table 33: Eastern Europe Market Value (US$ Million) Forecast by Application, 2019 to 2034
Table 34: Eastern Europe Market Value (US$ Million) Forecast by Technology, 2019 to 2034
Table 35: Eastern Europe Market Value (US$ Million) Forecast by End-User, 2019 to 2034
Table 36: South Asia and Pacific Market Value (US$ Million) Forecast by Country, 2019 to 2034
Table 37: South Asia and Pacific Market Value (US$ Million) Forecast by Test Type, 2019 to 2034
Table 38: South Asia and Pacific Market Value (US$ Million) Forecast by Service Type, 2019 to 2034
Table 39: South Asia and Pacific Market Value (US$ Million) Forecast by Method Type, 2019 to 2034
Table 40: South Asia and Pacific Market Value (US$ Million) Forecast by Application, 2019 to 2034
Table 41: South Asia and Pacific Market Value (US$ Million) Forecast by Technology, 2019 to 2034
Table 42: South Asia and Pacific Market Value (US$ Million) Forecast by End-User, 2019 to 2034
Table 43: East Asia Market Value (US$ Million) Forecast by Country, 2019 to 2034
Table 44: East Asia Market Value (US$ Million) Forecast by Test Type, 2019 to 2034
Table 45: East Asia Market Value (US$ Million) Forecast by Service Type, 2019 to 2034
Table 46: East Asia Market Value (US$ Million) Forecast by Method Type, 2019 to 2034
Table 47: East Asia Market Value (US$ Million) Forecast by Application, 2019 to 2034
Table 48: East Asia Market Value (US$ Million) Forecast by Technology, 2019 to 2034
Table 49: East Asia Market Value (US$ Million) Forecast by End-User, 2019 to 2034
Table 50: Middle East and Africa Market Value (US$ Million) Forecast by Country, 2019 to 2034
Table 51: Middle East and Africa Market Value (US$ Million) Forecast by Test Type, 2019 to 2034
Table 52: Middle East and Africa Market Value (US$ Million) Forecast by Service Type, 2019 to 2034
Table 53: Middle East and Africa Market Value (US$ Million) Forecast by Method Type, 2019 to 2034
Table 54: Middle East and Africa Market Value (US$ Million) Forecast by Application, 2019 to 2034
Table 55: Middle East and Africa Market Value (US$ Million) Forecast by Technology, 2019 to 2034
Table 56: Middle East and Africa Market Value (US$ Million) Forecast by End-User, 2019 to 2034
Figure 1: Global Market Value (US$ Million) by Test Type, 2024 to 2034
Figure 2: Global Market Value (US$ Million) by Service Type, 2024 to 2034
Figure 3: Global Market Value (US$ Million) by Method Type, 2024 to 2034
Figure 4: Global Market Value (US$ Million) by Application, 2024 to 2034
Figure 5: Global Market Value (US$ Million) by Technology, 2024 to 2034
Figure 6: Global Market Value (US$ Million) by End-User, 2024 to 2034
Figure 7: Global Market Value (US$ Million) by Region, 2024 to 2034
Figure 8: Global Market Value (US$ Million) Analysis by Region, 2019 to 2034
Figure 9: Global Market Value Share (%) and BPS Analysis by Region, 2024 to 2034
Figure 10: Global Market Y-o-Y Growth (%) Projections by Region, 2024 to 2034
Figure 11: Global Market Value (US$ Million) Analysis by Test Type, 2019 to 2034
Figure 12: Global Market Value Share (%) and BPS Analysis by Test Type, 2024 to 2034
Figure 13: Global Market Y-o-Y Growth (%) Projections by Test Type, 2024 to 2034
Figure 14: Global Market Value (US$ Million) Analysis by Service Type, 2019 to 2034
Figure 15: Global Market Value Share (%) and BPS Analysis by Service Type, 2024 to 2034
Figure 16: Global Market Y-o-Y Growth (%) Projections by Service Type, 2024 to 2034
Figure 17: Global Market Value (US$ Million) Analysis by Method Type, 2019 to 2034
Figure 18: Global Market Value Share (%) and BPS Analysis by Method Type, 2024 to 2034
Figure 19: Global Market Y-o-Y Growth (%) Projections by Method Type, 2024 to 2034
Figure 20: Global Market Value (US$ Million) Analysis by Application, 2019 to 2034
Figure 21: Global Market Value Share (%) and BPS Analysis by Application, 2024 to 2034
Figure 22: Global Market Y-o-Y Growth (%) Projections by Application, 2024 to 2034
Figure 23: Global Market Value (US$ Million) Analysis by Technology, 2019 to 2034
Figure 24: Global Market Value Share (%) and BPS Analysis by Technology, 2024 to 2034
Figure 25: Global Market Y-o-Y Growth (%) Projections by Technology, 2024 to 2034
Figure 26: Global Market Value (US$ Million) Analysis by End-User, 2019 to 2034
Figure 27: Global Market Value Share (%) and BPS Analysis by End-User, 2024 to 2034
Figure 28: Global Market Y-o-Y Growth (%) Projections by End-User, 2024 to 2034
Figure 29: Global Market Attractiveness by Test Type, 2024 to 2034
Figure 30: Global Market Attractiveness by Service Type, 2024 to 2034
Figure 31: Global Market Attractiveness by Method Type, 2024 to 2034
Figure 32: Global Market Attractiveness by Application, 2024 to 2034
Figure 33: Global Market Attractiveness by Technology, 2024 to 2034
Figure 34: Global Market Attractiveness by End-User, 2024 to 2034
Figure 35: Global Market Attractiveness by Region, 2024 to 2034
Figure 36: North America Market Value (US$ Million) by Test Type, 2024 to 2034
Figure 37: North America Market Value (US$ Million) by Service Type, 2024 to 2034
Figure 38: North America Market Value (US$ Million) by Method Type, 2024 to 2034
Figure 39: North America Market Value (US$ Million) by Application, 2024 to 2034
Figure 40: North America Market Value (US$ Million) by Technology, 2024 to 2034
Figure 41: North America Market Value (US$ Million) by End-User, 2024 to 2034
Figure 42: North America Market Value (US$ Million) by Country, 2024 to 2034
Figure 43: North America Market Value (US$ Million) Analysis by Country, 2019 to 2034
Figure 44: North America Market Value Share (%) and BPS Analysis by Country, 2024 to 2034
Figure 45: North America Market Y-o-Y Growth (%) Projections by Country, 2024 to 2034
Figure 46: North America Market Value (US$ Million) Analysis by Test Type, 2019 to 2034
Figure 47: North America Market Value Share (%) and BPS Analysis by Test Type, 2024 to 2034
Figure 48: North America Market Y-o-Y Growth (%) Projections by Test Type, 2024 to 2034
Figure 49: North America Market Value (US$ Million) Analysis by Service Type, 2019 to 2034
Figure 50: North America Market Value Share (%) and BPS Analysis by Service Type, 2024 to 2034
Figure 51: North America Market Y-o-Y Growth (%) Projections by Service Type, 2024 to 2034
Figure 52: North America Market Value (US$ Million) Analysis by Method Type, 2019 to 2034
Figure 53: North America Market Value Share (%) and BPS Analysis by Method Type, 2024 to 2034
Figure 54: North America Market Y-o-Y Growth (%) Projections by Method Type, 2024 to 2034
Figure 55: North America Market Value (US$ Million) Analysis by Application, 2019 to 2034
Figure 56: North America Market Value Share (%) and BPS Analysis by Application, 2024 to 2034
Figure 57: North America Market Y-o-Y Growth (%) Projections by Application, 2024 to 2034
Figure 58: North America Market Value (US$ Million) Analysis by Technology, 2019 to 2034
Figure 59: North America Market Value Share (%) and BPS Analysis by Technology, 2024 to 2034
Figure 60: North America Market Y-o-Y Growth (%) Projections by Technology, 2024 to 2034
Figure 61: North America Market Value (US$ Million) Analysis by End-User, 2019 to 2034
Figure 62: North America Market Value Share (%) and BPS Analysis by End-User, 2024 to 2034
Figure 63: North America Market Y-o-Y Growth (%) Projections by End-User, 2024 to 2034
Figure 64: North America Market Attractiveness by Test Type, 2024 to 2034
Figure 65: North America Market Attractiveness by Service Type, 2024 to 2034
Figure 66: North America Market Attractiveness by Method Type, 2024 to 2034
Figure 67: North America Market Attractiveness by Application, 2024 to 2034
Figure 68: North America Market Attractiveness by Technology, 2024 to 2034
Figure 69: North America Market Attractiveness by End-User, 2024 to 2034
Figure 70: North America Market Attractiveness by Country, 2024 to 2034
Figure 71: Latin America Market Value (US$ Million) by Test Type, 2024 to 2034
Figure 72: Latin America Market Value (US$ Million) by Service Type, 2024 to 2034
Figure 73: Latin America Market Value (US$ Million) by Method Type, 2024 to 2034
Figure 74: Latin America Market Value (US$ Million) by Application, 2024 to 2034
Figure 75: Latin America Market Value (US$ Million) by Technology, 2024 to 2034
Figure 76: Latin America Market Value (US$ Million) by End-User, 2024 to 2034
Figure 77: Latin America Market Value (US$ Million) by Country, 2024 to 2034
Figure 78: Latin America Market Value (US$ Million) Analysis by Country, 2019 to 2034
Figure 79: Latin America Market Value Share (%) and BPS Analysis by Country, 2024 to 2034
Figure 80: Latin America Market Y-o-Y Growth (%) Projections by Country, 2024 to 2034
Figure 81: Latin America Market Value (US$ Million) Analysis by Test Type, 2019 to 2034
Figure 82: Latin America Market Value Share (%) and BPS Analysis by Test Type, 2024 to 2034
Figure 83: Latin America Market Y-o-Y Growth (%) Projections by Test Type, 2024 to 2034
Figure 84: Latin America Market Value (US$ Million) Analysis by Service Type, 2019 to 2034
Figure 85: Latin America Market Value Share (%) and BPS Analysis by Service Type, 2024 to 2034
Figure 86: Latin America Market Y-o-Y Growth (%) Projections by Service Type, 2024 to 2034
Figure 87: Latin America Market Value (US$ Million) Analysis by Method Type, 2019 to 2034
Figure 88: Latin America Market Value Share (%) and BPS Analysis by Method Type, 2024 to 2034
Figure 89: Latin America Market Y-o-Y Growth (%) Projections by Method Type, 2024 to 2034
Figure 90: Latin America Market Value (US$ Million) Analysis by Application, 2019 to 2034
Figure 91: Latin America Market Value Share (%) and BPS Analysis by Application, 2024 to 2034
Figure 92: Latin America Market Y-o-Y Growth (%) Projections by Application, 2024 to 2034
Figure 93: Latin America Market Value (US$ Million) Analysis by Technology, 2019 to 2034
Figure 94: Latin America Market Value Share (%) and BPS Analysis by Technology, 2024 to 2034
Figure 95: Latin America Market Y-o-Y Growth (%) Projections by Technology, 2024 to 2034
Figure 96: Latin America Market Value (US$ Million) Analysis by End-User, 2019 to 2034
Figure 97: Latin America Market Value Share (%) and BPS Analysis by End-User, 2024 to 2034
Figure 98: Latin America Market Y-o-Y Growth (%) Projections by End-User, 2024 to 2034
Figure 99: Latin America Market Attractiveness by Test Type, 2024 to 2034
Figure 100: Latin America Market Attractiveness by Service Type, 2024 to 2034
Figure 101: Latin America Market Attractiveness by Method Type, 2024 to 2034
Figure 102: Latin America Market Attractiveness by Application, 2024 to 2034
Figure 103: Latin America Market Attractiveness by Technology, 2024 to 2034
Figure 104: Latin America Market Attractiveness by End-User, 2024 to 2034
Figure 105: Latin America Market Attractiveness by Country, 2024 to 2034
Figure 106: Western Europe Market Value (US$ Million) by Test Type, 2024 to 2034
Figure 107: Western Europe Market Value (US$ Million) by Service Type, 2024 to 2034
Figure 108: Western Europe Market Value (US$ Million) by Method Type, 2024 to 2034
Figure 109: Western Europe Market Value (US$ Million) by Application, 2024 to 2034
Figure 110: Western Europe Market Value (US$ Million) by Technology, 2024 to 2034
Figure 111: Western Europe Market Value (US$ Million) by End-User, 2024 to 2034
Figure 112: Western Europe Market Value (US$ Million) by Country, 2024 to 2034
Figure 113: Western Europe Market Value (US$ Million) Analysis by Country, 2019 to 2034
Figure 114: Western Europe Market Value Share (%) and BPS Analysis by Country, 2024 to 2034
Figure 115: Western Europe Market Y-o-Y Growth (%) Projections by Country, 2024 to 2034
Figure 116: Western Europe Market Value (US$ Million) Analysis by Test Type, 2019 to 2034
Figure 117: Western Europe Market Value Share (%) and BPS Analysis by Test Type, 2024 to 2034
Figure 118: Western Europe Market Y-o-Y Growth (%) Projections by Test Type, 2024 to 2034
Figure 119: Western Europe Market Value (US$ Million) Analysis by Service Type, 2019 to 2034
Figure 120: Western Europe Market Value Share (%) and BPS Analysis by Service Type, 2024 to 2034
Figure 121: Western Europe Market Y-o-Y Growth (%) Projections by Service Type, 2024 to 2034
Figure 122: Western Europe Market Value (US$ Million) Analysis by Method Type, 2019 to 2034
Figure 123: Western Europe Market Value Share (%) and BPS Analysis by Method Type, 2024 to 2034
Figure 124: Western Europe Market Y-o-Y Growth (%) Projections by Method Type, 2024 to 2034
Figure 125: Western Europe Market Value (US$ Million) Analysis by Application, 2019 to 2034
Figure 126: Western Europe Market Value Share (%) and BPS Analysis by Application, 2024 to 2034
Figure 127: Western Europe Market Y-o-Y Growth (%) Projections by Application, 2024 to 2034
Figure 128: Western Europe Market Value (US$ Million) Analysis by Technology, 2019 to 2034
Figure 129: Western Europe Market Value Share (%) and BPS Analysis by Technology, 2024 to 2034
Figure 130: Western Europe Market Y-o-Y Growth (%) Projections by Technology, 2024 to 2034
Figure 131: Western Europe Market Value (US$ Million) Analysis by End-User, 2019 to 2034
Figure 132: Western Europe Market Value Share (%) and BPS Analysis by End-User, 2024 to 2034
Figure 133: Western Europe Market Y-o-Y Growth (%) Projections by End-User, 2024 to 2034
Figure 134: Western Europe Market Attractiveness by Test Type, 2024 to 2034
Figure 135: Western Europe Market Attractiveness by Service Type, 2024 to 2034
Figure 136: Western Europe Market Attractiveness by Method Type, 2024 to 2034
Figure 137: Western Europe Market Attractiveness by Application, 2024 to 2034
Figure 138: Western Europe Market Attractiveness by Technology, 2024 to 2034
Figure 139: Western Europe Market Attractiveness by End-User, 2024 to 2034
Figure 140: Western Europe Market Attractiveness by Country, 2024 to 2034
Figure 141: Eastern Europe Market Value (US$ Million) by Test Type, 2024 to 2034
Figure 142: Eastern Europe Market Value (US$ Million) by Service Type, 2024 to 2034
Figure 143: Eastern Europe Market Value (US$ Million) by Method Type, 2024 to 2034
Figure 144: Eastern Europe Market Value (US$ Million) by Application, 2024 to 2034
Figure 145: Eastern Europe Market Value (US$ Million) by Technology, 2024 to 2034
Figure 146: Eastern Europe Market Value (US$ Million) by End-User, 2024 to 2034
Figure 147: Eastern Europe Market Value (US$ Million) by Country, 2024 to 2034
Figure 148: Eastern Europe Market Value (US$ Million) Analysis by Country, 2019 to 2034
Figure 149: Eastern Europe Market Value Share (%) and BPS Analysis by Country, 2024 to 2034
Figure 150: Eastern Europe Market Y-o-Y Growth (%) Projections by Country, 2024 to 2034
Figure 151: Eastern Europe Market Value (US$ Million) Analysis by Test Type, 2019 to 2034
Figure 152: Eastern Europe Market Value Share (%) and BPS Analysis by Test Type, 2024 to 2034
Figure 153: Eastern Europe Market Y-o-Y Growth (%) Projections by Test Type, 2024 to 2034
Figure 154: Eastern Europe Market Value (US$ Million) Analysis by Service Type, 2019 to 2034
Figure 155: Eastern Europe Market Value Share (%) and BPS Analysis by Service Type, 2024 to 2034
Figure 156: Eastern Europe Market Y-o-Y Growth (%) Projections by Service Type, 2024 to 2034
Figure 157: Eastern Europe Market Value (US$ Million) Analysis by Method Type, 2019 to 2034
Figure 158: Eastern Europe Market Value Share (%) and BPS Analysis by Method Type, 2024 to 2034
Figure 159: Eastern Europe Market Y-o-Y Growth (%) Projections by Method Type, 2024 to 2034
Figure 160: Eastern Europe Market Value (US$ Million) Analysis by Application, 2019 to 2034
Figure 161: Eastern Europe Market Value Share (%) and BPS Analysis by Application, 2024 to 2034
Figure 162: Eastern Europe Market Y-o-Y Growth (%) Projections by Application, 2024 to 2034
Figure 163: Eastern Europe Market Value (US$ Million) Analysis by Technology, 2019 to 2034
Figure 164: Eastern Europe Market Value Share (%) and BPS Analysis by Technology, 2024 to 2034
Figure 165: Eastern Europe Market Y-o-Y Growth (%) Projections by Technology, 2024 to 2034
Figure 166: Eastern Europe Market Value (US$ Million) Analysis by End-User, 2019 to 2034
Figure 167: Eastern Europe Market Value Share (%) and BPS Analysis by End-User, 2024 to 2034
Figure 168: Eastern Europe Market Y-o-Y Growth (%) Projections by End-User, 2024 to 2034
Figure 169: Eastern Europe Market Attractiveness by Test Type, 2024 to 2034
Figure 170: Eastern Europe Market Attractiveness by Service Type, 2024 to 2034
Figure 171: Eastern Europe Market Attractiveness by Method Type, 2024 to 2034
Figure 172: Eastern Europe Market Attractiveness by Application, 2024 to 2034
Figure 173: Eastern Europe Market Attractiveness by Technology, 2024 to 2034
Figure 174: Eastern Europe Market Attractiveness by End-User, 2024 to 2034
Figure 175: Eastern Europe Market Attractiveness by Country, 2024 to 2034
Figure 176: South Asia and Pacific Market Value (US$ Million) by Test Type, 2024 to 2034
Figure 177: South Asia and Pacific Market Value (US$ Million) by Service Type, 2024 to 2034
Figure 178: South Asia and Pacific Market Value (US$ Million) by Method Type, 2024 to 2034
Figure 179: South Asia and Pacific Market Value (US$ Million) by Application, 2024 to 2034
Figure 180: South Asia and Pacific Market Value (US$ Million) by Technology, 2024 to 2034
Figure 181: South Asia and Pacific Market Value (US$ Million) by End-User, 2024 to 2034
Figure 182: South Asia and Pacific Market Value (US$ Million) by Country, 2024 to 2034
Figure 183: South Asia and Pacific Market Value (US$ Million) Analysis by Country, 2019 to 2034
Figure 184: South Asia and Pacific Market Value Share (%) and BPS Analysis by Country, 2024 to 2034
Figure 185: South Asia and Pacific Market Y-o-Y Growth (%) Projections by Country, 2024 to 2034
Figure 186: South Asia and Pacific Market Value (US$ Million) Analysis by Test Type, 2019 to 2034
Figure 187: South Asia and Pacific Market Value Share (%) and BPS Analysis by Test Type, 2024 to 2034
Figure 188: South Asia and Pacific Market Y-o-Y Growth (%) Projections by Test Type, 2024 to 2034
Figure 189: South Asia and Pacific Market Value (US$ Million) Analysis by Service Type, 2019 to 2034
Figure 190: South Asia and Pacific Market Value Share (%) and BPS Analysis by Service Type, 2024 to 2034
Figure 191: South Asia and Pacific Market Y-o-Y Growth (%) Projections by Service Type, 2024 to 2034
Figure 192: South Asia and Pacific Market Value (US$ Million) Analysis by Method Type, 2019 to 2034
Figure 193: South Asia and Pacific Market Value Share (%) and BPS Analysis by Method Type, 2024 to 2034
Figure 194: South Asia and Pacific Market Y-o-Y Growth (%) Projections by Method Type, 2024 to 2034
Figure 195: South Asia and Pacific Market Value (US$ Million) Analysis by Application, 2019 to 2034
Figure 196: South Asia and Pacific Market Value Share (%) and BPS Analysis by Application, 2024 to 2034
Figure 197: South Asia and Pacific Market Y-o-Y Growth (%) Projections by Application, 2024 to 2034
Figure 198: South Asia and Pacific Market Value (US$ Million) Analysis by Technology, 2019 to 2034
Figure 199: South Asia and Pacific Market Value Share (%) and BPS Analysis by Technology, 2024 to 2034
Figure 200: South Asia and Pacific Market Y-o-Y Growth (%) Projections by Technology, 2024 to 2034
Figure 201: South Asia and Pacific Market Value (US$ Million) Analysis by End-User, 2019 to 2034
Figure 202: South Asia and Pacific Market Value Share (%) and BPS Analysis by End-User, 2024 to 2034
Figure 203: South Asia and Pacific Market Y-o-Y Growth (%) Projections by End-User, 2024 to 2034
Figure 204: South Asia and Pacific Market Attractiveness by Test Type, 2024 to 2034
Figure 205: South Asia and Pacific Market Attractiveness by Service Type, 2024 to 2034
Figure 206: South Asia and Pacific Market Attractiveness by Method Type, 2024 to 2034
Figure 207: South Asia and Pacific Market Attractiveness by Application, 2024 to 2034
Figure 208: South Asia and Pacific Market Attractiveness by Technology, 2024 to 2034
Figure 209: South Asia and Pacific Market Attractiveness by End-User, 2024 to 2034
Figure 210: South Asia and Pacific Market Attractiveness by Country, 2024 to 2034
Figure 211: East Asia Market Value (US$ Million) by Test Type, 2024 to 2034
Figure 212: East Asia Market Value (US$ Million) by Service Type, 2024 to 2034
Figure 213: East Asia Market Value (US$ Million) by Method Type, 2024 to 2034
Figure 214: East Asia Market Value (US$ Million) by Application, 2024 to 2034
Figure 215: East Asia Market Value (US$ Million) by Technology, 2024 to 2034
Figure 216: East Asia Market Value (US$ Million) by End-User, 2024 to 2034
Figure 217: East Asia Market Value (US$ Million) by Country, 2024 to 2034
Figure 218: East Asia Market Value (US$ Million) Analysis by Country, 2019 to 2034
Figure 219: East Asia Market Value Share (%) and BPS Analysis by Country, 2024 to 2034
Figure 220: East Asia Market Y-o-Y Growth (%) Projections by Country, 2024 to 2034
Figure 221: East Asia Market Value (US$ Million) Analysis by Test Type, 2019 to 2034
Figure 222: East Asia Market Value Share (%) and BPS Analysis by Test Type, 2024 to 2034
Figure 223: East Asia Market Y-o-Y Growth (%) Projections by Test Type, 2024 to 2034
Figure 224: East Asia Market Value (US$ Million) Analysis by Service Type, 2019 to 2034
Figure 225: East Asia Market Value Share (%) and BPS Analysis by Service Type, 2024 to 2034
Figure 226: East Asia Market Y-o-Y Growth (%) Projections by Service Type, 2024 to 2034
Figure 227: East Asia Market Value (US$ Million) Analysis by Method Type, 2019 to 2034
Figure 228: East Asia Market Value Share (%) and BPS Analysis by Method Type, 2024 to 2034
Figure 229: East Asia Market Y-o-Y Growth (%) Projections by Method Type, 2024 to 2034
Figure 230: East Asia Market Value (US$ Million) Analysis by Application, 2019 to 2034
Figure 231: East Asia Market Value Share (%) and BPS Analysis by Application, 2024 to 2034
Figure 232: East Asia Market Y-o-Y Growth (%) Projections by Application, 2024 to 2034
Figure 233: East Asia Market Value (US$ Million) Analysis by Technology, 2019 to 2034
Figure 234: East Asia Market Value Share (%) and BPS Analysis by Technology, 2024 to 2034
Figure 235: East Asia Market Y-o-Y Growth (%) Projections by Technology, 2024 to 2034
Figure 236: East Asia Market Value (US$ Million) Analysis by End-User, 2019 to 2034
Figure 237: East Asia Market Value Share (%) and BPS Analysis by End-User, 2024 to 2034
Figure 238: East Asia Market Y-o-Y Growth (%) Projections by End-User, 2024 to 2034
Figure 239: East Asia Market Attractiveness by Test Type, 2024 to 2034
Figure 240: East Asia Market Attractiveness by Service Type, 2024 to 2034
Figure 241: East Asia Market Attractiveness by Method Type, 2024 to 2034
Figure 242: East Asia Market Attractiveness by Application, 2024 to 2034
Figure 243: East Asia Market Attractiveness by Technology, 2024 to 2034
Figure 244: East Asia Market Attractiveness by End-User, 2024 to 2034
Figure 245: East Asia Market Attractiveness by Country, 2024 to 2034
Figure 246: Middle East and Africa Market Value (US$ Million) by Test Type, 2024 to 2034
Figure 247: Middle East and Africa Market Value (US$ Million) by Service Type, 2024 to 2034
Figure 248: Middle East and Africa Market Value (US$ Million) by Method Type, 2024 to 2034
Figure 249: Middle East and Africa Market Value (US$ Million) by Application, 2024 to 2034
Figure 250: Middle East and Africa Market Value (US$ Million) by Technology, 2024 to 2034
Figure 251: Middle East and Africa Market Value (US$ Million) by End-User, 2024 to 2034
Figure 252: Middle East and Africa Market Value (US$ Million) by Country, 2024 to 2034
Figure 253: Middle East and Africa Market Value (US$ Million) Analysis by Country, 2019 to 2034
Figure 254: Middle East and Africa Market Value Share (%) and BPS Analysis by Country, 2024 to 2034
Figure 255: Middle East and Africa Market Y-o-Y Growth (%) Projections by Country, 2024 to 2034
Figure 256: Middle East and Africa Market Value (US$ Million) Analysis by Test Type, 2019 to 2034
Figure 257: Middle East and Africa Market Value Share (%) and BPS Analysis by Test Type, 2024 to 2034
Figure 258: Middle East and Africa Market Y-o-Y Growth (%) Projections by Test Type, 2024 to 2034
Figure 259: Middle East and Africa Market Value (US$ Million) Analysis by Service Type, 2019 to 2034
Figure 260: Middle East and Africa Market Value Share (%) and BPS Analysis by Service Type, 2024 to 2034
Figure 261: Middle East and Africa Market Y-o-Y Growth (%) Projections by Service Type, 2024 to 2034
Figure 262: Middle East and Africa Market Value (US$ Million) Analysis by Method Type, 2019 to 2034
Figure 263: Middle East and Africa Market Value Share (%) and BPS Analysis by Method Type, 2024 to 2034
Figure 264: Middle East and Africa Market Y-o-Y Growth (%) Projections by Method Type, 2024 to 2034
Figure 265: Middle East and Africa Market Value (US$ Million) Analysis by Application, 2019 to 2034
Figure 266: Middle East and Africa Market Value Share (%) and BPS Analysis by Application, 2024 to 2034
Figure 267: Middle East and Africa Market Y-o-Y Growth (%) Projections by Application, 2024 to 2034
Figure 268: Middle East and Africa Market Value (US$ Million) Analysis by Technology, 2019 to 2034
Figure 269: Middle East and Africa Market Value Share (%) and BPS Analysis by Technology, 2024 to 2034
Figure 270: Middle East and Africa Market Y-o-Y Growth (%) Projections by Technology, 2024 to 2034
Figure 271: Middle East and Africa Market Value (US$ Million) Analysis by End-User, 2019 to 2034
Figure 272: Middle East and Africa Market Value Share (%) and BPS Analysis by End-User, 2024 to 2034
Figure 273: Middle East and Africa Market Y-o-Y Growth (%) Projections by End-User, 2024 to 2034
Figure 274: Middle East and Africa Market Attractiveness by Test Type, 2024 to 2034
Figure 275: Middle East and Africa Market Attractiveness by Service Type, 2024 to 2034
Figure 276: Middle East and Africa Market Attractiveness by Method Type, 2024 to 2034
Figure 277: Middle East and Africa Market Attractiveness by Application, 2024 to 2034
Figure 278: Middle East and Africa Market Attractiveness by Technology, 2024 to 2034
Figure 279: Middle East and Africa Market Attractiveness by End-User, 2024 to 2034
Figure 280: Middle East and Africa Market Attractiveness by Country, 2024 to 2034
The global analytical laboratory service market is valued at USD 472.6 million in 2024.
The analytical laboratory service market size is estimated to increase at an 11.3% CAGR through 2034.
The analytical laboratory service market is anticipated to be worth USD 1,375.0 million by 2034.
Bioanalytical testing witnesses high demand in the industry.
The analytical laboratory service market in South Korea is predicted to rise at a 13.1% CAGR through 2034.
Explore Similar Insights
Thank you!
You will receive an email from our Business Development Manager. Please be sure to check your SPAM/JUNK folder too.