Laboratory Shakers Market Size and Share Forecast Outlook 2025 to 2035

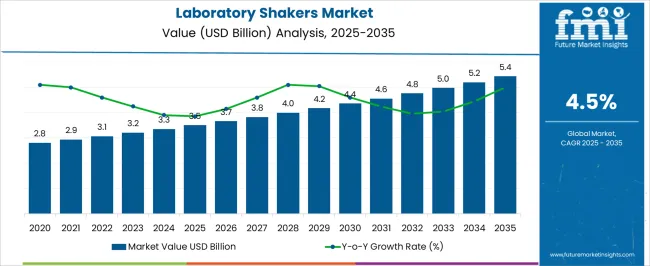
The Laboratory Shakers Market is estimated to be valued at USD 3.5 billion in 2025 and is projected to reach USD 5.4 billion by 2035, registering a compound annual growth rate (CAGR) of 4.5% over the forecast period.
Quick Stats for Laboratory Shakers Market

  • Laboratory Shakers Market Value (2025): USD 3.5 billion
  • Laboratory Shakers Market Forecast Value (2035): USD 5.4 billion
  • Laboratory Shakers Market Forecast CAGR: 4.5%
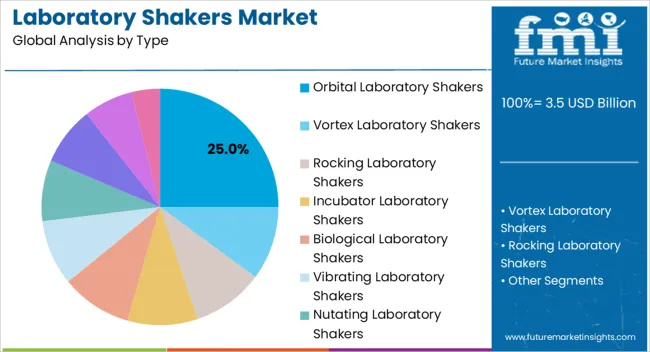
  • Leading Segment in Laboratory Shakers Market in 2025: Orbital Laboratory Shakers (25.0%)
  • Key Growth Regions in Laboratory Shakers Market: North America, Asia-Pacific, Europe
  • Top Key Players in Laboratory Shakers Market: Thermo Fisher Scientific Inc., Eppendorf AG, IKA Works, Inc., Benchmark Scientific Inc., Corning Incorporated, Heidolph Instruments GmbH & Co. KG, Sartorius AG, Labnet International Inc.

Laboratory Shakers Market Market Value Analysis

Laboratory Shakers Market Key Takeaways

Metric Value
Laboratory Shakers Market Estimated Value in (2025 E) USD 3.5 billion
Laboratory Shakers Market Forecast Value in (2035 F) USD 5.4 billion
Forecast CAGR (2025 to 2035) 4.5%

Why is the Laboratory Shakers Market Growing?

The Laboratory Shakers market is experiencing steady growth due to the rising demand for automated and precise mixing equipment across research laboratories, pharmaceutical development, and biotechnology sectors. The market is being shaped by increasing investments in laboratory infrastructure, the expansion of research activities, and the growing need for reproducible and efficient sample handling.

Technological advancements in shaker designs, including programmable operation and enhanced motion control, are enabling improved experiment accuracy and throughput. The ability to support multiple applications such as cell culture, chemical dissolution, and molecular biology experiments is driving adoption.

Additionally, regulatory emphasis on laboratory safety and process standardization has increased the preference for reliable and certified shaking equipment As laboratory processes continue to become more complex and time-sensitive, shakers that provide consistent motion, precise control, and adaptability are expected to remain in high demand, offering opportunities for market expansion and product differentiation.

Segmental Analysis

The laboratory shakers market is segmented by type, operation, motion of direction, end use, and geographic regions. By type, laboratory shakers market is divided into Orbital Laboratory Shakers, Vortex Laboratory Shakers, Rocking Laboratory Shakers, Incubator Laboratory Shakers, Biological Laboratory Shakers, Vibrating Laboratory Shakers, Nutating Laboratory Shakers, Reciprocating Laboratory Shakers, Sieve Laboratory Shakers, and Miscellaneous Laboratory Shakers. In terms of operation, laboratory shakers market is classified into Open Air Shaker, Enclosed (Incubating) Shaker, Stacked Shaker, and Water – Bath Shaker. Based on motion of direction, laboratory shakers market is segmented into Reciprocating Linear Motion, Orbiting Motion, and Dual Motion. By end use, laboratory shakers market is segmented into Commercial & Institutional Laboratories and Industrial Laboratories. Regionally, the laboratory shakers industry is classified into North America, Latin America, Western Europe, Eastern Europe, Balkan & Baltic Countries, Russia & Belarus, Central Asia, East Asia, South Asia & Pacific, and the Middle East & Africa.
Insights into the Orbital Laboratory Shakers Segment

Laboratory Shakers Market Analysis By Type

The Orbital Laboratory Shakers type is projected to hold 25.00% of the Laboratory Shakers market revenue share in 2025, making it a leading product type. This dominance is attributed to its ability to provide uniform mixing and agitation across a range of laboratory samples. The orbital motion ensures gentle but thorough mixing, which is especially important for sensitive biological and chemical samples.

Adoption has been accelerated in applications requiring consistent reproducibility, as well as in laboratories seeking low maintenance and long-lasting equipment. The segment’s growth is being reinforced by its compatibility with multi-platform trays and the capacity to support various vessel sizes, enhancing operational efficiency.

Additionally, the precision control and stability offered by orbital shakers have encouraged their integration into automated workflows, reducing manual intervention and improving overall laboratory productivity The flexibility and reliability of these shakers make them highly preferred across research and commercial laboratory environments.
Insights into the Open Air Shaker Segment

Laboratory Shakers Market Analysis By Operation

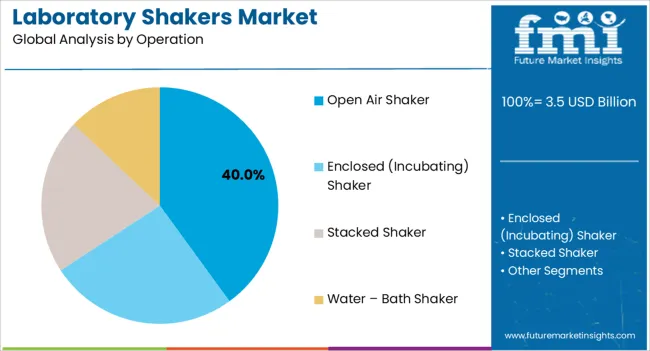
The Open Air Shaker operation segment is expected to account for 40.00% of the Laboratory Shakers market revenue in 2025, positioning it as the largest operational category. Its leading position is being driven by the ability to provide direct airflow and heat dissipation, which improves sample stability during agitation. Open air shakers are widely adopted in applications that require rapid drying, aeration, or precise temperature control.

The segment’s growth has been reinforced by the growing emphasis on high-throughput laboratory operations and process efficiency. Laboratories favor these shakers for their ease of maintenance, low operational complexity, and compatibility with a variety of laboratory vessels.

Additionally, open air designs allow for simple cleaning and reduced contamination risk, which is essential in pharmaceutical and biotechnological laboratories The continued demand for reliable, scalable, and versatile shakers is expected to further support the expansion of this operational segment.
Insights into the Reciprocating Linear Motion Segment

Laboratory Shakers Market Analysis By Motion Of Direction

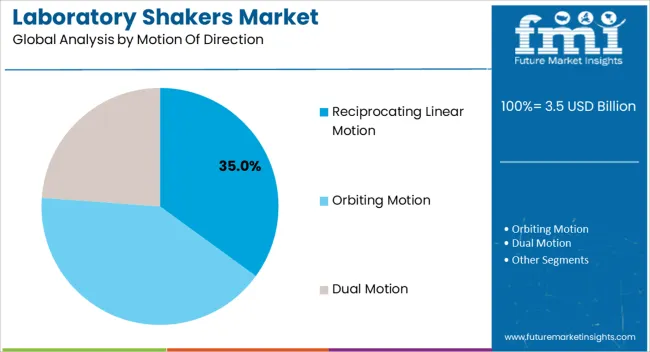
The Reciprocating Linear Motion segment is anticipated to hold 35.00% of the Laboratory Shakers market revenue in 2025, highlighting its significant adoption in laboratories. This motion type is preferred for applications requiring high agitation intensity and rapid sample mixing, including chemical dissolution, sample homogenization, and suspension of particulate matter. Growth in this segment is being driven by the consistent performance delivered across a variety of sample sizes and viscosities.

Reciprocating linear motion shakers are valued for their ability to maintain uniform motion and reduce variability in experimental outcomes. Their design supports modular tray configurations and easy scalability, which enhances laboratory efficiency.

Furthermore, the simplicity of operation, durability, and low maintenance requirements have encouraged their widespread deployment across research, pharmaceutical, and industrial laboratories The segment’s adaptability and operational precision are expected to continue driving its market leadership.

Market Overview

Laboratory Shakers Market: Global Industry Analysis 2025 - 2025 and Opportunity Assessment; 2025 - 2035 Overview

Laboratory shakers are the instruments used in institutional, industrial and independent R&D laboratories that assist in the formation of a homogenous mixture of more than one components. In common practice, laboratory shakers are confused with laboratory mixers which are technically distinguished on the basis of the type of flow created inside the flask, test tube or vial placed inside the equipment.

While the laboratory shakers create a laminar flow to maintain uniformity in the mixture due to the uniform motion of the underlying platform, laboratory mixers have a tool such as a blade or paddle dipped inside the sample and agitating it mechanically, creating turbulence in the solution.

There has been extensive innovation pertaining to the laboratory equipments and as a result, there are several types of laboratory shakers available in the market. The growing interest of designers towards venturing in the untapped markets lead to product innovation and also assist the market players in product differentiation.
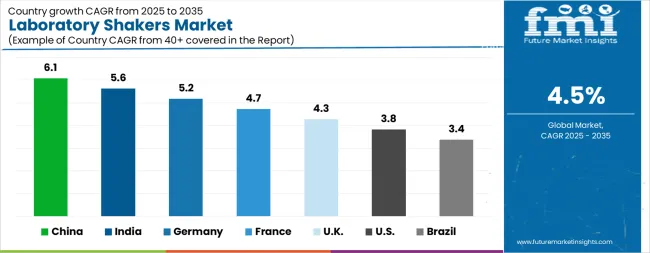
Analysis of Laboratory Shakers Market By Key Countries

Laboratory Shakers Market Cagr Analysis By Country

Country CAGR
China 6.1%
India 5.6%
Germany 5.2%
France 4.7%
UK 4.3%
USA 3.8%
Brazil 3.4%

Country-wise Analysis

The Laboratory Shakers Market is expected to register a CAGR of 4.5% during the forecast period, exhibiting varied country level momentum. China leads with the highest CAGR of 6.1%, followed by India at 5.6%. Developed markets such as Germany, France, and the UK continue to expand steadily, while the USA is likely to grow at consistent rates. Brazil posts the lowest CAGR at 3.4%, yet still underscores a broadly positive trajectory for the global Laboratory Shakers Market. In 2024, Germany held a dominant revenue in the Western Europe market and is expected to grow with a CAGR of 5.2%. The USA Laboratory Shakers Market is estimated to be valued at USD 1.3 billion in 2025 and is anticipated to reach a valuation of USD 1.9 billion by 2035. Sales are projected to rise at a CAGR of 3.8% over the forecast period between 2025 and 2035. While Japan and South Korea markets are estimated to be valued at USD 169.2 million and USD 88.4 million respectively in 2025.
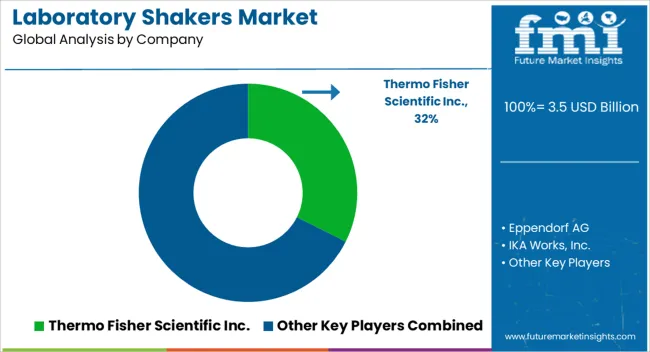
Key Players in the Laboratory Shakers Market

Laboratory Shakers Market Analysis By Company

  • Thermo Fisher Scientific Inc.
  • Eppendorf AG
  • IKA Works, Inc.
  • Benchmark Scientific Inc.
  • Corning Incorporated
  • Heidolph Instruments GmbH & Co. KG
  • Sartorius AG
  • Labnet International Inc.

Scope of the Report

Item Value
Quantitative Units USD 3.5 Billion
Type Orbital Laboratory Shakers, Vortex Laboratory Shakers, Rocking Laboratory Shakers, Incubator Laboratory Shakers, Biological Laboratory Shakers, Vibrating Laboratory Shakers, Nutating Laboratory Shakers, Reciprocating Laboratory Shakers, Sieve Laboratory Shakers, and Miscellaneous Laboratory Shakers
Operation Open Air Shaker, Enclosed (Incubating) Shaker, Stacked Shaker, and Water – Bath Shaker
Motion Of Direction Reciprocating Linear Motion, Orbiting Motion, and Dual Motion
End Use Commercial & Institutional Laboratories and Industrial Laboratories
Regions Covered North America, Europe, Asia-Pacific, Latin America, Middle East & Africa
Country Covered United States, Canada, Germany, France, United Kingdom, China, Japan, India, Brazil, South Africa
Key Companies Profiled Thermo Fisher Scientific Inc., Eppendorf AG, IKA Works, Inc., Benchmark Scientific Inc., Corning Incorporated, Heidolph Instruments GmbH & Co. KG, Sartorius AG, and Labnet International Inc.

Laboratory Shakers Market by Segments

Type:

  • Orbital Laboratory Shakers
  • Vortex Laboratory Shakers
  • Rocking Laboratory Shakers
  • Incubator Laboratory Shakers
  • Biological Laboratory Shakers
  • Vibrating Laboratory Shakers
  • Nutating Laboratory Shakers
  • Reciprocating Laboratory Shakers
  • Sieve Laboratory Shakers
  • Miscellaneous Laboratory Shakers

Operation:

  • Open Air Shaker
  • Enclosed (Incubating) Shaker
  • Stacked Shaker
  • Water – Bath Shaker

Motion Of Direction:

  • Reciprocating Linear Motion
  • Orbiting Motion
  • Dual Motion

End Use:

  • Commercial & Institutional Laboratories
  • Industrial Laboratories

Region:

  • North America
    • USA
    • Canada
    • Mexico
  • Latin America
    • Brazil
    • Chile
    • Rest of Latin America
  • Western Europe
    • Germany
    • UK
    • Italy
    • Spain
    • France
    • Nordic
    • BENELUX
    • Rest of Western Europe
  • Eastern Europe
    • Russia
    • Poland
    • Hungary
    • Balkan & Baltic
    • Rest of Eastern Europe
  • East Asia
    • China
    • Japan
    • South Korea
  • South Asia and Pacific
    • India
    • ASEAN
    • Australia & New Zealand
    • Rest of South Asia and Pacific
  • Middle East & Africa
    • Kingdom of Saudi Arabia
    • Other GCC Countries
    • Turkiye
    • South Africa
    • Other African Union
    • Rest of Middle East & Africa

Table of Content

  1. Executive Summary
    • Global Market Outlook
    • Demand-side Trends
    • Supply-side Trends
    • Technology Roadmap Analysis
    • Analysis and Recommendations
  2. Market Overview
    • Market Coverage / Taxonomy
    • Market Definition / Scope / Limitations
  3. Market Background
    • Market Dynamics
      • Drivers
      • Restraints
      • Opportunity
      • Trends
    • Scenario Forecast
      • Demand in Optimistic Scenario
      • Demand in Likely Scenario
      • Demand in Conservative Scenario
    • Opportunity Map Analysis
    • Product Life Cycle Analysis
    • Supply Chain Analysis
    • Investment Feasibility Matrix
    • Value Chain Analysis
    • PESTLE and Porter’s Analysis
    • Regulatory Landscape
    • Regional Parent Market Outlook
    • Production and Consumption Statistics
    • Import and Export Statistics
  4. Global Market Analysis 2020 to 2024 and Forecast, 2025 to 2035
    • Historical Market Size Value (USD Million) Analysis, 2020 to 2024
    • Current and Future Market Size Value (USD Million) Projections, 2025 to 2035
      • Y-o-Y Growth Trend Analysis
      • Absolute $ Opportunity Analysis
  5. Global Market Pricing Analysis 2020 to 2024 and Forecast 2025 to 2035
  6. Global Market Analysis 2020 to 2024 and Forecast 2025 to 2035, By Type
    • Introduction / Key Findings
    • Historical Market Size Value (USD Million) Analysis By Type , 2020 to 2024
    • Current and Future Market Size Value (USD Million) Analysis and Forecast By Type , 2025 to 2035
      • Orbital Laboratory Shakers
      • Vortex Laboratory Shakers
      • Rocking Laboratory Shakers
      • Incubator Laboratory Shakers
      • Biological Laboratory Shakers
      • Vibrating Laboratory Shakers
      • Nutating Laboratory Shakers
      • Reciprocating Laboratory Shakers
      • Sieve Laboratory Shakers
      • Miscellaneous Laboratory Shakers
    • Y-o-Y Growth Trend Analysis By Type , 2020 to 2024
    • Absolute $ Opportunity Analysis By Type , 2025 to 2035
  7. Global Market Analysis 2020 to 2024 and Forecast 2025 to 2035, By Operation
    • Introduction / Key Findings
    • Historical Market Size Value (USD Million) Analysis By Operation, 2020 to 2024
    • Current and Future Market Size Value (USD Million) Analysis and Forecast By Operation, 2025 to 2035
      • Open Air Shaker
      • Enclosed (Incubating) Shaker
      • Stacked Shaker
      • Water – Bath Shaker
    • Y-o-Y Growth Trend Analysis By Operation, 2020 to 2024
    • Absolute $ Opportunity Analysis By Operation, 2025 to 2035
  8. Global Market Analysis 2020 to 2024 and Forecast 2025 to 2035, By Motion Of Direction
    • Introduction / Key Findings
    • Historical Market Size Value (USD Million) Analysis By Motion Of Direction, 2020 to 2024
    • Current and Future Market Size Value (USD Million) Analysis and Forecast By Motion Of Direction, 2025 to 2035
      • Reciprocating Linear Motion
      • Orbiting Motion
      • Dual Motion
    • Y-o-Y Growth Trend Analysis By Motion Of Direction, 2020 to 2024
    • Absolute $ Opportunity Analysis By Motion Of Direction, 2025 to 2035
  9. Global Market Analysis 2020 to 2024 and Forecast 2025 to 2035, By End Use
    • Introduction / Key Findings
    • Historical Market Size Value (USD Million) Analysis By End Use, 2020 to 2024
    • Current and Future Market Size Value (USD Million) Analysis and Forecast By End Use, 2025 to 2035
      • Commercial & Institutional Laboratories
      • Industrial Laboratories
    • Y-o-Y Growth Trend Analysis By End Use, 2020 to 2024
    • Absolute $ Opportunity Analysis By End Use, 2025 to 2035
  10. Global Market Analysis 2020 to 2024 and Forecast 2025 to 2035, By Region
    • Introduction
    • Historical Market Size Value (USD Million) Analysis By Region, 2020 to 2024
    • Current Market Size Value (USD Million) Analysis and Forecast By Region, 2025 to 2035
      • North America
      • Latin America
      • Western Europe
      • Eastern Europe
      • East Asia
      • South Asia and Pacific
      • Middle East & Africa
    • Market Attractiveness Analysis By Region
  11. North America Market Analysis 2020 to 2024 and Forecast 2025 to 2035, By Country
    • Historical Market Size Value (USD Million) Trend Analysis By Market Taxonomy, 2020 to 2024
    • Market Size Value (USD Million) Forecast By Market Taxonomy, 2025 to 2035
      • By Country
        • USA
        • Canada
        • Mexico
      • By Type
      • By Operation
      • By Motion Of Direction
      • By End Use
    • Market Attractiveness Analysis
      • By Country
      • By Type
      • By Operation
      • By Motion Of Direction
      • By End Use
    • Key Takeaways
  12. Latin America Market Analysis 2020 to 2024 and Forecast 2025 to 2035, By Country
    • Historical Market Size Value (USD Million) Trend Analysis By Market Taxonomy, 2020 to 2024
    • Market Size Value (USD Million) Forecast By Market Taxonomy, 2025 to 2035
      • By Country
        • Brazil
        • Chile
        • Rest of Latin America
      • By Type
      • By Operation
      • By Motion Of Direction
      • By End Use
    • Market Attractiveness Analysis
      • By Country
      • By Type
      • By Operation
      • By Motion Of Direction
      • By End Use
    • Key Takeaways
  13. Western Europe Market Analysis 2020 to 2024 and Forecast 2025 to 2035, By Country
    • Historical Market Size Value (USD Million) Trend Analysis By Market Taxonomy, 2020 to 2024
    • Market Size Value (USD Million) Forecast By Market Taxonomy, 2025 to 2035
      • By Country
        • Germany
        • UK
        • Italy
        • Spain
        • France
        • Nordic
        • BENELUX
        • Rest of Western Europe
      • By Type
      • By Operation
      • By Motion Of Direction
      • By End Use
    • Market Attractiveness Analysis
      • By Country
      • By Type
      • By Operation
      • By Motion Of Direction
      • By End Use
    • Key Takeaways
  14. Eastern Europe Market Analysis 2020 to 2024 and Forecast 2025 to 2035, By Country
    • Historical Market Size Value (USD Million) Trend Analysis By Market Taxonomy, 2020 to 2024
    • Market Size Value (USD Million) Forecast By Market Taxonomy, 2025 to 2035
      • By Country
        • Russia
        • Poland
        • Hungary
        • Balkan & Baltic
        • Rest of Eastern Europe
      • By Type
      • By Operation
      • By Motion Of Direction
      • By End Use
    • Market Attractiveness Analysis
      • By Country
      • By Type
      • By Operation
      • By Motion Of Direction
      • By End Use
    • Key Takeaways
  15. East Asia Market Analysis 2020 to 2024 and Forecast 2025 to 2035, By Country
    • Historical Market Size Value (USD Million) Trend Analysis By Market Taxonomy, 2020 to 2024
    • Market Size Value (USD Million) Forecast By Market Taxonomy, 2025 to 2035
      • By Country
        • China
        • Japan
        • South Korea
      • By Type
      • By Operation
      • By Motion Of Direction
      • By End Use
    • Market Attractiveness Analysis
      • By Country
      • By Type
      • By Operation
      • By Motion Of Direction
      • By End Use
    • Key Takeaways
  16. South Asia and Pacific Market Analysis 2020 to 2024 and Forecast 2025 to 2035, By Country
    • Historical Market Size Value (USD Million) Trend Analysis By Market Taxonomy, 2020 to 2024
    • Market Size Value (USD Million) Forecast By Market Taxonomy, 2025 to 2035
      • By Country
        • India
        • ASEAN
        • Australia & New Zealand
        • Rest of South Asia and Pacific
      • By Type
      • By Operation
      • By Motion Of Direction
      • By End Use
    • Market Attractiveness Analysis
      • By Country
      • By Type
      • By Operation
      • By Motion Of Direction
      • By End Use
    • Key Takeaways
  17. Middle East & Africa Market Analysis 2020 to 2024 and Forecast 2025 to 2035, By Country
    • Historical Market Size Value (USD Million) Trend Analysis By Market Taxonomy, 2020 to 2024
    • Market Size Value (USD Million) Forecast By Market Taxonomy, 2025 to 2035
      • By Country
        • Kingdom of Saudi Arabia
        • Other GCC Countries
        • Turkiye
        • South Africa
        • Other African Union
        • Rest of Middle East & Africa
      • By Type
      • By Operation
      • By Motion Of Direction
      • By End Use
    • Market Attractiveness Analysis
      • By Country
      • By Type
      • By Operation
      • By Motion Of Direction
      • By End Use
    • Key Takeaways
  18. Key Countries Market Analysis
    • USA
      • Pricing Analysis
      • Market Share Analysis, 2024
        • By Type
        • By Operation
        • By Motion Of Direction
        • By End Use
    • Canada
      • Pricing Analysis
      • Market Share Analysis, 2024
        • By Type
        • By Operation
        • By Motion Of Direction
        • By End Use
    • Mexico
      • Pricing Analysis
      • Market Share Analysis, 2024
        • By Type
        • By Operation
        • By Motion Of Direction
        • By End Use
    • Brazil
      • Pricing Analysis
      • Market Share Analysis, 2024
        • By Type
        • By Operation
        • By Motion Of Direction
        • By End Use
    • Chile
      • Pricing Analysis
      • Market Share Analysis, 2024
        • By Type
        • By Operation
        • By Motion Of Direction
        • By End Use
    • Germany
      • Pricing Analysis
      • Market Share Analysis, 2024
        • By Type
        • By Operation
        • By Motion Of Direction
        • By End Use
    • UK
      • Pricing Analysis
      • Market Share Analysis, 2024
        • By Type
        • By Operation
        • By Motion Of Direction
        • By End Use
    • Italy
      • Pricing Analysis
      • Market Share Analysis, 2024
        • By Type
        • By Operation
        • By Motion Of Direction
        • By End Use
    • Spain
      • Pricing Analysis
      • Market Share Analysis, 2024
        • By Type
        • By Operation
        • By Motion Of Direction
        • By End Use
    • France
      • Pricing Analysis
      • Market Share Analysis, 2024
        • By Type
        • By Operation
        • By Motion Of Direction
        • By End Use
    • India
      • Pricing Analysis
      • Market Share Analysis, 2024
        • By Type
        • By Operation
        • By Motion Of Direction
        • By End Use
    • ASEAN
      • Pricing Analysis
      • Market Share Analysis, 2024
        • By Type
        • By Operation
        • By Motion Of Direction
        • By End Use
    • Australia & New Zealand
      • Pricing Analysis
      • Market Share Analysis, 2024
        • By Type
        • By Operation
        • By Motion Of Direction
        • By End Use
    • China
      • Pricing Analysis
      • Market Share Analysis, 2024
        • By Type
        • By Operation
        • By Motion Of Direction
        • By End Use
    • Japan
      • Pricing Analysis
      • Market Share Analysis, 2024
        • By Type
        • By Operation
        • By Motion Of Direction
        • By End Use
    • South Korea
      • Pricing Analysis
      • Market Share Analysis, 2024
        • By Type
        • By Operation
        • By Motion Of Direction
        • By End Use
    • Russia
      • Pricing Analysis
      • Market Share Analysis, 2024
        • By Type
        • By Operation
        • By Motion Of Direction
        • By End Use
    • Poland
      • Pricing Analysis
      • Market Share Analysis, 2024
        • By Type
        • By Operation
        • By Motion Of Direction
        • By End Use
    • Hungary
      • Pricing Analysis
      • Market Share Analysis, 2024
        • By Type
        • By Operation
        • By Motion Of Direction
        • By End Use
    • Kingdom of Saudi Arabia
      • Pricing Analysis
      • Market Share Analysis, 2024
        • By Type
        • By Operation
        • By Motion Of Direction
        • By End Use
    • Turkiye
      • Pricing Analysis
      • Market Share Analysis, 2024
        • By Type
        • By Operation
        • By Motion Of Direction
        • By End Use
    • South Africa
      • Pricing Analysis
      • Market Share Analysis, 2024
        • By Type
        • By Operation
        • By Motion Of Direction
        • By End Use
  19. Market Structure Analysis
    • Competition Dashboard
    • Competition Benchmarking
    • Market Share Analysis of Top Players
      • By Regional
      • By Type
      • By Operation
      • By Motion Of Direction
      • By End Use
  20. Competition Analysis
    • Competition Deep Dive
      • Thermo Fisher Scientific Inc.
        • Overview
        • Product Portfolio
        • Profitability by Market Segments (Product/Age /Sales Channel/Region)
        • Sales Footprint
        • Strategy Overview
          • Marketing Strategy
          • Product Strategy
          • Channel Strategy
      • Eppendorf AG
      • IKA Works, Inc.
      • Benchmark Scientific Inc.
      • Corning Incorporated
      • Heidolph Instruments GmbH & Co. KG
      • Sartorius AG
      • Labnet International Inc.
  21. Assumptions & Acronyms Used
  22. Research Methodology

List of Tables

  • Table 1: Global Market Value (USD Million) Forecast by Region, 2020 to 2035
  • Table 2: Global Market Value (USD Million) Forecast by Type , 2020 to 2035
  • Table 3: Global Market Value (USD Million) Forecast by Operation, 2020 to 2035
  • Table 4: Global Market Value (USD Million) Forecast by Motion Of Direction, 2020 to 2035
  • Table 5: Global Market Value (USD Million) Forecast by End Use, 2020 to 2035
  • Table 6: North America Market Value (USD Million) Forecast by Country, 2020 to 2035
  • Table 7: North America Market Value (USD Million) Forecast by Type , 2020 to 2035
  • Table 8: North America Market Value (USD Million) Forecast by Operation, 2020 to 2035
  • Table 9: North America Market Value (USD Million) Forecast by Motion Of Direction, 2020 to 2035
  • Table 10: North America Market Value (USD Million) Forecast by End Use, 2020 to 2035
  • Table 11: Latin America Market Value (USD Million) Forecast by Country, 2020 to 2035
  • Table 12: Latin America Market Value (USD Million) Forecast by Type , 2020 to 2035
  • Table 13: Latin America Market Value (USD Million) Forecast by Operation, 2020 to 2035
  • Table 14: Latin America Market Value (USD Million) Forecast by Motion Of Direction, 2020 to 2035
  • Table 15: Latin America Market Value (USD Million) Forecast by End Use, 2020 to 2035
  • Table 16: Western Europe Market Value (USD Million) Forecast by Country, 2020 to 2035
  • Table 17: Western Europe Market Value (USD Million) Forecast by Type , 2020 to 2035
  • Table 18: Western Europe Market Value (USD Million) Forecast by Operation, 2020 to 2035
  • Table 19: Western Europe Market Value (USD Million) Forecast by Motion Of Direction, 2020 to 2035
  • Table 20: Western Europe Market Value (USD Million) Forecast by End Use, 2020 to 2035
  • Table 21: Eastern Europe Market Value (USD Million) Forecast by Country, 2020 to 2035
  • Table 22: Eastern Europe Market Value (USD Million) Forecast by Type , 2020 to 2035
  • Table 23: Eastern Europe Market Value (USD Million) Forecast by Operation, 2020 to 2035
  • Table 24: Eastern Europe Market Value (USD Million) Forecast by Motion Of Direction, 2020 to 2035
  • Table 25: Eastern Europe Market Value (USD Million) Forecast by End Use, 2020 to 2035
  • Table 26: East Asia Market Value (USD Million) Forecast by Country, 2020 to 2035
  • Table 27: East Asia Market Value (USD Million) Forecast by Type , 2020 to 2035
  • Table 28: East Asia Market Value (USD Million) Forecast by Operation, 2020 to 2035
  • Table 29: East Asia Market Value (USD Million) Forecast by Motion Of Direction, 2020 to 2035
  • Table 30: East Asia Market Value (USD Million) Forecast by End Use, 2020 to 2035
  • Table 31: South Asia and Pacific Market Value (USD Million) Forecast by Country, 2020 to 2035
  • Table 32: South Asia and Pacific Market Value (USD Million) Forecast by Type , 2020 to 2035
  • Table 33: South Asia and Pacific Market Value (USD Million) Forecast by Operation, 2020 to 2035
  • Table 34: South Asia and Pacific Market Value (USD Million) Forecast by Motion Of Direction, 2020 to 2035
  • Table 35: South Asia and Pacific Market Value (USD Million) Forecast by End Use, 2020 to 2035
  • Table 36: Middle East & Africa Market Value (USD Million) Forecast by Country, 2020 to 2035
  • Table 37: Middle East & Africa Market Value (USD Million) Forecast by Type , 2020 to 2035
  • Table 38: Middle East & Africa Market Value (USD Million) Forecast by Operation, 2020 to 2035
  • Table 39: Middle East & Africa Market Value (USD Million) Forecast by Motion Of Direction, 2020 to 2035
  • Table 40: Middle East & Africa Market Value (USD Million) Forecast by End Use, 2020 to 2035

List of Figures

  • Figure 1: Global Market Pricing Analysis
  • Figure 2: Global Market Value (USD Million) Forecast 2020 to 2035
  • Figure 3: Global Market Value Share and BPS Analysis by Type , 2025 and 2035
  • Figure 4: Global Market Y-o-Y Growth Comparison by Type , 2025 to 2035
  • Figure 5: Global Market Attractiveness Analysis by Type
  • Figure 6: Global Market Value Share and BPS Analysis by Operation, 2025 and 2035
  • Figure 7: Global Market Y-o-Y Growth Comparison by Operation, 2025 to 2035
  • Figure 8: Global Market Attractiveness Analysis by Operation
  • Figure 9: Global Market Value Share and BPS Analysis by Motion Of Direction, 2025 and 2035
  • Figure 10: Global Market Y-o-Y Growth Comparison by Motion Of Direction, 2025 to 2035
  • Figure 11: Global Market Attractiveness Analysis by Motion Of Direction
  • Figure 12: Global Market Value Share and BPS Analysis by End Use, 2025 and 2035
  • Figure 13: Global Market Y-o-Y Growth Comparison by End Use, 2025 to 2035
  • Figure 14: Global Market Attractiveness Analysis by End Use
  • Figure 15: Global Market Value (USD Million) Share and BPS Analysis by Region, 2025 and 2035
  • Figure 16: Global Market Y-o-Y Growth Comparison by Region, 2025 to 2035
  • Figure 17: Global Market Attractiveness Analysis by Region
  • Figure 18: North America Market Incremental Dollar Opportunity, 2025 to 2035
  • Figure 19: Latin America Market Incremental Dollar Opportunity, 2025 to 2035
  • Figure 20: Western Europe Market Incremental Dollar Opportunity, 2025 to 2035
  • Figure 21: Eastern Europe Market Incremental Dollar Opportunity, 2025 to 2035
  • Figure 22: East Asia Market Incremental Dollar Opportunity, 2025 to 2035
  • Figure 23: South Asia and Pacific Market Incremental Dollar Opportunity, 2025 to 2035
  • Figure 24: Middle East & Africa Market Incremental Dollar Opportunity, 2025 to 2035
  • Figure 25: North America Market Value Share and BPS Analysis by Country, 2025 and 2035
  • Figure 26: North America Market Value Share and BPS Analysis by Type , 2025 and 2035
  • Figure 27: North America Market Y-o-Y Growth Comparison by Type , 2025 to 2035
  • Figure 28: North America Market Attractiveness Analysis by Type
  • Figure 29: North America Market Value Share and BPS Analysis by Operation, 2025 and 2035
  • Figure 30: North America Market Y-o-Y Growth Comparison by Operation, 2025 to 2035
  • Figure 31: North America Market Attractiveness Analysis by Operation
  • Figure 32: North America Market Value Share and BPS Analysis by Motion Of Direction, 2025 and 2035
  • Figure 33: North America Market Y-o-Y Growth Comparison by Motion Of Direction, 2025 to 2035
  • Figure 34: North America Market Attractiveness Analysis by Motion Of Direction
  • Figure 35: North America Market Value Share and BPS Analysis by End Use, 2025 and 2035
  • Figure 36: North America Market Y-o-Y Growth Comparison by End Use, 2025 to 2035
  • Figure 37: North America Market Attractiveness Analysis by End Use
  • Figure 38: Latin America Market Value Share and BPS Analysis by Country, 2025 and 2035
  • Figure 39: Latin America Market Value Share and BPS Analysis by Type , 2025 and 2035
  • Figure 40: Latin America Market Y-o-Y Growth Comparison by Type , 2025 to 2035
  • Figure 41: Latin America Market Attractiveness Analysis by Type
  • Figure 42: Latin America Market Value Share and BPS Analysis by Operation, 2025 and 2035
  • Figure 43: Latin America Market Y-o-Y Growth Comparison by Operation, 2025 to 2035
  • Figure 44: Latin America Market Attractiveness Analysis by Operation
  • Figure 45: Latin America Market Value Share and BPS Analysis by Motion Of Direction, 2025 and 2035
  • Figure 46: Latin America Market Y-o-Y Growth Comparison by Motion Of Direction, 2025 to 2035
  • Figure 47: Latin America Market Attractiveness Analysis by Motion Of Direction
  • Figure 48: Latin America Market Value Share and BPS Analysis by End Use, 2025 and 2035
  • Figure 49: Latin America Market Y-o-Y Growth Comparison by End Use, 2025 to 2035
  • Figure 50: Latin America Market Attractiveness Analysis by End Use
  • Figure 51: Western Europe Market Value Share and BPS Analysis by Country, 2025 and 2035
  • Figure 52: Western Europe Market Value Share and BPS Analysis by Type , 2025 and 2035
  • Figure 53: Western Europe Market Y-o-Y Growth Comparison by Type , 2025 to 2035
  • Figure 54: Western Europe Market Attractiveness Analysis by Type
  • Figure 55: Western Europe Market Value Share and BPS Analysis by Operation, 2025 and 2035
  • Figure 56: Western Europe Market Y-o-Y Growth Comparison by Operation, 2025 to 2035
  • Figure 57: Western Europe Market Attractiveness Analysis by Operation
  • Figure 58: Western Europe Market Value Share and BPS Analysis by Motion Of Direction, 2025 and 2035
  • Figure 59: Western Europe Market Y-o-Y Growth Comparison by Motion Of Direction, 2025 to 2035
  • Figure 60: Western Europe Market Attractiveness Analysis by Motion Of Direction
  • Figure 61: Western Europe Market Value Share and BPS Analysis by End Use, 2025 and 2035
  • Figure 62: Western Europe Market Y-o-Y Growth Comparison by End Use, 2025 to 2035
  • Figure 63: Western Europe Market Attractiveness Analysis by End Use
  • Figure 64: Eastern Europe Market Value Share and BPS Analysis by Country, 2025 and 2035
  • Figure 65: Eastern Europe Market Value Share and BPS Analysis by Type , 2025 and 2035
  • Figure 66: Eastern Europe Market Y-o-Y Growth Comparison by Type , 2025 to 2035
  • Figure 67: Eastern Europe Market Attractiveness Analysis by Type
  • Figure 68: Eastern Europe Market Value Share and BPS Analysis by Operation, 2025 and 2035
  • Figure 69: Eastern Europe Market Y-o-Y Growth Comparison by Operation, 2025 to 2035
  • Figure 70: Eastern Europe Market Attractiveness Analysis by Operation
  • Figure 71: Eastern Europe Market Value Share and BPS Analysis by Motion Of Direction, 2025 and 2035
  • Figure 72: Eastern Europe Market Y-o-Y Growth Comparison by Motion Of Direction, 2025 to 2035
  • Figure 73: Eastern Europe Market Attractiveness Analysis by Motion Of Direction
  • Figure 74: Eastern Europe Market Value Share and BPS Analysis by End Use, 2025 and 2035
  • Figure 75: Eastern Europe Market Y-o-Y Growth Comparison by End Use, 2025 to 2035
  • Figure 76: Eastern Europe Market Attractiveness Analysis by End Use
  • Figure 77: East Asia Market Value Share and BPS Analysis by Country, 2025 and 2035
  • Figure 78: East Asia Market Value Share and BPS Analysis by Type , 2025 and 2035
  • Figure 79: East Asia Market Y-o-Y Growth Comparison by Type , 2025 to 2035
  • Figure 80: East Asia Market Attractiveness Analysis by Type
  • Figure 81: East Asia Market Value Share and BPS Analysis by Operation, 2025 and 2035
  • Figure 82: East Asia Market Y-o-Y Growth Comparison by Operation, 2025 to 2035
  • Figure 83: East Asia Market Attractiveness Analysis by Operation
  • Figure 84: East Asia Market Value Share and BPS Analysis by Motion Of Direction, 2025 and 2035
  • Figure 85: East Asia Market Y-o-Y Growth Comparison by Motion Of Direction, 2025 to 2035
  • Figure 86: East Asia Market Attractiveness Analysis by Motion Of Direction
  • Figure 87: East Asia Market Value Share and BPS Analysis by End Use, 2025 and 2035
  • Figure 88: East Asia Market Y-o-Y Growth Comparison by End Use, 2025 to 2035
  • Figure 89: East Asia Market Attractiveness Analysis by End Use
  • Figure 90: South Asia and Pacific Market Value Share and BPS Analysis by Country, 2025 and 2035
  • Figure 91: South Asia and Pacific Market Value Share and BPS Analysis by Type , 2025 and 2035
  • Figure 92: South Asia and Pacific Market Y-o-Y Growth Comparison by Type , 2025 to 2035
  • Figure 93: South Asia and Pacific Market Attractiveness Analysis by Type
  • Figure 94: South Asia and Pacific Market Value Share and BPS Analysis by Operation, 2025 and 2035
  • Figure 95: South Asia and Pacific Market Y-o-Y Growth Comparison by Operation, 2025 to 2035
  • Figure 96: South Asia and Pacific Market Attractiveness Analysis by Operation
  • Figure 97: South Asia and Pacific Market Value Share and BPS Analysis by Motion Of Direction, 2025 and 2035
  • Figure 98: South Asia and Pacific Market Y-o-Y Growth Comparison by Motion Of Direction, 2025 to 2035
  • Figure 99: South Asia and Pacific Market Attractiveness Analysis by Motion Of Direction
  • Figure 100: South Asia and Pacific Market Value Share and BPS Analysis by End Use, 2025 and 2035
  • Figure 101: South Asia and Pacific Market Y-o-Y Growth Comparison by End Use, 2025 to 2035
  • Figure 102: South Asia and Pacific Market Attractiveness Analysis by End Use
  • Figure 103: Middle East & Africa Market Value Share and BPS Analysis by Country, 2025 and 2035
  • Figure 104: Middle East & Africa Market Value Share and BPS Analysis by Type , 2025 and 2035
  • Figure 105: Middle East & Africa Market Y-o-Y Growth Comparison by Type , 2025 to 2035
  • Figure 106: Middle East & Africa Market Attractiveness Analysis by Type
  • Figure 107: Middle East & Africa Market Value Share and BPS Analysis by Operation, 2025 and 2035
  • Figure 108: Middle East & Africa Market Y-o-Y Growth Comparison by Operation, 2025 to 2035
  • Figure 109: Middle East & Africa Market Attractiveness Analysis by Operation
  • Figure 110: Middle East & Africa Market Value Share and BPS Analysis by Motion Of Direction, 2025 and 2035
  • Figure 111: Middle East & Africa Market Y-o-Y Growth Comparison by Motion Of Direction, 2025 to 2035
  • Figure 112: Middle East & Africa Market Attractiveness Analysis by Motion Of Direction
  • Figure 113: Middle East & Africa Market Value Share and BPS Analysis by End Use, 2025 and 2035
  • Figure 114: Middle East & Africa Market Y-o-Y Growth Comparison by End Use, 2025 to 2035
  • Figure 115: Middle East & Africa Market Attractiveness Analysis by End Use
  • Figure 116: Global Market – Tier Structure Analysis
  • Figure 117: Global Market – Company Share Analysis

Frequently Asked Questions

How big is the laboratory shakers market in 2025?

The global laboratory shakers market is estimated to be valued at USD 3.5 billion in 2025.

What will be the size of laboratory shakers market in 2035?

The market size for the laboratory shakers market is projected to reach USD 5.4 billion by 2035.

How much will be the laboratory shakers market growth between 2025 and 2035?

The laboratory shakers market is expected to grow at a 4.5% CAGR between 2025 and 2035.

What are the key product types in the laboratory shakers market?

The key product types in laboratory shakers market are orbital laboratory shakers, vortex laboratory shakers, rocking laboratory shakers, incubator laboratory shakers, biological laboratory shakers, vibrating laboratory shakers, nutating laboratory shakers, reciprocating laboratory shakers, sieve laboratory shakers and miscellaneous laboratory shakers.

Which operation segment to contribute significant share in the laboratory shakers market in 2025?

In terms of operation, open air shaker segment to command 40.0% share in the laboratory shakers market in 2025.

Explore Similar Insights

Future Market Insights

Laboratory Shakers Market

Chat With MaRIA

Chat With

MaRIA

Hi There, I am MaRIA, Your Market Research Intelligence Assistant. How may I help you?