Antenna, Transducer, and Radome (ATR) Market Outlook (2023 to 2033)

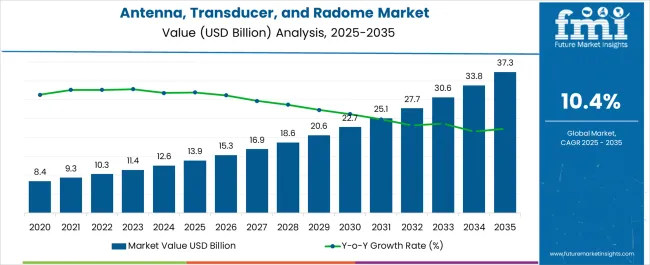
The global antenna, transducer, and radome (ATR) market was valued at around US$ 10.45 billion in 2022. With a projected CAGR of 10.4% for the next ten years, the market is likely to reach a valuation of nearly US$ 30.68 billion by the end of 2033. Integration of different technologies under joint ventures is one of the key factors that propel the growth of the global antenna, transducer, and radome market.

Future Market Insights’ analysis reveals that in 2023 revenue through the antenna, transducer, and radome market is estimated at US$ 11.37 billion. Worldwide, proliferated use of antenna transducers in air traffic control and tracking of weather change is supposed to strengthen the market growth during the forecast period. However, the global antenna transducer and radome market experienced a setback in the form of high maintenance costs, manufacturing & setup of the system, and lack of skilled personnel.

The widespread adoption of wireless communication technologies like 5G, the Internet of Things (IoT), and autonomous vehicles has created a growing need for antennas, transducers, and radomes. These components facilitate seamless connectivity and efficient signal transmission, driving the demand in the ATR market.

The continuous development of advanced radar and sonar systems for defense, maritime, and aviation applications requires high-performance ATR components. These components are crucial in enabling accurate detection, communication, and navigation, propelling the market forward.

The automotive industry is rapidly adopting advanced technologies such as vehicle-to-vehicle (V2V) and vehicle-to-infrastructure (V2I) communication, collision avoidance systems, and autonomous driving features. These applications rely heavily on antennas and transducers, driving the demand for ATR components.

The aerospace industry is experiencing significant growth, leading to increased commercial aircraft production. Antennas, transducers, and radomes are vital components for communication, navigation, and weather radar systems in these aircraft. Consequently, the market is witnessing substantial growth given this demand.

Defense organizations worldwide are actively investing in the modernization of their military systems. This includes upgrading radars, communication systems, electronic warfare equipment, and unmanned defense systems like UAVs, UGVs, and UUVs. ATR components are integral to these modernization efforts, creating a significant demand in the market.

The healthcare sector is also witnessing remarkable advancements in technology. Medical devices and equipment such as ultrasound machines, MRI scanners, and medical imaging systems rely on transducers for accurate diagnosis and treatment. The progress in healthcare technology contributes to the demand for ATR components.

ATR technology plays a vital role in the homeland security sector. It has significant applications, particularly in tracking potential threats. It enables precise and accurate tracking of unauthorized intrusions and suspicious activities. This capability allows security personnel to respond promptly and appropriately to ensure the safety and security of the area or facility.

Attributes Details
Historical Value (2022) US$ 10.45 billion
Current Year Value (2023) US$ 11.37 billion
Expected Forecast Value (2033) US$ 30.68 billion
Projected CAGR (2023 to 2033) 10.4%

Don't pay for what you don't need

Customize your report by selecting specific countries or regions and save 30%!

Sales Analysis of Antenna, Transducer, and Radome from 2018 to 2022 Vs Market Outlook for 2023 to 2033

The global antenna, transducer and radome market expanded at a CAGR of 8.3% over the last four years (2018 to 2022). According to SIPRI, the total global defense expenditure has gone up at least 0.7% in 2021. The sale of components is bound to increase by 2X as investments in technologically advanced systems that extensively use an antenna, transducer, and radome.

The United States will continue to be the largest user of Antenna, Transducer, and Radome Market throughout the analysis period accounting for over US$ 18.7 billion absolute dollar opportunity in the coming 10-year period.

The development of advanced materials has revolutionized the market. These materials offer attributes like lightweight construction, durability, and enhanced performance. They are, therefore, perfect for radome application and antenna construction. The utilization of these innovative materials has led to improved antenna efficiency, increased transducer sensitivity, and superior protection for radomes.

The ATR market is witnessing a strong push toward miniaturization and integration to cater to the demands of compact and portable devices. Antenna manufacturers are diligently working on developing smaller and more efficient designs, while transducers and radomes are being integrated into the overall system to reduce size, weight, and complexity.

A noteworthy trend in the market is the increasing demand for customized solutions that seamlessly integrate into specific applications. Companies that provide customization services and collaborate closely with clients to develop tailored ATR solutions can gain a distinct competitive edge in the market.

The market is also experiencing a rising trend in the adoption of SATCOM technology, which has fueled the demand for space antennas. These antennas are instrumental in improving the capabilities of military intelligence, surveillance, and reconnaissance (ISR) systems, as well as communication systems. As a result, there is a need for upgraded radomes, such as the plasma radome, designed specifically to safeguard space antennas from potential external threats.

How are key Drivers Going to Affect Antenna, Transducer, and Radome Market?

The United States Department of Defence boosted progress payments to contracting companies in 2020 from 80% to 90% in order to recognize task completion and initiated new contracts. In order to meet their commitments regarding delivery, market giants like Lockheed Martin Corporation hastened payment of more than US$ 400 million weekly to its suppliers. This huge investment is bound to positively impact the Antenna, Transducer, and Radome market.

The advanced communications modules have clear advantages across many industries. The advanced antenna technique's used in such modules’ increase in coverage distance suggests lower CAPEX costs as fewer access points are required, lower deployment costs since less equipment and wiring are required and lower OPEX costs as less equipment needs to be maintained throughout the maintenance cycle. Vector Fields Limited sent Ofcom a report on the use of smart antennas. The study's findings indicate that smart antenna technology has had a significant positive impact. These benefits can be broken down into three categories: a 40–70% increase in communication cell range, a 60–70% decrease in spectrum utilization, and a 50% network cost reduction, which can result in a 1/3 reduction in overall business costs. This has considerably boosted the smart antenna industry's drive.

Sudip Saha
Sudip Saha

Principal Consultant

Talk to Analyst

Find your sweet spots for generating winning opportunities in this market.

What are the restraints to the growth of the Antenna, Transducer, and Radome Market?

Before introducing a new product to the market, ATR manufacturers must get product certification. Multiple tests and iterations are necessary for manufacturers to obtain the maximum level of safety which necessitates protracted approval processes, which in turn cause production delays and financial losses. For instance, according to the key responders, it may take up to three years to get product approval from the Federal Aviation Administration (FAA), which oversees certification in North America. Such regulatory agency certification hold-ups may impede the market's expansion for ATRs.

Materials that least impede the electromagnetic signal sent or received by antennas are used to build radomes such as Polyurethane. The performance of radar and antenna systems can be impacted by even the smallest physical changes, which can also interfere with communication. As a result, radome maintenance must be done on time. When radome repairs are made, care should be taken to maintain any original characteristics, like transmissivity and reflectivity. The issue for radome developers arises from the fact that maintaining radomes involves technical know-how, the use of appropriate tools, and simulation methods.

Region-wise Insights

How Antenna, Transducer, and Radome Market in North America Holds Significant Potential in the Future?

North America dominated the Antenna, Transducer, and Radome industry in terms of revenue. North America controlled the bulk of the worldwide market with around 27.2% of the global market share. The revenue through UAVs alone is approximately US$ 1.3 billion. Due to the rising demand for UAVs for commercial purposes and the aerospace modernization programs which have experienced significant policy relaxation in North America. Owing to this, the market for antennas, transducers, and radome in North America is expected to expand significantly.
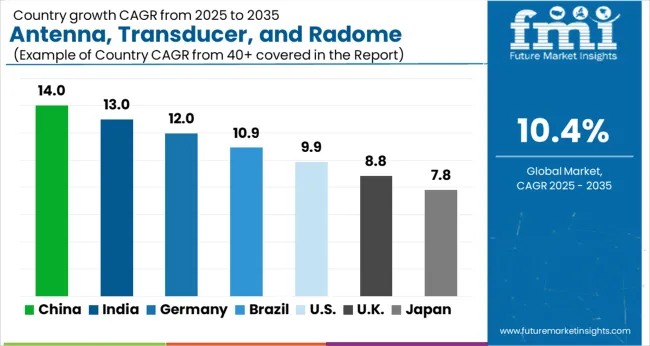
Countries 2022 Value Share in Global Market
United States 18.1%
Germany 9.2%
Japan 5.1%

How does the United States Maintain its Position in the global Antenna, Transducer, and Radome Market?

The United States is the current leader in antenna, transducer, and radome market, geared toward assisting the manufacturing sector. The united states also have a high adoption rate of technologically advanced product designs. For example, any three-dimensional laser incident surface may achieve a high-precision layout owing to LDS antenna technology, which is established and robust, with exceptional product performance. This technology has a larger design space and is appropriate for three-dimensional surfaces. Although LDS has a significant adoption rate, the cost is higher. It has made a significant contribution to revenue generation for the United States antenna, transducer, and radome market.

The country has witnessed an accelerated rollout of 5G networks across important cities. This creates a surge in demand for advanced antennas capable of supporting high-frequency bands and enabling lightning-fast data speeds. Antenna manufacturers are now focusing their efforts on developing compact, high-performance antennas to cater to the demanding requirements of 5G networks.

The United States is at the forefront of significant advancements in Millimeter Wave technology. It harnesses high-frequency bands for wireless communication. This breakthrough technology is finding applications in gigabit Wi-Fi, autonomous vehicles, and wireless backhaul solutions, thereby creating opportunities for antenna manufacturers to develop cutting-edge products.
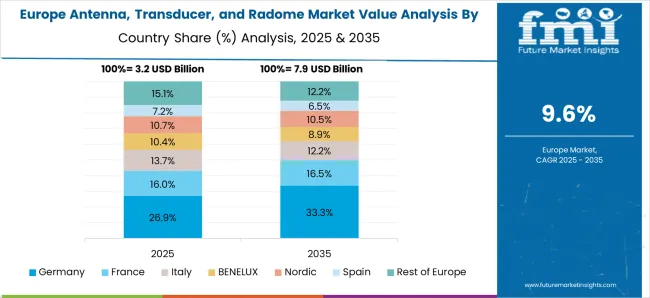
How is Germany's Electric Vehicle Revolution Influencing the Antenna, Transducer, and Radome Industry?

Germany's leadership in Industry 4.0 is creating a strong demand for robust wireless connectivity solutions. This demand is translating into an increased need for antennas, transducers, and radomes in industrial applications.

Germany's robust automotive industry is witnessing a paradigm shift with the emergence of electric vehicles (EVs) and autonomous driving technologies. This shift is fueling the demand for antennas and radomes that support connected car functionalities. Furthermore, the integration of radar and other sensing technologies is driving the Germany antenna, transducer, and radome market.

Germany aims to become a leading electric vehicle market, with ambitious plans to reduce carbon emissions. This transition fuels the demand for antennas and radomes to support advanced telematics, V2X communication, and connectivity features in electric cars.
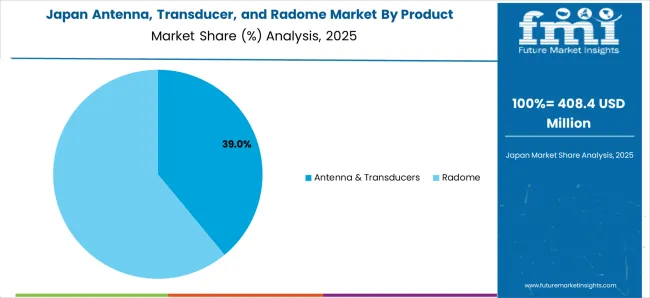
Is Japan Leading the Way in 6G Research for Antenna and Transducer Technologies?

Japan's renowned automotive industry has significantly emphasized developing advanced radar systems for vehicles. Antennas and radomes play a pivotal role in automotive radar systems, enabling features such as collision avoidance, adaptive cruise control, and autonomous driving.

Japan has been an early adopter of 5G technology, which necessitates advanced antennas and transducers to facilitate high-speed wireless communication. The deployment of 5G networks across the country is driving the demand for cutting-edge antenna and transducer technologies.

While 5G is still deployed, Japan is already investing in research and development for 6G technology. This includes exploring advanced antenna and transducer technologies that can support higher frequencies, increased bandwidth, and ultra-low latency. This is likely to open up immense opportunities for market players in the Japan antenna, transducer, and radome market.

Countries Value CAGR (2023 to 2033)
United Kingdom 10.4%
China 8.1%
India 12.3%

How is the Telecommunications Sector Dominating the United Kingdom Antenna, Transducer, and Radome Market?

The United Kingdom has a thriving telecommunications and aerospace industry. It drives the demand for antenna, transducer, and radome technologies considerably. Antennas are vital components for wireless communication systems, while transducers play a crucial role in converting one form of energy to another. Radomes provide protection to sensitive equipment from environmental factors without compromising signal quality.

The automotive industry in the United Kingdom is experiencing a prototype shift with the rising popularity of connected cars and autonomous vehicles. This transformation has resulted in a growing demand for antennas and radomes, which enable seamless connectivity for in-vehicle infotainment systems, telematics, and vehicle-to-vehicle communication, thereby enhancing the overall driving experience.

Are China's Smart City Initiatives Boosting Demand for Transducer and Antenna Systems?

China has emerged as a global powerhouse in the field of technology and telecommunications. As a result, the China antenna, transducer, and radome market is projected to experience significant growth during the forecast period. China's commitment to developing smart cities has created opportunities for the antenna, transducer, and radome industry.

China's commitment to building smart cities is likely to result in further investments and deployments of antenna systems, transducers, and radomes in various smart city projects across the country. Moreover, the integration of artificial intelligence with antenna systems is also gaining traction in China.

How are Defense Modernization Initiatives Impacting the India Antenna, Transducer, and Radome Market?

The India automotive market is undergoing a significant transformation, with a growing shift toward electric vehicles. This transition presents substantial opportunities for the antenna, transducer, and radome industry. The government's Make in India initiative aims to boost domestic manufacturing capabilities. This is likely to increase production of antennas, transducers, and radomes by local manufacturers.

The Indian defense sector is actively investing in advanced radar and communication systems, driving the demand for radomes. The government's emphasis on indigenization has resulted in collaborations between defense organizations and Indian antenna manufacturers, fostering innovation and boosting the domestic defense electronics industry.

Segment 2022 Value Share in Global Market
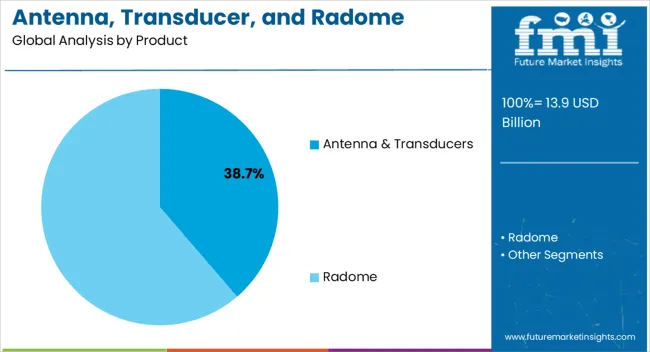
Antenna & Transducers 76.5%
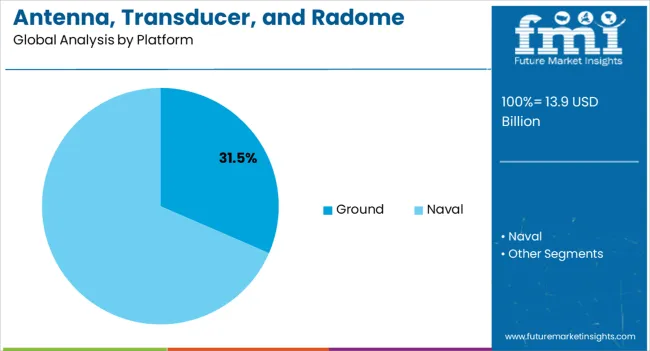
Ground 65.5%

Why Do Antennas and Transducers Hold a Commanding Position in the Market?

The dominance of the antenna and transducers segment in the antenna, transducer, and radome market can be attributed to a multitude of factors. The ever increasing demand for wireless communication technologies, such as 5G, IoT, and autonomous vehicles, has been a key driving force. Antennas serve as vital components for transmitting and receiving wireless signals. This makes them indispensable for various applications in the telecommunications, aerospace, automotive, and consumer electronics sectors.

The exponential growth in connected devices has played a pivotal role in the prominence of the antenna and transducers segment. From smartphones and tablets to smart home devices and wearables, these devices heavily rely on antennas to establish wireless connectivity and facilitate seamless data transfer. As a result, antennas have become integral to delivering a superior user experience in the era of connectivity.

Are Ground Platforms Revolutionizing the Antenna, Transducer, and Radome Industry?

The demand for antennas, transducers, and radomes is particularly high in ground platforms such as land-based vehicles, fixed infrastructure, and ground-based communication systems. These platforms rely heavily on robust and dependable communication systems for various applications. These include military operations, telecommunications, transportation, and industrial sectors.

Ground platforms generally offer a more cost-effective deployment compared to naval platforms. This affordability factor makes them an attractive option for various industries, including commercial applications. The cost-effectiveness further solidifies the dominance of ground platforms in the market.

How does the Commercial segment dominate the global Antenna, Transducer, and Radome Market?

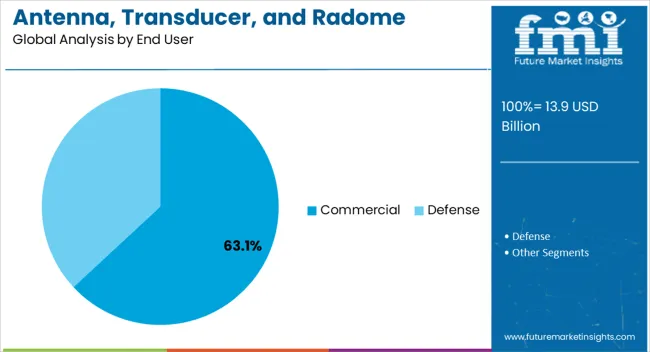
Antenna, Transducer, and Radome are used in an integrated form for several commercial activities. Due to the low cost, flexibility, and ease of installation compared to wired competitors, RFID tracking systems technology is utilized in 90% of the business sectors to track goods in e-commerce all around the world. The market for RADAR is driven by the employment of these antennas in satellite communication and autonomous vehicles, which connects remote, inaccessible places with ease of network planning owing to the wireless software setup of frequency and power. Hence commercial segment is dominant in the antenna, transducer, and radome market.
Get the data you need at a Fraction of the cost

Personalize your report by choosing insights you need
and save 40%!

Competitive Landscape

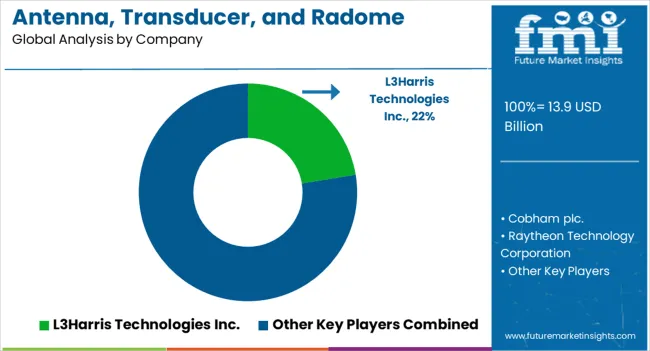
At present, Antenna, Transducer, and Radome Market manufacturers are largely setting up Joint ventures/mergers for the development of innovative products. The key companies operating in the Antenna, Transducer, and Radome Market include AeroVironment Inc., Airbus S.A.S., Azimut Yachts, BAE Systems PLC, Ball Aerospace & Technologies Corp., Cobham PLC, General Dynamics, Honeywell International Inc., HR Smith Group of Companies, Iridium Communications Inc., L3 Technologies, Leonardo S.p.A, Lockheed Martin, Northrop Grumman, Orolia SA, Qinetiq Group PLC, Raytheon Technologies, Stt-systemtechnik GmbH, Thales S.A., The Boeing Company, Astronics Corporation, Finmeccanica SpA, and Exelixis Inc.

Some of the recent developments by key providers of the Antenna, Transducer, and Radome Market are as follows:

  • In June 2023, ThinKom launched a new hybrid IFC antenna system. This system is called ThinAir Plus. It combines two individual antennas into a single installation. It offers airlines or integrators complete flexibility in utilizing satellite constellations and networks.
  • In March 2023, Carborundum Universal Limited announced signing a Licensing Agreement for Transfer of Technology with the Defence Research and Development Organisation. This agreement aims to facilitate the manufacturing of ceramic radomes utilized in aerospace and missile systems.
  • In February 2023, Danisense unveiled its latest current transducer. This transducer is specifically designed for automotive (EV) test benches and battery testing & evaluation systems. The DN1000ID current transducer has an impressive aperture size of 41.2mm. This substantial size allows for easy installation of power cables with large power connectors onto EV test benches.
  • In March 2022, Ball Aerospace and Flex collaborated to begin production on the Ku-Band and Ka-Band modular electronically steered antenna (ESA) subarrays.
  • In April 2019, Viasat launched a second-gen hybrid in-flight Ku and Ka-band antenna system for commercial aircraft. It has a more flexible and stable solution for geosynchronous and non-geosynchronous satellite networks.
  • In October 2019, Galtronics USA Inc. a wholly owned subsidiary of Baylin Technologies, announced that it has added Manual Electrical Tilt (MET) and Remote Electrical Tilt (RET) capabilities to its popular two-foot, 10 port quasi-omni small cell / C-RAN canister antenna product line.
  • In October 2020, Cobham Advanced Electronic Solutions of Cobham plc. Won a contract from Lockheed Martin worth US$50 million to supply the US navy with antenna array panels to improve its passive electronic support capability
  • In October 2020, Rohde & Schwarz won a contract from Spanish shipbuilder Navantia which mandates the company to provide the Spanish navy frigates with external communication systems, the contract also mandates the company to specifically provide R&S M3SR software enabled radios and also provide integrated logistical support for the Spanish navy.
  • In July 2020, Wescam mx-series products and support are covered by an indefinite-delivery, indefinite-quantity (IDIQ) contract of US$ 380 million that L3Harris Technologies, Inc. got from the Canadian Commercial Corporation.
  • In June 2020, A Saudi Arabian missile defence agency awarded a deal to Raytheon Technologies Corporation for US$ 2.3 billion to supply missile radars.
  • In March 2021, the United States government to jointly develop an advanced antenna technology solution for hypersonic applications with CAES.
  • In May 2021, BlueHalo was awarded a three-year contract by the United States Air Force’s Research laboratory of amount US$ 5.9 million for the development of antenna technologies for command and tracking operations.
  • In April 2021, Smiths Interconnect and Mitsubishi Electric Corporation to co-develop an antenna system based on a G-band satellite for the japan government space agency. According to the contract, the company will develop and design the component for the next-generation microwave scanning radiometer 3 (AMSR3) based on a dual-band antenna.
  • In June 2021, European Alliance for Deep Space antennas partnered with European Space Agency to provide technical assistance for deep antenna installation at Norcia station in Australia. This next-generation 35-meter antenna helps improve the communication capability of ESA in Ka, X, and K bands.

Key Segments Covered in Antenna, Transducer, and Radome Market Survey

By Product:

  • Antenna & Transducers
    • Parabolic Reflector Antenna
    • Flat Plane Antennas
    • Others
  • Radome
    • Sandwich
    • Solid Laminate
    • Dielectric Space Frame
    • Metal Space Frame

By Platform:

  • Ground
    • Telecom Towers
    • Ground Vehicles
    • Air Traffic Control
    • Command Centers
  • Naval
    • Commercial Vessels
    • Military Vessels
    • Commercial Aircraft
    • Bussiness & General Aviation
    • Military Aircraft
    • Unmanned Arial Vehicles
    • Evtols

By End user:

  • Commercial
  • Defense

By Frequency:

  • HF/VHF/UHF-band
  • L-band
  • S-band
  • C-band
  • X-band
  • Ku-band
  • Ka-band
  • Multi-band

By Application:

  • Communication
  • Navigation & Surveillance

By Region:

  • North America
  • Latin America
  • Europe
  • Asia Pacific
  • Middle East & Africa

Frequently Asked Questions

Which countries dominate the global Antenna, Transducer, and Radome (ATR) market?

The United States, Japan, and China dominate the global ATR market.

What is the growth forecast for the ATR market?

The ATR market is forecast to register a CAGR of 10.4% through 2033.

How is the historical performance of the market?

From 2018 to 2022, the market grew at a CAGR of 8.4%.

Which is the top trend in the ATR market?

Technological advancement disrupts the current market trends.

What is the projected size of the market by 2033?

The global market size of ATR is to reach US$ 30.68 billion by 2033.

Table of Content
1. Executive Summary
    1.1. Global Market Outlook
    1.2. Demand-side Trends
    1.3. Supply-side Trends
    1.4. Technology Roadmap Analysis
    1.5. Analysis and Recommendations
2. Market Overview
    2.1. Market Coverage / Taxonomy
    2.2. Market Definition / Scope / Limitations
3. Market Background
    3.1. Market Dynamics
        3.1.1. Drivers
        3.1.2. Restraints
        3.1.3. Opportunity
        3.1.4. Trends
    3.2. Scenario Forecast
        3.2.1. Demand in Optimistic Scenario
        3.2.2. Demand in Likely Scenario
        3.2.3. Demand in Conservative Scenario
    3.3. Opportunity Map Analysis
    3.4. Product Life Cycle Analysis
    3.5. Supply Chain Analysis
        3.5.1. Supply Side Participants and their Roles
            3.5.1.1. Producers
            3.5.1.2. Mid-Level Participants (Traders/ Agents/ Brokers)
            3.5.1.3. Wholesalers and Distributors
        3.5.2. Value Added and Value Created at Node in the Supply Chain
        3.5.3. List of Raw Material Suppliers
        3.5.4. List of Existing and Potential Buyer’s
    3.6. Investment Feasibility Matrix
    3.7. Value Chain Analysis
        3.7.1. Profit Margin Analysis
        3.7.2. Wholesalers and Distributors
        3.7.3. Retailers
    3.8. PESTLE and Porter’s Analysis
    3.9. Regulatory Landscape
        3.9.1. By Key Regions
        3.9.2. By Key Countries
    3.10. Regional Parent Market Outlook
    3.11. Production and Consumption Statistics
    3.12. Import and Export Statistics
4. Global Market Analysis 2018 to 2022 and Forecast, 2023 to 2033
    4.1. Historical Market Size Value (US$ Million) & Volume (Units) Analysis, 2018 to 2022
    4.2. Current and Future Market Size Value (US$ Million) & Volume (Units) Projections, 2023 to 2033
        4.2.1. Y-o-Y Growth Trend Analysis
        4.2.2. Absolute $ Opportunity Analysis
5. Global Market Analysis 2018 to 2022 and Forecast 2023 to 2033, By Product
    5.1. Introduction / Key Findings
    5.2. Historical Market Size Value (US$ Million) & Volume (Units) Analysis By Product, 2018 to 2022
    5.3. Current and Future Market Size Value (US$ Million) & Volume (Units) Analysis and Forecast By Product, 2023 to 2033
        5.3.1. Antenna & Transducers
            5.3.1.1. Parabolic Reflector Antenna
            5.3.1.2. Flat Plane Antennas
            5.3.1.3. Others
        5.3.2. Radome
            5.3.2.1. Sandwich
            5.3.2.2. Solid Laminate
            5.3.2.3. Dielectric Space Frame
            5.3.2.4. Metal Space Frame
    5.4. Y-o-Y Growth Trend Analysis By Product, 2018 to 2022
    5.5. Absolute $ Opportunity Analysis By Product, 2023 to 2033
6. Global Market Analysis 2018 to 2022 and Forecast 2023 to 2033, By Platform
    6.1. Introduction / Key Findings
    6.2. Historical Market Size Value (US$ Million) & Volume (Units) Analysis By Platform, 2018 to 2022
    6.3. Current and Future Market Size Value (US$ Million) & Volume (Units) Analysis and Forecast By Platform, 2023 to 2033
        6.3.1. Ground
            6.3.1.1. Telecom Towers
            6.3.1.2. Ground Vehicles
            6.3.1.3. Air Traffic Control
            6.3.1.4. Command Centers
        6.3.2. Naval
            6.3.2.1. Commercial Vessels
            6.3.2.2. Military Vessels
            6.3.2.3. Commercial Aircraft
            6.3.2.4. Bussiness & General Aviation
            6.3.2.5. Military Aircraft
            6.3.2.6. Unmanned Arial Vehicles
            6.3.2.7. Evtols
    6.4. Y-o-Y Growth Trend Analysis By Platform, 2018 to 2022
    6.5. Absolute $ Opportunity Analysis By Platform, 2023 to 2033
7. Global Market Analysis 2018 to 2022 and Forecast 2023 to 2033, By Frequency
    7.1. Introduction / Key Findings
    7.2. Historical Market Size Value (US$ Million) & Volume (Units) Analysis By Frequency, 2018 to 2022
    7.3. Current and Future Market Size Value (US$ Million) & Volume (Units) Analysis and Forecast By Frequency, 2023 to 2033
        7.3.1. HF/VHF/UHF-band
        7.3.2. L-band
        7.3.3. S-band
        7.3.4. C-band
        7.3.5. X-band
        7.3.6. Ku-band
        7.3.7. Ka-band
        7.3.8. Multi-band
    7.4. Y-o-Y Growth Trend Analysis By Frequency, 2018 to 2022
    7.5. Absolute $ Opportunity Analysis By Frequency, 2023 to 2033
8. Global Market Analysis 2018 to 2022 and Forecast 2023 to 2033, By Application
    8.1. Introduction / Key Findings
    8.2. Historical Market Size Value (US$ Million) & Volume (Units) Analysis By Application, 2018 to 2022
    8.3. Current and Future Market Size Value (US$ Million) & Volume (Units) Analysis and Forecast By Application, 2023 to 2033
        8.3.1. Communication
        8.3.2. Navigation & Surveillance
    8.4. Y-o-Y Growth Trend Analysis By Application, 2018 to 2022
    8.5. Absolute $ Opportunity Analysis By Application, 2023 to 2033
9. Global Market Analysis 2018 to 2022 and Forecast 2023 to 2033, By End-user
    9.1. Introduction / Key Findings
    9.2. Historical Market Size Value (US$ Million) & Volume (Units) Analysis By End-user, 2018 to 2022
    9.3. Current and Future Market Size Value (US$ Million) & Volume (Units) Analysis and Forecast By End-user, 2023 to 2033
        9.3.1. Commercial
        9.3.2. Defense
    9.4. Y-o-Y Growth Trend Analysis By End-user, 2018 to 2022
    9.5. Absolute $ Opportunity Analysis By End-user, 2023 to 2033
10. Global Market Analysis 2018 to 2022 and Forecast 2023 to 2033, By Region
    10.1. Introduction
    10.2. Historical Market Size Value (US$ Million) & Volume (Units) Analysis By Region, 2018 to 2022
    10.3. Current Market Size Value (US$ Million) & Volume (Units) Analysis and Forecast By Region, 2023 to 2033
        10.3.1. North America
        10.3.2. Latin America
        10.3.3. Western Europe
        10.3.4. Eastern Europe
        10.3.5. South Asia and Pacific
        10.3.6. East Asia
        10.3.7. Middle East and Africa
    10.4. Market Attractiveness Analysis By Region
11. North America Market Analysis 2018 to 2022 and Forecast 2023 to 2033, By Country
    11.1. Historical Market Size Value (US$ Million) & Volume (Units) Trend Analysis By Market Taxonomy, 2018 to 2022
    11.2. Market Size Value (US$ Million) & Volume (Units) Forecast By Market Taxonomy, 2023 to 2033
        11.2.1. By Country
            11.2.1.1. USA
            11.2.1.2. Canada
        11.2.2. By Product
        11.2.3. By Platform
        11.2.4. By Frequency
        11.2.5. By Application
        11.2.6. By End-user
    11.3. Market Attractiveness Analysis
        11.3.1. By Country
        11.3.2. By Product
        11.3.3. By Platform
        11.3.4. By Frequency
        11.3.5. By Application
        11.3.6. By End-user
    11.4. Key Takeaways
12. Latin America Market Analysis 2018 to 2022 and Forecast 2023 to 2033, By Country
    12.1. Historical Market Size Value (US$ Million) & Volume (Units) Trend Analysis By Market Taxonomy, 2018 to 2022
    12.2. Market Size Value (US$ Million) & Volume (Units) Forecast By Market Taxonomy, 2023 to 2033
        12.2.1. By Country
            12.2.1.1. Brazil
            12.2.1.2. Mexico
            12.2.1.3. Rest of Latin America
        12.2.2. By Product
        12.2.3. By Platform
        12.2.4. By Frequency
        12.2.5. By Application
        12.2.6. By End-user
    12.3. Market Attractiveness Analysis
        12.3.1. By Country
        12.3.2. By Product
        12.3.3. By Platform
        12.3.4. By Frequency
        12.3.5. By Application
        12.3.6. By End-user
    12.4. Key Takeaways
13. Western Europe Market Analysis 2018 to 2022 and Forecast 2023 to 2033, By Country
    13.1. Historical Market Size Value (US$ Million) & Volume (Units) Trend Analysis By Market Taxonomy, 2018 to 2022
    13.2. Market Size Value (US$ Million) & Volume (Units) Forecast By Market Taxonomy, 2023 to 2033
        13.2.1. By Country
            13.2.1.1. Germany
            13.2.1.2. UK
            13.2.1.3. France
            13.2.1.4. Spain
            13.2.1.5. Italy
            13.2.1.6. Rest of Western Europe
        13.2.2. By Product
        13.2.3. By Platform
        13.2.4. By Frequency
        13.2.5. By Application
        13.2.6. By End-user
    13.3. Market Attractiveness Analysis
        13.3.1. By Country
        13.3.2. By Product
        13.3.3. By Platform
        13.3.4. By Frequency
        13.3.5. By Application
        13.3.6. By End-user
    13.4. Key Takeaways
14. Eastern Europe Market Analysis 2018 to 2022 and Forecast 2023 to 2033, By Country
    14.1. Historical Market Size Value (US$ Million) & Volume (Units) Trend Analysis By Market Taxonomy, 2018 to 2022
    14.2. Market Size Value (US$ Million) & Volume (Units) Forecast By Market Taxonomy, 2023 to 2033
        14.2.1. By Country
            14.2.1.1. Poland
            14.2.1.2. Russia
            14.2.1.3. Czech Republic
            14.2.1.4. Romania
            14.2.1.5. Rest of Eastern Europe
        14.2.2. By Product
        14.2.3. By Platform
        14.2.4. By Frequency
        14.2.5. By Application
        14.2.6. By End-user
    14.3. Market Attractiveness Analysis
        14.3.1. By Country
        14.3.2. By Product
        14.3.3. By Platform
        14.3.4. By Frequency
        14.3.5. By Application
        14.3.6. By End-user
    14.4. Key Takeaways
15. South Asia and Pacific Market Analysis 2018 to 2022 and Forecast 2023 to 2033, By Country
    15.1. Historical Market Size Value (US$ Million) & Volume (Units) Trend Analysis By Market Taxonomy, 2018 to 2022
    15.2. Market Size Value (US$ Million) & Volume (Units) Forecast By Market Taxonomy, 2023 to 2033
        15.2.1. By Country
            15.2.1.1. India
            15.2.1.2. Bangladesh
            15.2.1.3. Australia
            15.2.1.4. New Zealand
            15.2.1.5. Rest of South Asia and Pacific
        15.2.2. By Product
        15.2.3. By Platform
        15.2.4. By Frequency
        15.2.5. By Application
        15.2.6. By End-user
    15.3. Market Attractiveness Analysis
        15.3.1. By Country
        15.3.2. By Product
        15.3.3. By Platform
        15.3.4. By Frequency
        15.3.5. By Application
        15.3.6. By End-user
    15.4. Key Takeaways
16. East Asia Market Analysis 2018 to 2022 and Forecast 2023 to 2033, By Country
    16.1. Historical Market Size Value (US$ Million) & Volume (Units) Trend Analysis By Market Taxonomy, 2018 to 2022
    16.2. Market Size Value (US$ Million) & Volume (Units) Forecast By Market Taxonomy, 2023 to 2033
        16.2.1. By Country
            16.2.1.1. China
            16.2.1.2. Japan
            16.2.1.3. South Korea
        16.2.2. By Product
        16.2.3. By Platform
        16.2.4. By Frequency
        16.2.5. By Application
        16.2.6. By End-user
    16.3. Market Attractiveness Analysis
        16.3.1. By Country
        16.3.2. By Product
        16.3.3. By Platform
        16.3.4. By Frequency
        16.3.5. By Application
        16.3.6. By End-user
    16.4. Key Takeaways
17. Middle East and Africa Market Analysis 2018 to 2022 and Forecast 2023 to 2033, By Country
    17.1. Historical Market Size Value (US$ Million) & Volume (Units) Trend Analysis By Market Taxonomy, 2018 to 2022
    17.2. Market Size Value (US$ Million) & Volume (Units) Forecast By Market Taxonomy, 2023 to 2033
        17.2.1. By Country
            17.2.1.1. GCC Countries
            17.2.1.2. South Africa
            17.2.1.3. Israel
            17.2.1.4. Rest of MEA
        17.2.2. By Product
        17.2.3. By Platform
        17.2.4. By Frequency
        17.2.5. By Application
        17.2.6. By End-user
    17.3. Market Attractiveness Analysis
        17.3.1. By Country
        17.3.2. By Product
        17.3.3. By Platform
        17.3.4. By Frequency
        17.3.5. By Application
        17.3.6. By End-user
    17.4. Key Takeaways
18. Key Countries Market Analysis
    18.1. USA
        18.1.1. Pricing Analysis
        18.1.2. Market Share Analysis, 2022
            18.1.2.1. By Product
            18.1.2.2. By Platform
            18.1.2.3. By Frequency
            18.1.2.4. By Application
            18.1.2.5. By End-user
    18.2. Canada
        18.2.1. Pricing Analysis
        18.2.2. Market Share Analysis, 2022
            18.2.2.1. By Product
            18.2.2.2. By Platform
            18.2.2.3. By Frequency
            18.2.2.4. By Application
            18.2.2.5. By End-user
    18.3. Brazil
        18.3.1. Pricing Analysis
        18.3.2. Market Share Analysis, 2022
            18.3.2.1. By Product
            18.3.2.2. By Platform
            18.3.2.3. By Frequency
            18.3.2.4. By Application
            18.3.2.5. By End-user
    18.4. Mexico
        18.4.1. Pricing Analysis
        18.4.2. Market Share Analysis, 2022
            18.4.2.1. By Product
            18.4.2.2. By Platform
            18.4.2.3. By Frequency
            18.4.2.4. By Application
            18.4.2.5. By End-user
    18.5. Germany
        18.5.1. Pricing Analysis
        18.5.2. Market Share Analysis, 2022
            18.5.2.1. By Product
            18.5.2.2. By Platform
            18.5.2.3. By Frequency
            18.5.2.4. By Application
            18.5.2.5. By End-user
    18.6. UK
        18.6.1. Pricing Analysis
        18.6.2. Market Share Analysis, 2022
            18.6.2.1. By Product
            18.6.2.2. By Platform
            18.6.2.3. By Frequency
            18.6.2.4. By Application
            18.6.2.5. By End-user
    18.7. France
        18.7.1. Pricing Analysis
        18.7.2. Market Share Analysis, 2022
            18.7.2.1. By Product
            18.7.2.2. By Platform
            18.7.2.3. By Frequency
            18.7.2.4. By Application
            18.7.2.5. By End-user
    18.8. Spain
        18.8.1. Pricing Analysis
        18.8.2. Market Share Analysis, 2022
            18.8.2.1. By Product
            18.8.2.2. By Platform
            18.8.2.3. By Frequency
            18.8.2.4. By Application
            18.8.2.5. By End-user
    18.9. Italy
        18.9.1. Pricing Analysis
        18.9.2. Market Share Analysis, 2022
            18.9.2.1. By Product
            18.9.2.2. By Platform
            18.9.2.3. By Frequency
            18.9.2.4. By Application
            18.9.2.5. By End-user
    18.10. Poland
        18.10.1. Pricing Analysis
        18.10.2. Market Share Analysis, 2022
            18.10.2.1. By Product
            18.10.2.2. By Platform
            18.10.2.3. By Frequency
            18.10.2.4. By Application
            18.10.2.5. By End-user
    18.11. Russia
        18.11.1. Pricing Analysis
        18.11.2. Market Share Analysis, 2022
            18.11.2.1. By Product
            18.11.2.2. By Platform
            18.11.2.3. By Frequency
            18.11.2.4. By Application
            18.11.2.5. By End-user
    18.12. Czech Republic
        18.12.1. Pricing Analysis
        18.12.2. Market Share Analysis, 2022
            18.12.2.1. By Product
            18.12.2.2. By Platform
            18.12.2.3. By Frequency
            18.12.2.4. By Application
            18.12.2.5. By End-user
    18.13. Romania
        18.13.1. Pricing Analysis
        18.13.2. Market Share Analysis, 2022
            18.13.2.1. By Product
            18.13.2.2. By Platform
            18.13.2.3. By Frequency
            18.13.2.4. By Application
            18.13.2.5. By End-user
    18.14. India
        18.14.1. Pricing Analysis
        18.14.2. Market Share Analysis, 2022
            18.14.2.1. By Product
            18.14.2.2. By Platform
            18.14.2.3. By Frequency
            18.14.2.4. By Application
            18.14.2.5. By End-user
    18.15. Bangladesh
        18.15.1. Pricing Analysis
        18.15.2. Market Share Analysis, 2022
            18.15.2.1. By Product
            18.15.2.2. By Platform
            18.15.2.3. By Frequency
            18.15.2.4. By Application
            18.15.2.5. By End-user
    18.16. Australia
        18.16.1. Pricing Analysis
        18.16.2. Market Share Analysis, 2022
            18.16.2.1. By Product
            18.16.2.2. By Platform
            18.16.2.3. By Frequency
            18.16.2.4. By Application
            18.16.2.5. By End-user
    18.17. New Zealand
        18.17.1. Pricing Analysis
        18.17.2. Market Share Analysis, 2022
            18.17.2.1. By Product
            18.17.2.2. By Platform
            18.17.2.3. By Frequency
            18.17.2.4. By Application
            18.17.2.5. By End-user
    18.18. China
        18.18.1. Pricing Analysis
        18.18.2. Market Share Analysis, 2022
            18.18.2.1. By Product
            18.18.2.2. By Platform
            18.18.2.3. By Frequency
            18.18.2.4. By Application
            18.18.2.5. By End-user
    18.19. Japan
        18.19.1. Pricing Analysis
        18.19.2. Market Share Analysis, 2022
            18.19.2.1. By Product
            18.19.2.2. By Platform
            18.19.2.3. By Frequency
            18.19.2.4. By Application
            18.19.2.5. By End-user
    18.20. South Korea
        18.20.1. Pricing Analysis
        18.20.2. Market Share Analysis, 2022
            18.20.2.1. By Product
            18.20.2.2. By Platform
            18.20.2.3. By Frequency
            18.20.2.4. By Application
            18.20.2.5. By End-user
    18.21. GCC Countries
        18.21.1. Pricing Analysis
        18.21.2. Market Share Analysis, 2022
            18.21.2.1. By Product
            18.21.2.2. By Platform
            18.21.2.3. By Frequency
            18.21.2.4. By Application
            18.21.2.5. By End-user
    18.22. South Africa
        18.22.1. Pricing Analysis
        18.22.2. Market Share Analysis, 2022
            18.22.2.1. By Product
            18.22.2.2. By Platform
            18.22.2.3. By Frequency
            18.22.2.4. By Application
            18.22.2.5. By End-user
    18.23. Israel
        18.23.1. Pricing Analysis
        18.23.2. Market Share Analysis, 2022
            18.23.2.1. By Product
            18.23.2.2. By Platform
            18.23.2.3. By Frequency
            18.23.2.4. By Application
            18.23.2.5. By End-user
19. Market Structure Analysis
    19.1. Competition Dashboard
    19.2. Competition Benchmarking
    19.3. Market Share Analysis of Top Players
        19.3.1. By Regional
        19.3.2. By Product
        19.3.3. By Platform
        19.3.4. By Frequency
        19.3.5. By Application
        19.3.6. By End-user
20. Competition Analysis
    20.1. Competition Deep Dive
        20.1.1. L3Harris Technologies Inc.
            20.1.1.1. Overview
            20.1.1.2. Product Portfolio
            20.1.1.3. Profitability by Market Segments
            20.1.1.4. Sales Footprint
            20.1.1.5. Strategy Overview
                20.1.1.5.1. Marketing Strategy
                20.1.1.5.2. Product Strategy
                20.1.1.5.3. Channel Strategy
        20.1.2. Cobham plc.
            20.1.2.1. Overview
            20.1.2.2. Product Portfolio
            20.1.2.3. Profitability by Market Segments
            20.1.2.4. Sales Footprint
            20.1.2.5. Strategy Overview
                20.1.2.5.1. Marketing Strategy
                20.1.2.5.2. Product Strategy
                20.1.2.5.3. Channel Strategy
        20.1.3. Raytheon Technology Corporation
            20.1.3.1. Overview
            20.1.3.2. Product Portfolio
            20.1.3.3. Profitability by Market Segments
            20.1.3.4. Sales Footprint
            20.1.3.5. Strategy Overview
                20.1.3.5.1. Marketing Strategy
                20.1.3.5.2. Product Strategy
                20.1.3.5.3. Channel Strategy
        20.1.4. Lockheed Martin Corporation
            20.1.4.1. Overview
            20.1.4.2. Product Portfolio
            20.1.4.3. Profitability by Market Segments
            20.1.4.4. Sales Footprint
            20.1.4.5. Strategy Overview
                20.1.4.5.1. Marketing Strategy
                20.1.4.5.2. Product Strategy
                20.1.4.5.3. Channel Strategy
        20.1.5. General Dynamics
            20.1.5.1. Overview
            20.1.5.2. Product Portfolio
            20.1.5.3. Profitability by Market Segments
            20.1.5.4. Sales Footprint
            20.1.5.5. Strategy Overview
                20.1.5.5.1. Marketing Strategy
                20.1.5.5.2. Product Strategy
                20.1.5.5.3. Channel Strategy
        20.1.6. BAE Systems
            20.1.6.1. Overview
            20.1.6.2. Product Portfolio
            20.1.6.3. Profitability by Market Segments
            20.1.6.4. Sales Footprint
            20.1.6.5. Strategy Overview
                20.1.6.5.1. Marketing Strategy
                20.1.6.5.2. Product Strategy
                20.1.6.5.3. Channel Strategy
        20.1.7. Honeywell International Inc.
            20.1.7.1. Overview
            20.1.7.2. Product Portfolio
            20.1.7.3. Profitability by Market Segments
            20.1.7.4. Sales Footprint
            20.1.7.5. Strategy Overview
                20.1.7.5.1. Marketing Strategy
                20.1.7.5.2. Product Strategy
                20.1.7.5.3. Channel Strategy
        20.1.8. Northrop Grumman Corporation
            20.1.8.1. Overview
            20.1.8.2. Product Portfolio
            20.1.8.3. Profitability by Market Segments
            20.1.8.4. Sales Footprint
            20.1.8.5. Strategy Overview
                20.1.8.5.1. Marketing Strategy
                20.1.8.5.2. Product Strategy
                20.1.8.5.3. Channel Strategy
        20.1.9. Thales Group
            20.1.9.1. Overview
            20.1.9.2. Product Portfolio
            20.1.9.3. Profitability by Market Segments
            20.1.9.4. Sales Footprint
            20.1.9.5. Strategy Overview
                20.1.9.5.1. Marketing Strategy
                20.1.9.5.2. Product Strategy
                20.1.9.5.3. Channel Strategy
        20.1.10. Leonardo S.p.A
            20.1.10.1. Overview
            20.1.10.2. Product Portfolio
            20.1.10.3. Profitability by Market Segments
            20.1.10.4. Sales Footprint
            20.1.10.5. Strategy Overview
                20.1.10.5.1. Marketing Strategy
                20.1.10.5.2. Product Strategy
                20.1.10.5.3. Channel Strategy
21. Assumptions & Acronyms Used
22. Research Methodology
Recommendations

Technology

Wireless Antenna Market

October 2022

REP-GB-6201

340 pages

Explore Technology Insights

View Reports
Future Market Insights

Antenna, Transducer, and Radome (ATR) Market

Schedule a Call