Reports

- Global Locations -

Headquarters

Future Market Insights, Inc.

Christiana Corporate, 200
Continental Drive, Suite 401,
Newark, Delaware - 19713,
United States

T: +1-845-579-5705

Americas

Future Market Insights, Inc.

616 Corporate Way, Suite 2-9018,
Valley Cottage, NY 10989, United States

T: +1-347-918-3531

MEA

Future Market Insights

1602-6 Jumeirah Bay X2 Tower, Plot No: JLT-PH2-X2A,
Jumeirah Lakes Towers, Dubai,
United Arab Emirates

Europe

Future Market Insights

3rd Floor, 207 Regent Street,
W1B 3HH London
United Kingdom

T: + 44 (0) 20 8123 9659
D: +44 (0) 20 3287 4268

Asia Pacific

Future Market Insights

IndiaLand Global Tech Park, Unit UG-1, Behind Grand HighStreet, Phase 1, Hinjawadi, MH, Pune – 411057, India

Automotive Smart Antenna Market Outlook from (2023 to 2033)

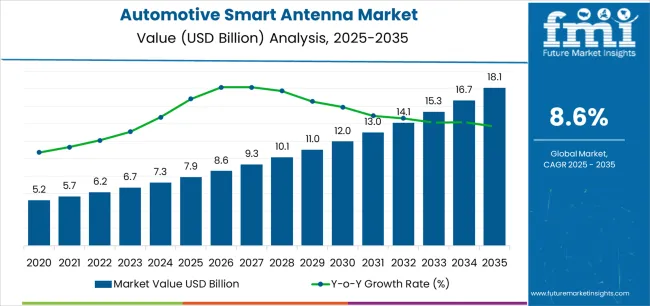
The global automotive smart antenna market size reached US$ 6,130.1 million in 2022. From 2023 to 2033, global automotive smart antenna demand is anticipated to rise at a 9.1% CAGR. Total market value is predicted to increase from US$ 6,643.2 million in 2023 to US$ 15,754.6 million by 2033.

Automotive smart antennas are set to assume a central role in guaranteeing the dependable and secure transmission of data. The growing popularity of smart antennas in the automotive sector can be attributed to the essential requirement for improved connectivity.

Modern vehicles require reliable and resilient links to external networks and infrastructure. Whether it pertains to navigation, live traffic information, wireless software upgrades, or in-car Wi-Fi zones, the necessity for continuous connectivity has spurred the acceptance of smart antennas.

The demand for smart antennas for automobiles is projected to remain high in the passenger car segment. The automotive smart antenna market analysis shows that the target segment is projected to thrive at an 8.1% CAGR during the assessment period.

Attributes Key Insights
Automotive Smart Antenna Market Size in 2022 US$ 6,130.1 million
Estimated Automotive Smart Antenna Market Value (2023E) US$ 6,643.2 million
Projected Automotive Smart Antenna Market Revenue (2033F) US$ 15,754.6 million
Value-based Automotive Smart Antenna Market CAGR (2023 to 2033) 9.1%
Collective Value Share: Top 5 Countries (2023E) 64.4%

The increasing adoption of advanced driver assistance systems (ADAS) stands as a noteworthy catalyst for the integration of smart antennas in the automotive sector. ADAS features such as adaptive cruise control, lane-keeping aid, and automatic emergency braking heavily depend on a continuous stream of data for immediate decision-making.

Smart antennas play a vital role in facilitating these systems by ensuring dependable communication with other vehicles and the surrounding infrastructure, enabling vehicle-to-vehicle (V2V) and vehicle-to-everything (V2X) connectivity. This technology plays a pivotal role in elevating road safety and diminishing the occurrence of accidents.

Don't pay for what you don't need

Customize your report by selecting specific countries or regions and save 30%!

Key Automotive Smart Antenna Market Highlights

  • The global automotive smart antenna market is predicted to expand around 2.3X through 2033. This is due to the growing demand for stronger GPS, cellular, and entertainment device connectivity in a vehicle.
  • Global sales of smart antennas will rise due to rapid population growth, technological advancements in the field of antennas, and the rising popularity of electric vehicles.
  • Smart antennas play a vital role in 5G networks by dynamically adjusting signal beams to enhance signal quality and expand coverage.
  • Dedicated commitment to innovation results in progress and improvements in smart antenna technology, rendering it an appealing option for telecommunication providers seeking to augment their network performance and capacity.

2018 to 2022 Automotive Smart Antenna Market Outlook Vs. 2023 to 2033 Forecast

Global sales of automotive smart antennas grew at a CAGR of 1.6% between 2018 and 2022. Total market revenue reached around US$ 6,130.1 million in 2022. In the forecast period, the worldwide automotive smart antenna industry is set to thrive at a CAGR of 9.1%.

Historical CAGR (2018 to 2022) 1.6%
Forecast CAGR (2023 to 2033) 9.1%

The global automotive smart antenna market witnessed steady growth between 2018 and 2022. This was due to the improved demand for connectivity, coupled with the incorporation of intelligent functionalities in contemporary automobiles.

Over the forecast period, the global automotive smart antenna market is poised to exhibit healthy growth, totaling a valuation of US$ 15,754.6 million by 2033. This is due to a combination of several factors. These include advancement in vehicle technology, enhanced vehicle connectivity, improved telematics and remote services, incrementing popularity of entertainment and infotainment, and reliability of network coverage.

Contemporary automobiles have transcended their traditional role as mere transportation means. They have undergone a significant evolution into smart and interconnected platforms.

Innovations in automotive technology have turned vehicles into mobile data hubs equipped with an array of sensors, cameras, and connectivity functions. Automotive smart antennas are leading this revolution by delivering uninterrupted connectivity to facilitate a diverse set of applications.

Nikhil Kaitwade
Nikhil Kaitwade

Principal Consultant

Talk to Analyst

Find your sweet spots for generating winning opportunities in this market.

Trends, Opportunities, and Challenges in Automotive Smart Antenna Market

Attributes Key Factors
Latest Trends
  • Transition to 5G Technology
5G technology offers exceptionally rapid and low-delay connectivity, a vital asset for a range of automotive uses such as instantaneous communication, high-definition video streaming, and responsive telematics services. The advent of 5G brings about a significant enhancement in V2X communication, encompassing interactions between vehicles (V2V) and interactions between vehicles and infrastructure (V2I). 5G technology opens the door to high-quality video streaming and online gaming with minimal delay right inside the vehicle.
  • Enhanced User Experience and Connectivity Expectations
Contemporary consumers desire a tailored experience when using their vehicles. They expect infotainment systems that can recall their choices, whether it is their preferred music playlists or climate settings. Connectivity plays a vital role in delivering content and services customized to individual preferences.
Upcoming Opportunities
  • Increasing Connectivity Infrastructure and Autonomous Driving
The rising vehicle connectivity signifies the increasing focus on delivering fast internet and data access in cars. This shift is propelled by consumer expectations for effortless access to digital services such as streaming media, real-time navigation, and the use of a variety of mobile or web applications. In the automotive landscape, connectivity is becoming progressively indispensable for telematics services, encompassing functions such as remote diagnostics, vehicle monitoring, and over-the-air (OTA) updates. Smart antennas guarantee a consistent and dependable flow of data for these purposes. The shift toward autonomous driving signifies the progress and introduction of self-driving cars. Smart antennas play a pivotal role in driving this trend for several reasons.
Challenges
  • High Cost of Implementation and Regulatory Concerns
Incorporating advanced smart antenna technology can be a costly endeavor for both car manufacturers and customers. The design and manufacturing of smart antennas equipped with features such as MIMO, 5G support, and advanced signal processing can substantially raise the total price of a vehicle. With the increasing connectivity of vehicles, there is a rising awareness of privacy and data security concerns. The utilization of smart antennas to collect and transmit vehicle data can give rise to regulatory and privacy challenges.

Comparative View of Adjacent Automotive Smart Antenna Markets

The global automotive smart antenna market will likely be impacted by the peer or tangential markets in the automotive division. These include other types of markets, such as the automotive brake system and component market and the automotive interior ambient lighting system market.

Examining these interconnected sectors can offer a more profound understanding that can be valuable in constructing distinct and differentiating strategies for pursuing growth and seizing opportunities within the automotive smart antenna market.

The section covers a comparative view of three markets similar to the automotive smart antenna market. As per estimations, the automotive smart antenna market would lead out of the three markets.

The demand for automotive smart antenna is set to surge at a CAGR of 9.1% by 2033. The automotive brake system and component and automotive interior ambient lighting system markets are expected to rise at CAGRs of 4.7% and 6.41%, respectively, in 2033.

Automotive Smart Antenna Market:

Attributes Automotive Smart Antenna Market
CAGR (2023 to 2033) 9.1%
Restraining Factor One of the key obstacles to the widespread use of smart antennas can be the lack of standardized communication protocols and technology.
Growth Factor The trend toward autonomous driving and more connections
Key Trend Use of several antennas in conjunction with MIMO technology

Automotive Brake System and Component Market:

Attributes Automotive Brake System and Component Market
CAGR (2023 to 2033) 4.7%
Restraining Factor There are frequently extra expenses associated with research, development, and manufacturing when integrating brake systems and components into automobiles.
Growth Factor Over the next ten years, it is projected that the growing demand for autonomous vehicles and the rising appeal of electric vehicles will raise manufacturing companies' potential for boosting commercial growth.
Key Trend One way to reduce stopping distance is to use electronic braking systems, such as electronic brake force distribution (EBD), brake aid (BA), and anti-lock brake system (ABS).

Automotive Interior Ambient Lighting System Market:

Attributes Automotive Interior Ambient Lighting System Market
CAGR (2023 to 2033) 6.41%
Restraining Factor One potential obstacle is consumers' limited knowledge of the advantages of interior ambient lighting systems.
Growth Factor The global market for automotive ambient lighting systems is being driven by advancements in the automotive sector and a growing fleet of automobiles.
Key Trend Customer customization is becoming more popular, which is helping the industry expand.

Get the data you need at a Fraction of the cost

Personalize your report by choosing insights you need
and save 40%!

Country-wise Insights

The table below highlights key countries’ automotive smart antenna market revenues. China, the United States, and Japan are expected to remain the top three consumers of smart antennas, with expected valuations of US$ 2,208.6 million, US$ 1,137.3 million, and US$ 347.0 million, respectively, in 2033.

Countries Automotive Smart Antenna Market Revenue (2033)
China US$ 2,208.6 million
United States US$ 1,137.3 million
Japan US$ 347.0 million
India US$ 337.5 million
Germany US$ 249.1 million
Association of Southeast Asian Nations US$ 247.0 million

The below table shows the estimated CAGR of the top five countries. Germany, Japan, and the Association of Southeast Asian Nations are expected to record high CAGRs of 10.2 %, 9.0%, and 9.8%, respectively, through 2033.

Countries Value-based CAGR (2023 to 2033)
China 8.9%
United States 4.6%
Japan 9.0%
India 8.6%
Germany 10.2%
Association of Southeast Asian Nations 9.8%

Rollout of 5G Technology to Bolster Demand in China

China’s automotive smart antenna market size is projected to reach US$ 2,208.6 million by 2033. Over the assessment period, demand for smart antennas in China is set to rise at an 8.9% CAGR.

China has taken a leading role in the rollout of 5G technology, boasting a robust network infrastructure. The 5G technology offers exceptionally fast and low-latency connectivity, which perfectly suits automotive applications. Smart antennas harness the power of 5G networks to guarantee swift and dependable communication, establishing their indispensability in the age of 5G-connected vehicles.

China holds a prominent position on the global stage when it comes to the electric vehicle (EV) market. With the increasing adoption of EVs, the need for smart antennas in electric cars is also witnessing a surge. Smart antennas play an essential role in electric vehicles, delivering connectivity for functionalities such as over-the-air (OTA) updates and remote diagnostics.

Mounting Demand for In-vehicle Connectivity to Fuel Sales in the United States

Sales of smart antennas in the United States are projected to soar at a CAGR of around 4.6% during the assessment period. Total valuation in the country is anticipated to reach US$ 1,137.3 million by 2033.

A key driver behind the expansion of the automotive smart antenna market in the United States is the increasing need for in-vehicle connectivity. Consumers anticipate effortless access to a broad spectrum of digital services while driving. This encompasses functions such as real-time navigation, top-tier infotainment, and the capacity to maintain connectivity with smart devices.

Consumer inclinations in the United States have changed in favor of vehicles equipped with advanced connectivity and entertainment systems. Contemporary car purchasers need their vehicles to seamlessly integrate with their connected way of life, and this has notably boosted the uptake of smart antennas.

Japan to Create Ample Opportunities for Automotive Smart Antenna Manufacturers

The automotive smart antenna market value in Japan is anticipated to rise to US$ 347.0 million by 2033. Over the forecast period, automotive smart antenna demand in the country is set to increase at a robust CAGR of 9.0%. The automotive smart antenna market in Japan is experiencing significant growth, driven by a unique combination of factors that reflect the country's compact vehicle industry and technological innovation focusing on vehicle safety.

Japan's reputation for compact and city-adaptable vehicle designs aligns perfectly with the compatibility of smart antennas. These antennas are an excellent fit for smaller cars, given their compactness, multi-functionality, and seamless integration potential.

With the ongoing trend of urbanization, the desire for efficient and compact vehicles equipped with advanced connectivity features is on the rise, underscoring the indispensable role of smart antennas in Japan’s automotive sector.

Emergence of Local Tech Companies and Research Activities Boost Sales in India

India’s automotive smart antenna market is poised to exhibit a CAGR of 8.6% during the assessment period. It is expected to attain a market valuation of US$ 337.5 million by 2033.

India's varied geographical terrain encompasses bustling cities as well as remote and less densely populated regions. Smart antennas assume a critical role in ensuring uninterrupted connectivity even in challenging and less urban areas. They effectively fill the connectivity void by delivering dependable and consistent communication, thereby enriching the driving experience throughout the nation.

India boasts a flourishing technological ecosystem that places a strong emphasis on innovation, research, and development. Local tech companies and start-ups in India are energetically engaged in advancing smart antenna technologies. This indigenous innovation is expediting the integration of smart antennas into the country's domestic automotive market.

A wide range of traffic scenarios, each with its complexities, characterizes the road conditions in India. Smart antennas play a pivotal role in enhancing road safety and traffic management by facilitating functions such as collision avoidance systems and instantaneous traffic updates. These capabilities are of paramount importance for ensuring safe and effective travel on roads.

Rising Usage of Smart Antennas in Industrial Processes Driving Demand in Germany

Germany’s automotive smart antenna market size is projected to reach US$ 249.1 million by 2033. Over the assessment period, automotive smart antenna demand in Germany is projected to rise at a 10.2% CAGR. The growth of the automotive smart antenna market in Germany is driven by several factors that underscore the country's distinguished automotive sector, focus on technological prowess, and unwavering dedication to vehicle sustainability.

Germany also places a significant focus on environmental sustainability, and smart antennas play a role in promoting fuel efficiency and emission reduction. They do so by facilitating functionalities such as adaptive cruise control and effective traffic management, which are in harmony with Germany's dedication to lessening the environmental footprint of transportation.

Germany's stature as a significant exporter of automobiles and automotive components provides an avenue for the global dissemination of advanced smart antennas, further catalyzing their uptake in the international automotive market. Germany's worldwide acclaim for its technological prowess, especially in the automotive industry, is well-recognized.

Category-wise Insights

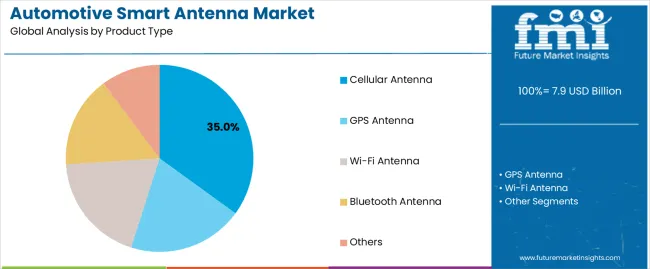
The below section shows the passenger car segment dominated in terms of vehicle type. It is estimated to thrive at an 8.8% CAGR between 2023 and 2033. Based on product type, the cellular antenna segment is anticipated to hold a dominant share through 2033. It is set to exhibit a CAGR of 8.7% during the forecast period.

Top Segment Value-based CAGR (2023 to 2033)
Cellular Antenna (Product Type) 8.7%
Passenger Car (Vehicle Type) 8.8%

Passenger Cars to Gain Traction Globally

Passenger car vehicle type is anticipated to hold a significant volume share of 56.9% in 2023. Over the forecast period, demand for passenger cars is set to rise at a CAGR of 8.8% CAGR. By 2022, the target segment is estimated to reach US$ 3,502.0 million.

Modern consumers anticipate their vehicles to seamlessly integrate with their connected lifestyles, offering unhindered access to a diverse range of digital services while in transit. This encompasses real-time navigation, top-tier infotainment, and the capability to maintain connectivity with their smart devices.

Owners of passenger cars are in pursuit of an elevated in-car entertainment experience. Smart antennas facilitate functionalities such as music and video streaming, along with interactive content, enhancing the overall entertainment environment for passengers during their travels. The growing desire for these entertainment features in passenger cars is propelling the uptake of smart antennas.

Demand for Smart Cellular Antennas to Remain High Through 2033

The growth of the cellular automotive smart antenna segment is propelled by a mix of factors that mirror the evolving landscape of vehicle connectivity and the shifting needs of contemporary vehicles. The cellular antenna segment is projected to thrive at an 8.7% CAGR during the forecast period. It is set to attain a valuation of US$ 5,237.4 million by 2033.

The desire for cellular connectivity in automobiles is on the rise as users look for uninterrupted access to data, voice services, and online resources during their journeys. These antennas have the capability to dynamically adjust their signal direction toward the most robust cellular signal, guaranteeing uninterrupted connectivity even in regions with fluctuating signal strengths.

Cellular automotive smart antennas have a central role in enabling V2X communication, encompassing both vehicle-to-vehicle (V2V) and vehicle-to-infrastructure (V2I) interaction. This technology is essential for advanced driver assistance systems (ADAS) and the enhancement of road safety.

Competitive Landscape

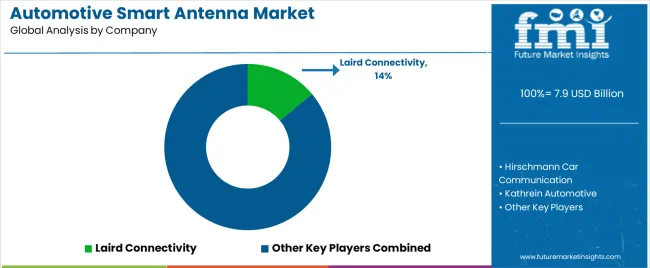
The global automotive smart antenna market is fragmented, with leading players accounting for around 40% to 45% share. Kathrein Automotive, Continental AG, Harada, TE Connectivity, Antenova, Autotalks, Taoglas, Yageo Corporation, Schaffner Group, TDK Corporation, Harman International, NXP Semiconductors, Rosenberger, Ficosa, Anokiwave, and Calearo Antenne S.p.A. are the leading manufacturers and suppliers of automotive smart antennas listed in the report.

Key automotive smart antenna companies are investing in continuous research for producing new products and increasing their production capacity to meet end-user demand. They are also showing an inclination toward adopting strategies, including acquisitions, partnerships, mergers, and facility expansions, to strengthen their footprint.

For instance,

  • In August 2023, TE Connectivity acquired Schaffner to boost its growth and diversification.
  • In July 2022, TE Connectivity acquired Linx Technologies.
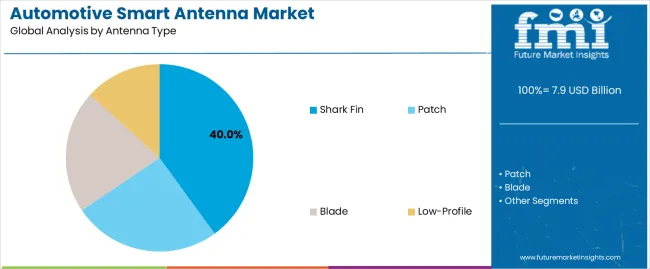
  • In July 2022, Maruti Suzuki announced the launch of a new Hyryder-based SUV called Vitara in India. The car is equipped with an antenna shaped like a shark fin.
  • In May 2022, Hyundai launched a new variant, Business Edition, of the existing midsize sedan Grand i10 Nios, with a shark fin antenna.
  • In October 2022, Robert Bosch invested US$ 260 million to expand electrified product manufacturing at its North Charleston facility.

Automotive Smart Antenna Industry Research Scope

Attribute Details
Estimated Automotive Smart Antenna Market Size (2023) US$ 6,643.2 million
Projected Automotive Smart Antenna Market Size (2033) US$ 15,754.6 million
Anticipated Growth Rate (2023 to 2033) 9.1% CAGR
Historical Data 2018 to 2022
Forecast Period 2023 to 2033
Quantitative Units Value (US$ Million) and Volume (thousand units)
Report Coverage Revenue Forecast, Volume Forecast, Company Ranking, Competitive Landscape, Growth Factors, Trends, and Pricing Analysis
Market Segments Covered
  • Frequency
  • Vehicle Type
  • Product Type
  • Application
  • Sales Chanel
  • Region
Regions Covered
  • North America
  • Latin America
  • Western Europe
  • Eastern Europe
  • East Asia
  • South Asia and Pacific
  • Middle East and Africa
Key Countries Covered
  • United States
  • Canada
  • Mexico
  • Brazil
  • Germany
  • Italy
  • France
  • United Kingdom
  • Spain
  • BENELUX
  • NORDICS
  • Poland
  • Hungary
  • Balkan and Baltics
  • Russia
  • India
  • Association of Southeast Asian Nations
  • Australia and New Zealand
  • China
  • Japan
  • South Korea
  • Kingdom of Saudi Arabia
  • Other GCC Countries
  • Türkiye
  • Other African Union
  • South Africa
Key Companies Profiled
  • Laird Connectivity
  • Hirschmann Car Communication
  • Kathrein Automotive
  • Continental AG
  • Harada
  • TE Connectivity
  • Antenova
  • Autotalks
  • Taoglas
  • Yageo Corporation
  • Linx Technologies
  • Schaffner Group
  • TDK Corporation
  • Harman International (a Samsung company)
  • NXP Semiconductors
  • Rosenberger
  • Ficosa
  • Kyocera Corporation
  • Anokiwave
  • Calearo Antenne S.p.A.

Automotive Smart Antenna Market Segmentation

By Frequency:

  • Ultra High Frequency
  • Very High Frequency
  • Microwaves

By Vehicle Type:

  • Passenger Car
  • LCV
  • HCV
  • Electric Vehicle

By Product Type:

  • Cellular Antenna
  • GPS Antenna
  • Wi-Fi Antenna
  • Bluetooth Antenna
  • Others

By Application:

  • Exterior
  • Interior

By Sales Channel:

  • OEM
  • Aftermarket

By Region:

  • North America
  • Latin America
  • Western Europe
  • Eastern Europe
  • East Asia
  • South Asia and Pacific
  • Middle East and Africa

Frequently Asked Questions

What was the value of the global market in 2022?

The global market was valued at US$ 6,130.1 million in 2022.

How big is the automotive smart antenna market?

The global market value is set to reach US$ 6,643.2 million in 2023.

At what rate will the global demand rise through 2033?

Global automotive smart antenna demand is anticipated to rise at a 9.1% CAGR.

What is the expected market size in 2033?

The global automotive smart antenna market size is set to reach US$ 15,754.6 million by 2033.

Which vehicle type segment is expected to lead the market?

The passenger car segment is expected to lead the market with a CAGR of 8.8% by 2033.

What are the different types of automotive smart antennas?

Cellular antennas, GPS antennas, Wi-Fi antennas, Bluetooth antennas, and others.

Table of Content

1. Executive Summary

    1.1. Global Market Outlook

    1.2. Demand Side Trends

    1.3. Supply Side Trends

    1.4. Analysis and Recommendations

2. Market Overview

    2.1. Market Coverage / Taxonomy

    2.2. Market Definition / Scope / Limitations

3. Key Market Trends

    3.1. Key Trends Impacting the Market

    3.2. Product Innovation / Development Trends

4. Key Success Factors

    4.1. Product Adoption / Usage Analysis

    4.2. Product USPs / Features

    4.3. Strategic Promotional Strategies

5. Global Market Demand Analysis 2018 to 2022 and Forecast, 2023 to 2033

    5.1. Historical Market Volume (000’ Units) Analysis, 2018 to 2022

    5.2. Current and Future Market Volume (000’ Units) Projections, 2023 to 2033

    5.3. Y-o-Y Growth Trend Analysis

6. Global Market - Pricing Analysis

    6.1. Regional Pricing Analysis By Frequency

    6.2. Global Average Pricing Analysis Benchmark

7. Global Market Demand (in Value or Size in US$ Million) Analysis 2018 to 2022 and Forecast, 2023 to 2033

    7.1. Historical Market Value (US$ Million) Analysis, 2018 to 2022

    7.2. Current and Future Market Value (US$ Million) Projections, 2023 to 2033

        7.2.1. Y-o-Y Growth Trend Analysis

        7.2.2. Absolute $ Opportunity Analysis

8. Market Background

    8.1. Macro-Economic Factors

        8.1.1. Global GDP Growth Outlook

        8.1.2. Global Automotive industry Overview

        8.1.3. Manufacturing Value-Added

        8.1.4. Industry Value Added

        8.1.5. Parent Market Outlook

        8.1.6. Other Macro-Economic Factors

    8.2. Forecast Factors - Relevance and Impact

        8.2.1. Top Companies Historical Growth

        8.2.2. GDP Growth forecast

        8.2.3. Manufacturing Industry forecast

        8.2.4. Global Urbanization Growth Outlook

        8.2.5. Business Climate

        8.2.6. Covid-19 Impact Assessment

        8.2.7. End-use Industry Growth Outlook

    8.3. Value Chain

        8.3.1. Product Manufacturers

        8.3.2. End Users

        8.3.3. Avg. Profitability Margins

    8.4. COVID-19 Crisis - Impact Assessment

        8.4.1. Current Statistics

        8.4.2. Short-Mid-Long Term Outlook

        8.4.3. Likely Rebound

    8.5. Market Dynamics

        8.5.1. Drivers

        8.5.2. Restraints

        8.5.3. Opportunity Analysis

9. Global Market Analysis 2018 to 2022 and Forecast 2023 to 2033, By Frequency

    9.1. Introduction / Key Findings

    9.2. Historical Market Size (US$ Million) and Volume Analysis By Frequency, 2018 to 2022

    9.3. Current and Future Market Size (US$ Million) and Volume Analysis and Forecast By Frequency, 2023 to 2033

        9.3.1. Ultra High Frequency

        9.3.2. Very High Frequency

        9.3.3. Microwaves

    9.4. Market Attractiveness Analysis By Frequency

10. Global Market Analysis 2018 to 2022 and Forecast 2023 to 2033, By Vehicle Type

    10.1. Introduction / Key Findings

    10.2. Historical Market Size (US$ Million) and Volume Analysis By Vehicle Type, 2018 to 2022

    10.3. Current and Future Market Size (US$ Million) and Volume Analysis and Forecast By Vehicle Type, 2023 to 2033

        10.3.1. Passenger Car

        10.3.2. LCV

        10.3.3. HCV

        10.3.4. Electric Vehicle

    10.4. Market Attractiveness Analysis By Vehicle Type

11. Global Market Analysis 2018 to 2022 and Forecast 2023 to 2033, By Application

    11.1. Introduction / Key Findings

    11.2. Historical Market Size (US$ Million) and Volume Analysis By Application, 2018 to 2022

    11.3. Current and Future Market Size (US$ Million) and Volume Analysis and Forecast By Application, 2023 to 2033

        11.3.1. Exterior

        11.3.2. Interior

    11.4. Market Attractiveness Analysis By Application

12. Global Market Analysis 2018 to 2022 and Forecast 2023 to 2033, By Sales Channel

    12.1. Introduction / Key Findings

    12.2. Historical Market Size (US$ Million) and Volume Analysis By Sales Channel, 2018 to 2022

    12.3. Current and Future Market Size (US$ Million) and Volume Analysis and Forecast By Sales Channel, 2023 to 2033

        12.3.1. OEM

        12.3.2. Aftermarket

    12.4. Market Attractiveness Analysis By Sales Channel

13. Global Market Analysis 2018 to 2022 and Forecast 2023 to 2033, By Product Type

    13.1. Introduction / Key Findings

    13.2. Historical Market Size (US$ Million) and Volume Analysis By Product Type, 2018 to 2022

    13.3. Current and Future Market Size (US$ Million) and Volume Analysis and Forecast By Product Type, 2023 to 2033

        13.3.1. Cellular Antenna

        13.3.2. GPS Antenna

        13.3.3. Wi-Fi Antenna

        13.3.4. Bluetooth Antenna

        13.3.5. Others

    13.4. Market Attractiveness Analysis By Product Type

14. Global Market Analysis 2018 to 2022 and Forecast 2023 to 2033, by Region

    14.1. Introduction

    14.2. Historical Market Size (US$ Million) and Volume Analysis By Region, 2018 to 2022

    14.3. Current Market Size (US$ Million) and Volume Analysis and Forecast By Region, 2023 to 2033

        14.3.1. North America

        14.3.2. Latin America

        14.3.3. Western Europe

        14.3.4. Eastern Europe

        14.3.5. Middle East and Africa

        14.3.6. East Asia

        14.3.7. South Asia and Pacific

    14.4. Market Attractiveness Analysis By Region

15. North America Market Analysis 2018 to 2022 and Forecast 2023 to 2033

    15.1. Introduction

    15.2. Pricing Analysis

    15.3. Historical Market Size (US$ Million) and Volume Trend Analysis By Market Taxonomy, 2018 to 2022

    15.4. Market Size (US$ Million) and Volume Forecast By Market Taxonomy, 2023 to 2033

        15.4.1. By Country

            15.4.1.1. United States

            15.4.1.2. Canada

            15.4.1.3. Mexico

        15.4.2. By Frequency

        15.4.3. By Vehicle Type

        15.4.4. By Application

        15.4.5. By Sales Channel

        15.4.6. By Product Type

    15.5. Market Attractiveness Analysis

        15.5.1. By Country

        15.5.2. By Frequency

        15.5.3. By Vehicle Type

        15.5.4. By Application

        15.5.5. By Sales Channel

        15.5.6. By Product Type

    15.6. Market Trends

    15.7. Key Market Participants - Intensity Mapping

    15.8. Drivers and Restraints - Impact Analysis

16. Latin America Market Analysis 2018 to 2022 and Forecast 2023 to 2033

    16.1. Introduction

    16.2. Pricing Analysis

    16.3. Historical Market Size (US$ Million) and Volume Trend Analysis By Market Taxonomy, 2018 to 2022

    16.4. Market Size (US$ Million) and Volume Forecast By Market Taxonomy, 2023 to 2033

        16.4.1. By Country

            16.4.1.1. Brazil

            16.4.1.2. Chile

            16.4.1.3. Rest of Latin America

        16.4.2. By Frequency

        16.4.3. By Vehicle Type

        16.4.4. By Application

        16.4.5. By Sales Channel

        16.4.6. By Product Type

    16.5. Market Attractiveness Analysis

        16.5.1. By Country

        16.5.2. By Frequency

        16.5.3. By Vehicle Type

        16.5.4. By Application

        16.5.5. By Sales Channel

        16.5.6. By Product Type

    16.6. Market Trends

    16.7. Key Market Participants - Intensity Mapping

    16.8. Drivers and Restraints - Impact Analysis

17. Western Europe Market Analysis 2018 to 2022 and Forecast 2023 to 2033

    17.1. Introduction

    17.2. Pricing Analysis

    17.3. Historical Market Size (US$ Million) and Volume Trend Analysis By Market Taxonomy, 2018 to 2022

    17.4. Market Size (US$ Million) and Volume Forecast By Market Taxonomy, 2023 to 2033

        17.4.1. By Country

            17.4.1.1. Germany

            17.4.1.2. Italy

            17.4.1.3. France

            17.4.1.4. United Kingdom

            17.4.1.5. Spain

            17.4.1.6. BENELUX

            17.4.1.7. NORDICS

            17.4.1.8. Rest of Western Europe

        17.4.2. By Frequency

        17.4.3. By Vehicle Type

        17.4.4. By Application

        17.4.5. By Sales Channel

        17.4.6. By Product Type

    17.5. Market Attractiveness Analysis

        17.5.1. By Country

        17.5.2. By Frequency

        17.5.3. By Vehicle Type

        17.5.4. By Application

        17.5.5. By Sales Channel

        17.5.6. By Product Type

    17.6. Market Trends

    17.7. Key Market Participants - Intensity Mapping

    17.8. Drivers and Restraints - Impact Analysis

18. Eastern Europe Market Analysis 2018 to 2022 and Forecast 2023 to 2033

    18.1. Introduction

    18.2. Pricing Analysis

    18.3. Historical Market Size (US$ Million) and Volume Trend Analysis By Market Taxonomy, 2018 to 2022

    18.4. Market Size (US$ Million) and Volume Forecast By Market Taxonomy, 2023 to 2033

        18.4.1. By Country

            18.4.1.1. Russia

            18.4.1.2. Balkan and Baltics

            18.4.1.3. Poland

            18.4.1.4. Hungary

            18.4.1.5. Rest of Eastern Europe

        18.4.2. By Frequency

        18.4.3. By Vehicle Type

        18.4.4. By Application

        18.4.5. By Sales Channel

        18.4.6. By Product Type

    18.5. Market Attractiveness Analysis

        18.5.1. By Country

        18.5.2. By Frequency

        18.5.3. By Vehicle Type

        18.5.4. By Application

        18.5.5. By Sales Channel

        18.5.6. By Product Type

    18.6. Market Trends

    18.7. Key Market Participants - Intensity Mapping

    18.8. Drivers and Restraints - Impact Analysis

19. South Asia and Pacific Market Analysis 2018 to 2022 and Forecast 2023 to 2033

    19.1. Introduction

    19.2. Pricing Analysis

    19.3. Historical Market Size (US$ Million) and Volume Trend Analysis By Market Taxonomy, 2018 to 2022

    19.4. Market Size (US$ Million) and Volume Forecast By Market Taxonomy, 2023 to 2033

        19.4.1. By Country

            19.4.1.1. India

            19.4.1.2. Association of Southeast Asian Nations

            19.4.1.3. Oceania

            19.4.1.4. Rest of South Asia and Pacific

        19.4.2. By Frequency

        19.4.3. By Vehicle Type

        19.4.4. By Application

        19.4.5. By Sales Channel

        19.4.6. By Product Type

    19.5. Market Attractiveness Analysis

        19.5.1. By Country

        19.5.2. By Frequency

        19.5.3. By Vehicle Type

        19.5.4. By Application

        19.5.5. By Sales Channel

        19.5.6. By Product Type

    19.6. Market Trends

    19.7. Key Market Participants - Intensity Mapping

    19.8. Drivers and Restraints - Impact Analysis

20. East Asia Market Analysis 2018 to 2022 and Forecast 2023 to 2033

    20.1. Introduction

    20.2. Pricing Analysis

    20.3. Historical Market Size (US$ Million) and Volume Trend Analysis By Market Taxonomy, 2018 to 2022

    20.4. Market Size (US$ Million) and Volume Forecast By Market Taxonomy, 2023 to 2033

        20.4.1. By Country

            20.4.1.1. China

            20.4.1.2. Japan

            20.4.1.3. South Korea

        20.4.2. By Frequency

        20.4.3. By Vehicle Type

        20.4.4. By Application

        20.4.5. By Sales Channel

        20.4.6. By Product Type

    20.5. Market Attractiveness Analysis

        20.5.1. By Country

        20.5.2. By Frequency

        20.5.3. By Vehicle Type

        20.5.4. By Application

        20.5.5. By Sales Channel

        20.5.6. By Product Type

    20.6. Market Trends

    20.7. Key Market Participants - Intensity Mapping

    20.8. Drivers and Restraints - Impact Analysis

21. Middle East and Africa Market Analysis 2018 to 2022 and Forecast 2023 to 2033

    21.1. Introduction

    21.2. Pricing Analysis

    21.3. Historical Market Size (US$ Million) and Volume Trend Analysis By Market Taxonomy, 2018 to 2022

    21.4. Market Size (US$ Million) and Volume Forecast By Market Taxonomy, 2023 to 2033

        21.4.1. By Country

            21.4.1.1. Kingdom of Saudi Arabia

            21.4.1.2. Other GCC

            21.4.1.3. Türkiye

            21.4.1.4. South Africa

            21.4.1.5. Other African Union

            21.4.1.6. Rest of Middle East and Africa

        21.4.2. By Frequency

        21.4.3. By Vehicle Type

        21.4.4. By Application

        21.4.5. By Sales Channel

        21.4.6. By Product Type

    21.5. Market Attractiveness Analysis

        21.5.1. By Country

        21.5.2. By Frequency

        21.5.3. By Vehicle Type

        21.5.4. By Application

        21.5.5. By Sales Channel

        21.5.6. By Product Type

    21.6. Market Trends

    21.7. Key Market Participants - Intensity Mapping

    21.8. Drivers and Restraints - Impact Analysis

22. Country-wise Market Analysis

    22.1. Introduction

        22.1.1. Market Value Proportion Analysis, By Key Countries

        22.1.2. Global Vs. Country Growth Comparison

    22.2. United States Market Analysis

        22.2.1. By Frequency

        22.2.2. By Vehicle Type

        22.2.3. By Application

        22.2.4. By Sales Channel

        22.2.5. By Product Type

    22.3. Canada Market Analysis

        22.3.1. By Frequency

        22.3.2. By Vehicle Type

        22.3.3. By Application

        22.3.4. By Sales Channel

        22.3.5. By Product Type

    22.4. Mexico Market Analysis

        22.4.1. By Frequency

        22.4.2. By Vehicle Type

        22.4.3. By Application

        22.4.4. By Sales Channel

        22.4.5. By Product Type

    22.5. Brazil Market Analysis

        22.5.1. By Frequency

        22.5.2. By Vehicle Type

        22.5.3. By Application

        22.5.4. By Sales Channel

        22.5.5. By Product Type

    22.6. Chile Market Analysis

        22.6.1. By Frequency

        22.6.2. By Vehicle Type

        22.6.3. By Application

        22.6.4. By Sales Channel

        22.6.5. By Product Type

    22.7. Germany Market Analysis

        22.7.1. By Frequency

        22.7.2. By Vehicle Type

        22.7.3. By Application

        22.7.4. By Sales Channel

        22.7.5. By Product Type

    22.8. Italy Market Analysis

        22.8.1. By Frequency

        22.8.2. By Vehicle Type

        22.8.3. By Application

        22.8.4. By Sales Channel

        22.8.5. By Product Type

    22.9. France Market Analysis

        22.9.1. By Frequency

        22.9.2. By Vehicle Type

        22.9.3. By Application

        22.9.4. By Sales Channel

        22.9.5. By Product Type

    22.10. United Kingdom Market Analysis

        22.10.1. By Frequency

        22.10.2. By Vehicle Type

        22.10.3. By Application

        22.10.4. By Sales Channel

        22.10.5. By Product Type

    22.11. Spain Market Analysis

        22.11.1. By Frequency

        22.11.2. By Vehicle Type

        22.11.3. By Application

        22.11.4. By Sales Channel

        22.11.5. By Product Type

    22.12. NORDICS Market Analysis

        22.12.1. By Frequency

        22.12.2. By Vehicle Type

        22.12.3. By Application

        22.12.4. By Sales Channel

        22.12.5. By Product Type

    22.13. Poland Market Analysis

        22.13.1. By Frequency

        22.13.2. By Vehicle Type

        22.13.3. By Application

        22.13.4. By Sales Channel

        22.13.5. By Product Type

    22.14. Hungary Market Analysis

        22.14.1. By Frequency

        22.14.2. By Vehicle Type

        22.14.3. By Application

        22.14.4. By Sales Channel

        22.14.5. By Product Type

    22.15. Russia Market Analysis

        22.15.1. By Frequency

        22.15.2. By Vehicle Type

        22.15.3. By Application

        22.15.4. By Sales Channel

        22.15.5. By Product Type

    22.16. Balkan and Baltics Market Analysis

        22.16.1. By Frequency

        22.16.2. By Vehicle Type

        22.16.3. By Application

        22.16.4. By Sales Channel

        22.16.5. By Product Type

    22.17. China Market Analysis

        22.17.1. By Frequency

        22.17.2. By Vehicle Type

        22.17.3. By Application

        22.17.4. By Sales Channel

        22.17.5. By Product Type

    22.18. Japan Market Analysis

        22.18.1. By Frequency

        22.18.2. By Vehicle Type

        22.18.3. By Application

        22.18.4. By Sales Channel

        22.18.5. By Product Type

    22.19. South Korea Market Analysis

        22.19.1. By Frequency

        22.19.2. By Vehicle Type

        22.19.3. By Application

        22.19.4. By Sales Channel

        22.19.5. By Product Type

    22.20. India Market Analysis

        22.20.1. By Frequency

        22.20.2. By Vehicle Type

        22.20.3. By Application

        22.20.4. By Sales Channel

        22.20.5. By Product Type

    22.21. Association of Southeast Asian Nations Market Analysis

        22.21.1. By Frequency

        22.21.2. By Vehicle Type

        22.21.3. By Application

        22.21.4. By Sales Channel

        22.21.5. By Product Type

    22.22. Australia and New Zealand Market Analysis

        22.22.1. By Frequency

        22.22.2. By Vehicle Type

        22.22.3. By Application

        22.22.4. By Sales Channel

        22.22.5. By Product Type

    22.23. Kingdom of Saudi Arabia Market Analysis

        22.23.1. By Frequency

        22.23.2. By Vehicle Type

        22.23.3. By Application

        22.23.4. By Sales Channel

        22.23.5. By Product Type

    22.24. Other GCC Countries Market Analysis

        22.24.1. By Frequency

        22.24.2. By Vehicle Type

        22.24.3. By Application

        22.24.4. By Sales Channel

        22.24.5. By Product Type

    22.25. South Africa Market Analysis

        22.25.1. By Frequency

        22.25.2. By Vehicle Type

        22.25.3. By Application

        22.25.4. By Sales Channel

        22.25.5. By Product Type

    22.26. Türkiye Market Analysis

        22.26.1. By Frequency

        22.26.2. By Vehicle Type

        22.26.3. By Application

        22.26.4. By Sales Channel

        22.26.5. By Product Type

    22.27. Other African Union Market Analysis

        22.27.1. By Frequency

        22.27.2. By Vehicle Type

        22.27.3. By Application

        22.27.4. By Sales Channel

        22.27.5. By Product Type

23. Market Structure Analysis

    23.1. Market Analysis by Tier of Companies (Automotive Smart Antenna)

    23.2. Market Concentration

    23.3. Market Share Analysis of Top Players

    23.4. Production Capacity Analysis

24. Competition Analysis

    24.1. Competition Dashboard

    24.2. Competition Benchmarking

    24.3. Competition Deep Dive

        24.3.1. Laird Connectivity

            24.3.1.1. Overview

            24.3.1.2. Product Portfolio

            24.3.1.3. Profitability by Market Segments (Product/Channel/Region)

            24.3.1.4. Sales Footprint

            24.3.1.5. Strategy Overview

        24.3.2. Kathrein Automotive

            24.3.2.1. Overview

            24.3.2.2. Product Portfolio

            24.3.2.3. Profitability by Market Segments (Product/Channel/Region)

            24.3.2.4. Sales Footprint

            24.3.2.5. Strategy Overview

        24.3.3. Continental AG

            24.3.3.1. Overview

            24.3.3.2. Product Portfolio

            24.3.3.3. Profitability by Market Segments (Product/Channel/Region)

            24.3.3.4. Sales Footprint

            24.3.3.5. Strategy Overview

        24.3.4. Harada

            24.3.4.1. Overview

            24.3.4.2. Product Portfolio

            24.3.4.3. Profitability by Market Segments (Product/Channel/Region)

            24.3.4.4. Sales Footprint

            24.3.4.5. Strategy Overview

        24.3.5. TE Connectivity

            24.3.5.1. Overview

            24.3.5.2. Product Portfolio

            24.3.5.3. Profitability by Market Segments (Product/Channel/Region)

            24.3.5.4. Sales Footprint

            24.3.5.5. Strategy Overview

        24.3.6. Antenova

            24.3.6.1. Overview

            24.3.6.2. Product Portfolio

            24.3.6.3. Profitability by Market Segments (Product/Channel/Region)

            24.3.6.4. Sales Footprint

            24.3.6.5. Strategy Overview

        24.3.7. Autotalks

            24.3.7.1. Overview

            24.3.7.2. Product Portfolio

            24.3.7.3. Profitability by Market Segments (Product/Channel/Region)

            24.3.7.4. Sales Footprint

            24.3.7.5. Strategy Overview

        24.3.8. Taoglas

            24.3.8.1. Overview

            24.3.8.2. Product Portfolio

            24.3.8.3. Profitability by Market Segments (Product/Channel/Region)

            24.3.8.4. Sales Footprint

            24.3.8.5. Strategy Overview

        24.3.9. Yageo Corporation

            24.3.9.1. Overview

            24.3.9.2. Product Portfolio

            24.3.9.3. Profitability by Market Segments (Product/Channel/Region)

            24.3.9.4. Sales Footprint

            24.3.9.5. Strategy Overview

        24.3.10. Schaffner Group

            24.3.10.1. Overview

            24.3.10.2. Product Portfolio

            24.3.10.3. Profitability by Market Segments (Product/Channel/Region)

            24.3.10.4. Sales Footprint

            24.3.10.5. Strategy Overview

        24.3.11. TDK Corporation

            24.3.11.1. Overview

            24.3.11.2. Product Portfolio

            24.3.11.3. Profitability by Market Segments (Product/Channel/Region)

            24.3.11.4. Sales Footprint

            24.3.11.5. Strategy Overview

        24.3.12. Harman International (a Samsung company)

            24.3.12.1. Overview

            24.3.12.2. Product Portfolio

            24.3.12.3. Profitability by Market Segments (Product/Channel/Region)

            24.3.12.4. Sales Footprint

            24.3.12.5. Strategy Overview

        24.3.13. NXP Semiconductors

            24.3.13.1. Overview

            24.3.13.2. Product Portfolio

            24.3.13.3. Profitability by Market Segments (Product/Channel/Region)

            24.3.13.4. Sales Footprint

            24.3.13.5. Strategy Overview

        24.3.14. Rosenberger

            24.3.14.1. Overview

            24.3.14.2. Product Portfolio

            24.3.14.3. Profitability by Market Segments (Product/Channel/Region)

            24.3.14.4. Sales Footprint

            24.3.14.5. Strategy Overview

        24.3.15. Ficosa

            24.3.15.1. Overview

            24.3.15.2. Product Portfolio

            24.3.15.3. Profitability by Market Segments (Product/Channel/Region)

            24.3.15.4. Sales Footprint

            24.3.15.5. Strategy Overview

        24.3.16. Anokiwave

            24.3.16.1. Overview

            24.3.16.2. Product Portfolio

            24.3.16.3. Profitability by Market Segments (Product/Channel/Region)

            24.3.16.4. Sales Footprint

            24.3.16.5. Strategy Overview

        24.3.17. Calearo Antenne S.p.A.

            24.3.17.1. Overview

            24.3.17.2. Product Portfolio

            24.3.17.3. Profitability by Market Segments (Product/Channel/Region)

            24.3.17.4. Sales Footprint

            24.3.17.5. Strategy Overview

25. Assumptions and Acronyms Used

26. Research Methodology

List of Tables

Table 01: Global Market Value (US$ Million) and Volume (000 Units), Historical Data 2018 to 2022 and Forecast 2023 to 2033 By Vehicle Type

Table 02: Global Market Value (US$ Million) and Volume (000 Units), Historical Data 2018 to 2022 and Forecast 2023 to 2033 By Application

Table 03: Global Market Value (US$ Million) and Volume (000 Units), Historical Data 2018 to 2022 and Forecast 2023 to 2033 By Frequency

Table 04: Global Market Value (US$ Million) and Volume (000 Units), Historical Data 2018 to 2022 and Forecast 2023 to 2033 By Sales Channel

Table 05: Global Market Value (US$ Million) and Volume (000 Units), Historical Data 2018 to 2022 and Forecast 2023 to 2033 By Product Type

Table 06: Global Market Value (US$ Million) and Volume (000 Units), Historical Data 2018 to 2022 and Forecast 2023 to 2033 By Regions

Table 07: North America Market Value (US$ Million) and Volume (000 Units), Historical Data 2018 to 2022 and Forecast 2023 - 2033 by Country

Table 08: North America Market Value (US$ Million) and Volume (000 Units), Historical Data 2018 to 2022 and Forecast 2023 to 2033 By Vehicle Type

Table 09: North America Market Value (US$ Million) and Volume (000 Units), Historical Data 2018 to 2022 and Forecast 2023 to 2033 By Application

Table 10: North America Market Value (US$ Million) and Volume (000 Units), Historical Data 2018 to 2022 and Forecast 2023 to 2033 By Frequency

Table 11: North America Market Value (US$ Million) and Volume (000 Units), Historical Data 2018 to 2022 and Forecast 2023 to 2033 By Sales Channel

Table 12: North America Market Value (US$ Million) and Volume (000 Units), Historical Data 2018 to 2022 and Forecast 2023 to 2033 By Product Type

Table 13: Latin America Market Size (US$ Million) and Volume (000 Units), Forecast by Country, 2018 to 2033

Table 14: Latin America Market Value (US$ Million) and Volume (000 Units), Historical Data 2018 to 2022 and Forecast 2023 to 2033 By Vehicle Type

Table 15: Latin America Market Value (US$ Million) and Volume (000 Units), Historical Data 2018 to 2022 and Forecast 2023 to 2033 By Application

Table 16: Latin America Market Value (US$ Million) and Volume (000 Units), Historical Data 2018 to 2022 and Forecast 2023 to 2033 By Frequency

Table 17: Latin America Market Value (US$ Million) and Volume (000 Units), Historical Data 2018 to 2022 and Forecast 2023 to 2033 By Sales Channel

Table 18: Latin America Market Value (US$ Million) and Volume (000 Units), Historical Data 2018 to 2022 and Forecast 2023 to 2033 By Product Type

Table 18: Western Europe Volume (000 Units), Forecast by Country, 2018 to 2033

Table 19: Western Europe Volume (000 Units), Forecast by Country, 2018 to 2033

Table 20: Western Europe Market Value (US$ Million) and Volume (000 Units), Historical Data 2018 to 2022 and Forecast 2023 to 2033 By Vehicle Type

Table 21: Western Europe Market Value (US$ Million) and Volume (000 Units), Historical Data 2018 to 2022 and Forecast 2023 to 2033 By Application

Table 21: Western Europe Market Value (US$ Million) and Volume (000 Units), Historical Data 2018 to 2022 and Forecast 2023 to 2033 By Frequency

Table 22: Western Europe Market Value (US$ Million) and Volume (000 Units), Historical Data 2018 to 2022 and Forecast 2023 to 2033 By Sales Channel

Table 23: Western Europe Market Value (US$ Million) and Volume (000 Units), Historical Data 2018 to 2022 and Forecast 2023 to 2033 By Product Type

Table 24 : Eastern Europe Market Size Volume ('000 Units) Forecast by Country, 2018 to 2033

Table 25: Eastern Europe Market Value (US$ Million) and Volume ('000 Units) Historical Data 2018 to 2022 and Forecast 2023 to 2033 By Vehicle Type

Table 26: Eastern Europe Market Value (US$ Million) and Volume ('000 Units) Historical Data 2018 to 2022 and Forecast 2023 to 2033 By Application

Table 27: Eastern Europe Market Value (US$ Million) and Volume ('000 Units) Historical Data 2018 to 2022 and Forecast 2023 to 2033 By Frequency

Table 28: Eastern Europe Market Value (US$ Million) and Volume ('000 Units) Historical Data 2018 to 2022 and Forecast 2023 to 2033 By Sales Channel

Table 29: Eastern Europe Market Value (US$ Million) and Volume ('000 Units) Historical Data 2018 to 2022 and Forecast 2023 to 2033 By Product Type

Table 30: South Asia Pacific Market Size (US$ Million) and Volume ('000 Units) Forecast by Country, 2018 to 2033

Table 31: South Asia Pacific Market Value (US$ Million) and Volume ('000 Units) Historical Data 2018 to 2022 and Forecast 2023 to 2033 By Vehicle Type

Table 32: South Asia Pacific Market Value (US$ Million) and Volume ('000 Units) Historical Data 2018 to 2022 and Forecast 2023 to 2033 By Application

Table 33: South Asia Pacific Market Value (US$ Million) and Volume ('000 Units) Historical Data 2018 to 2022 and Forecast 2023 to 2033 By Frequency

Table 34: South Asia Pacific Market Value (US$ Million) and Volume ('000 Units) Historical Data 2018 to 2022 and Forecast 2023 to 2033 By Sales Channel

Table 35: South Asia Pacific Market Value (US$ Million) and Volume ('000 Units) Historical Data 2018 to 2022 and Forecast 2023 to 2033 By Product Type

Table 36: East Asia Market Size (US$ Million) and Volume ('000 Units) Forecast by Country, 2018 to 2033

Table 37: East Asia Market Value (US$ Million) and Volume ('000 Units) Historical Data 2018 to 2022 and Forecast 2023 to 2033 By Vehicle Type

Table 38: East Asia Market Value (US$ Million) and Volume ('000 Units) Historical Data 2018 to 2022 and Forecast 2023 to 2033 By Application

Table 39: East Asia Market Value (US$ Million) and Volume ('000 Units) Historical Data 2018 to 2022 and Forecast 2023 to 2033 By Frequency

Table 40: East Asia Market Value (US$ Million) and Volume ('000 Units) Historical Data 2018 to 2022 and Forecast 2023 to 2033 By Sales Channel

Table 41: East Asia Market Value (US$ Million) and Volume ('000 Units) Historical Data 2018 to 2022 and Forecast 2023 to 2033 By Product Type

Table 42: Middle East and Africa Market Size Volume ('000 Units) Forecast by Country, 2018 to 2033

Table 43: Middle East and Africa Market Value (US$ Million) and Volume ('000 Units) Historical Data 2018 to 2022 and Forecast 2023 to 2033 By Vehicle Type

Table 44: Middle East and Africa Market Value (US$ Million) and Volume ('000 Units) Historical Data 2018 to 2022 and Forecast 2023 to 2033 By Application

Table 45: Middle East and Africa Market Value (US$ Million) and Volume ('000 Units) Historical Data 2018 to 2022 and Forecast 2023 to 2033 By Frequency

Table 46: Middle East and Africa Market Value (US$ Million) and Volume ('000 Units) Historical Data 2018 to 2022 and Forecast 2023 to 2033 By Sales Channel

Table 47: Middle East and Africa Market Value (US$ Million) and Volume ('000 Units) Historical Data 2018 to 2022 and Forecast 2023 to 2033 By Product Type

List of Charts

Figure 01: Global Market Historical Volume (000 Units), 2018 to 2022

Figure 02: Global Market Current and Forecast Volume (000 Units),2023 to 2033

Figure 03: Global Historical Market Size (USD Million) (2018 to 2022)

Figure 04: Global Market Absolute $ Opportunity Analysis (2018 to 2033)

Figure 05: Global Market Size (USD Million) and YOY Growth (%) (2023 to 2033)

Figure 06: Global Market Share and BPS Analysis by Vehicle Type - 2023 to 2033

Figure 07: Global Market Y-o-Y Growth Projections by Vehicle Type, 2022 to 2033

Figure 08: Global Market Attractiveness by Vehicle Type, 2023 to 2033

Figure 09: Global Market Incremental $ Opportunity by Vehicle Type,

Figure 10: Global Market Share and BPS Analysis By Application,2023 to 2033

Figure 11: Global Market Y-o-Y Growth Projections By Application, 2022 to 2033

Figure 12: Global Market Attractiveness By Application, 2023 to 2033

Figure 13: Global Market Incremental $ Opportunity by Application,

Figure 14: Global Market Share and BPS Analysis by Frequency- 2023 to 2033

Figure 15: Global Market Y-o-Y Growth Projections by Frequency, 2022 to 2033

Figure 16: Global Market Attractiveness by Frequency, 2023 to 2033

Figure 17: Global Market Incremental $ Opportunity by Frequency,

Figure 18: Global Market Share and BPS Analysis by Sales Channel - 2023 to 2033

Figure 19: Global Market Y-o-Y Growth Projections by Sales Channel 2022 to 2033

Figure 20: Global Market Attractiveness by Sales Channel, 2023 to 2033

Figure 21: Global Market Incremental $ Opportunity by Sales Channel,

Figure 22: Global Market Share and BPS Analysis by Product Type - 2023 to 2033

Figure 23: Global Market Y-o-Y Growth Projections by Product Type, 2022 to 2033

Figure 24: Global Market Attractiveness by Product Type, 2023 to 2033

Figure 25: Global Market Incremental $ Opportunity by Product Type,

Figure 26: Global Market Share and BPS Analysis by Regions - 2023 to 2033

Figure 27: Global Market Y-o-Y Growth Projections by Regions, 2022 to 2033

Figure 28: Global Market Attractiveness by Regions, 2023 to 2033

Figure 29: Global Market Incremental $ Opportunity by Region,

Figure 30: North America Market Share and BPS Analysis

Figure 31: North America Market Y-o-Y Growth Projections

Figure 32: North America Market Attractiveness by Country, 2023 to 2033

Figure 33: North America Market Share and BPS Analysis by Vehicle Type - 2023 to 2033

Figure 34: North America Market Y-o-Y Growth Projections by Vehicle Type, 2022 to 2033

Figure 35: North America Market Attractiveness by Vehicle Type, 2023 to 2033

Figure 36: North America Market Share and BPS Analysis By Application,2023 to 2033

Figure 37: North America Market Y-o-Y Growth Projections By Application, 2022 to 2033

Figure 38: North America Market Attractiveness By Application, 2023 to 2033

Figure 39: North America Market Share and BPS Analysis by Frequency- 2023 to 2033

Figure 40: North America Market Y-o-Y Growth Projections by Frequency, 2022 to 2033

Figure 41: North America Market Attractiveness by Frequency, 2023 to 2033

Figure 42: North America Market Share and BPS Analysis by Sales Channel - 2023 to 2033

Figure 43: North America Market Y-o-Y Growth Projections by Sales Channel 2022 to 2033

Figure 44: North America Market Attractiveness by Sales Channel, 2023 to 2033

Figure 45: North America Market Share and BPS Analysis by Product Type - 2023 to 2033

Figure 46: North America Market Y-o-Y Growth Projections by Product Type, 2022 to 2033

Figure 47: North America Market Attractiveness by Product Type, 2023 to 2033

Figure 48: Latin America Market Share and BPS Analysis by Country, 2023 to 2033

Figure 49: Latin America Market Y-o-Y Growth by Country, 2023 to 2033

Figure 50: Latin America Market Attractiveness Analysis by Country, 2023 to 2033

Figure 51: Latin America Market Share and BPS Analysis by Vehicle Type - 2023 to 2033

Figure 52: Latin America Market Y-o-Y Growth Projections by Vehicle Type, 2022 to 2033

Figure 53: Latin America Market Attractiveness by Vehicle Type, 2023 to 2033

Figure 54: Latin America Market Share and BPS Analysis By Application,2023 to 2033

Figure 55: Latin America Market Y-o-Y Growth Projections By Application, 2022 to 2033

Figure 56: Latin America Market Attractiveness By Application, 2023 to 2033

Figure 57: Latin America Market Share and BPS Analysis by Frequency- 2023 to 2033

Figure 58: Latin America Market Y-o-Y Growth Projections by Frequency, 2022 to 2033

Figure 59: Latin America Market Attractiveness by Frequency, 2023 to 2033

Figure 60: Latin America Market Share and BPS Analysis by Sales Channel - 2023 to 2033

Figure 61: Latin America Market Y-o-Y Growth Projections by Sales Channel 2022 to 2033

Figure 62: Latin America Market Attractiveness by Sales Channel, 2023 to 2033

Figure 63: Latin America Market Share and BPS Analysis by Product Type - 2023 to 2033

Figure 64: Latin America Market Y-o-Y Growth Projections by Product Type, 2022 to 2033

Figure 65: Latin America Market Attractiveness by Product Type, 2023 to 2033

Figure 66: Western Europe Market Share and BPS Analysis by Country, 2023 to 2033

Figure 67: Western Europe Market Y-o-Y Growth by Country, 2023 to 2033

Figure 68: Western Europe Market Attractiveness Analysis by Country, 2023 to 2033

Figure 69: Western Europe Market Share and BPS Analysis by Vehicle Type - 2023 to 2033

Figure 70: Western Europe Market Y-o-Y Growth Projections by Vehicle Type, 2022 to 2033

Figure 71: Western Europe Market Attractiveness by Vehicle Type, 2023 to 2033

Figure 72: Western Europe Market Share and BPS Analysis By Application,2023 to 2033

Figure 73: Western Europe Market Y-o-Y Growth Projections By Application, 2022 to 2033

Figure 74: Western Europe Market Attractiveness By Application, 2023 to 2033

Figure 75: Western Europe Market Share and BPS Analysis by Frequency- 2023 to 2033

Figure 76: Western Europe Market Y-o-Y Growth Projections by Frequency, 2022 to 2033

Figure 77: Western Europe Market Attractiveness by Frequency, 2023 to 2033

Figure 78: Western Europe Market Share and BPS Analysis by Sales Channel - 2023 to 2033

Figure 79: Western Europe Market Y-o-Y Growth Projections by Sales Channel 2022 to 2033

Figure 80: Western Europe Market Attractiveness by Sales Channel, 2023 to 2033

Figure 81: Western Europe Market Share and BPS Analysis by Product Type - 2023 to 2033

Figure 82: Western Europe Market Y-o-Y Growth Projections by Product Type, 2022 to 2033

Figure 83: Western Europe Market Attractiveness by Product Type, 2023 to 2033

Figure 84: Eastern Europe Market Share and BPS Analysis by Country, 2023 to 2033

Figure 85: Eastern Europe Market Y-o-Y Growth by Country, 2023 to 2033

Figure 86: Eastern Europe Market Attractiveness Analysis by Country, 2023 to 2033

Figure 87: Eastern Europe Market Share and BPS Analysis by Vehicle Type - 2023 to 2033

Figure 88: Eastern Europe Market Y-o-Y Growth Projections by Vehicle Type, 2022 to 2033

Figure 89: Eastern Europe Market Attractiveness by Vehicle Type, 2023 to 2033

Figure 90: Eastern Europe Market Share and BPS Analysis By Application,2023 to 2033

Figure 91: Eastern Europe Market Y-o-Y Growth Projections By Application, 2022 to 2033

Figure 92: Eastern Europe Market Attractiveness By Application, 2023 to 2033

Figure 93: Eastern Europe Market Share and BPS Analysis by Frequency- 2023 to 2033

Figure 94: Eastern Europe Market Y-o-Y Growth Projections by Frequency, 2022 to 2033

Figure 95: Eastern Europe Market Attractiveness by Frequency, 2023 to 2033

Figure 96: Eastern Europe Market Share and BPS Analysis by Sales Channel - 2023 to 2033

Figure 97: Eastern Europe Market Y-o-Y Growth Projections by Sales Channel 2022 to 2033

Figure 98: Eastern Europe Market Attractiveness by Sales Channel, 2023 to 2033

Figure 99: Eastern Europe Market Share and BPS Analysis by Product Type - 2023 to 2033

Figure 100: Eastern Europe Market Y-o-Y Growth Projections by Product Type, 2022 to 2033

Figure 101: Eastern Europe Market Attractiveness by Product Type, 2023 to 2033

Figure 102: South Asia Pacific Market Share and BPS Analysis by Country, 2023 to 2033

Figure 103: South Asia Pacific Market Y-o-Y Growth by Country, 2023 to 2033

Figure 104: South Asia Pacific Market Attractiveness Analysis by Country, 2023 to 2033

Figure 105: South Asia Pacific Market Share and BPS Analysis by Vehicle Type - 2023 to 2033

Figure 106: South Asia Pacific Market Y-o-Y Growth Projections by Vehicle Type, 2022 to 2033

Figure 107: South Asia Pacific Market Attractiveness by Vehicle Type, 2023 to 2033

Figure 108: South Asia Pacific Market Share and BPS Analysis By Application,2023 to 2033

Figure 109: South Asia Pacific Market Y-o-Y Growth Projections By Application, 2022 to 2033

Figure 110: South Asia Pacific Market Attractiveness By Application, 2023 to 2033

Figure 111: South Asia Pacific Market Share and BPS Analysis by Frequency- 2023 to 2033

Figure 112: South Asia Pacific Market Y-o-Y Growth Projections by Frequency, 2022 to 2033

Figure 113: South Asia Pacific Market Attractiveness by Frequency, 2023 to 2033

Figure 114: South Asia Pacific Market Share and BPS Analysis by Sales Channel - 2023 to 2033

Figure 115: South Asia Pacific Market Y-o-Y Growth Projections by Sales Channel 2022 to 2033

Figure 116: South Asia Pacific Market Attractiveness by Sales Channel, 2023 to 2033

Figure 117: South Asia Pacific Market Share and BPS Analysis by Product Type - 2023 to 2033

Figure 118: South Asia Pacific Market Y-o-Y Growth Projections by Product Type, 2022 to 2033

Figure 119: South Asia Pacific Market Attractiveness by Product Type, 2023 to 2033

Figure 120: East Asia Market Share and BPS Analysis by Country, 2023 to 2033

Figure 121: East Asia Market Y-o-Y Growth by Country, 2023 to 2033

Figure 122: East Asia Market Attractiveness Analysis by Country, 2023 to 2033

Figure 123: East Asia Market Share and BPS Analysis by Vehicle Type - 2023 to 2033

Figure 124: East Asia Market Y-o-Y Growth Projections by Vehicle Type, 2022 to 2033

Figure 125: East Asia Market Attractiveness by Vehicle Type, 2023 to 2033

Figure 126: East Asia Market Share and BPS Analysis By Application,2023 to 2033

Figure 127: East Asia Market Y-o-Y Growth Projections By Application, 2022 to 2033

Figure 128: East Asia Market Attractiveness By Application, 2023 to 2033

Figure 129: East Asia Market Share and BPS Analysis by Frequency- 2023 to 2033

Figure 130: East Asia Market Y-o-Y Growth Projections by Frequency, 2022 to 2033

Figure 131: East Asia Market Attractiveness by Frequency, 2023 to 2033

Figure 132: East Asia Market Share and BPS Analysis by Sales Channel - 2023 to 2033

Figure 133: East Asia Market Y-o-Y Growth Projections by Sales Channel 2022 to 2033

Figure 134: East Asia Market Attractiveness by Sales Channel, 2023 to 2033

Figure 135: East Asia Market Share and BPS Analysis by Product Type - 2023 to 2033

Figure 136: East Asia Market Y-o-Y Growth Projections by Product Type, 2022 to 2033

Figure 137: East Asia Market Attractiveness by Product Type, 2023 to 2033

Figure 138: Middle East and Africa Market Share and BPS Analysis by Country, 2023 to 2033

Figure 139: Middle East and Africa Market Y-o-Y Growth by Country, 2023 to 2033

Figure 140: Middle East and Africa Market Attractiveness Analysis by Country, 2023 to 2033

Figure 141: Middle East and Africa Market Share and BPS Analysis by Vehicle Type - 2023 to 2033

Figure 142: Middle East and Africa Market Y-o-Y Growth Projections by Vehicle Type, 2022 to 2033

Figure 143: Middle East and Africa Market Attractiveness by Vehicle Type, 2023 to 2033

Figure 144: Middle East and Africa Market Share and BPS Analysis By Application,2023 to 2033

Figure 145: Middle East and Africa Market Y-o-Y Growth Projections By Application, 2022 to 2033

Figure 146: Middle East and Africa Market Attractiveness By Application, 2023 to 2033

Figure 147: Middle East and Africa Market Share and BPS Analysis by Frequency- 2023 to 2033

Figure 148: Middle East and Africa Market Y-o-Y Growth Projections by Frequency, 2022 to 2033

Figure 149: Middle East and Africa Market Attractiveness by Frequency, 2023 to 2033

Figure 150: Middle East and Africa Market Share and BPS Analysis by Sales Channel - 2023 to 2033

Figure 151: Middle East and Africa Market Y-o-Y Growth Projections by Sales Channel 2022 to 2033

Figure 152: Middle East and Africa Market Attractiveness by Sales Channel, 2023 to 2033

Figure 153: Middle East and Africa Market Share and BPS Analysis by Product Type - 2023 to 2033

Figure 154: Middle East and Africa Market Y-o-Y Growth Projections by Product Type, 2022 to 2033

Figure 155: Middle East and Africa Market Attractiveness by Product Type, 2023 to 2033

Recommendations

Automotive

Automotive Brake System & Components Market

Published : July 2023

Automotive

Automotive Wiring Harness Market

Published : July 2023

Automotive

Automotive Interior Ambient Lighting System Market

Published : July 2023

Automotive

Automotive Soft Trim Interior Materials Market

Published : July 2023

Explore Automotive Insights

View Reports

Automotive Smart Antenna Market