HVDC Transmission Systems Market
Market Insights on HVDC Transmission Systems covering sales outlook, demand forecast & up-to-date key trends
HVDC Transmission System Market By System Component (HVDC Transmission System Solution, HVDC Transmission System Services), Technology (LCC, VSC), Deployment ( Overhead, Underground, Subsea, Combination) & Region - Forecast 2022 - 2028
HVDC Transmission System Market Overview (2022-2028)
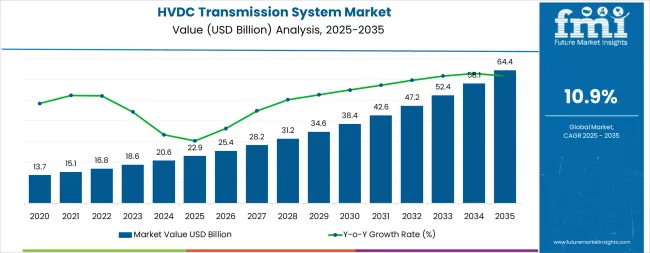
[236 Pages Report] Expanding at a CAGR of 8.9%, the global HVDC transmission system market is projected to increase from a valuation of US$ 10.3 Bn in 2022 to US$ 17.2 Bn by 2028. The HVDC transmission system demand accounted for almost 15% market share of global power transmission market.
2022 Market Value |
US$ 10.3 Bn |
2028 Market Value |
US$ 17.2 Bn |
CAGR% (2022-2028) |
8.9% |
Share of Top 5 Market Players |
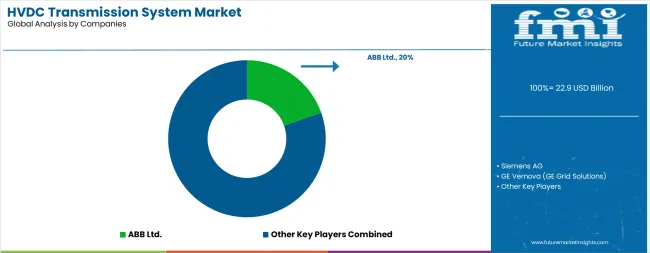
~40% |
The HVDC (High voltage direct current) transmission systems are used for transmission of power over long distance. These systems use direct current for power transmission. The HVDC transmission uses two technologies namely Line Commutated Converter (LCC) and Voltage Source Converter (VSC).
The Line Commutated Converter is a very economical technology based on thyristor power semiconductors. Increasing demand for HVDC transmission system components such as AC & DC harmonic filters, converters, DC lines, circuit breakers to enable system security is the current trend in the HVDC transmission system market.
Let us know your requirement to get
100% FREE customization
How The Market Progressed Till June 2022?
Market Statistics |
Details |
H1,2021 (A) |
9.5% |
H1,2022 Projected (P) |
9.0% |
H1,2022 Outlook (O) |
8.6% |
BPS Change : H1,2022 (O) - H1,2022 (P) |
(-) 40 ↓ |
BPS Change : H1,2022 (O) - H1,2021 (A) |
(-) 90 ↓ |
Future Market Insights forecasts a comparison and review analysis of the dynamics of the HVDC Transmission Systems Market. The HVDC VSC transmission technology allows for autonomous control of active and reactive power, as well as quick response times in emergency situations. Furthermore, subsequent technological advancements have insured that power transmission businesses take advantage of the benefits of this technology while avoiding the flaws, such as large losses.
The difference in the BPS values observed in the HVDC Transmission Systems Market in H1, 2022 - Outlook over H1, 2022 Projected implies a 40-unit reduction, according to the FMI analysis. Furthermore, compared to H1-2021, the market is anticipated to decline by 90 points in H1-2022. The impacting factors hindering the growth of the market are short circuits in the AC power system and complexity of multi-terminal systems.
HVDC transmission systems have substantial installation and maintenance costs due to the nature of their design. Modern appliances require AC power, which necessitates the installation of converter stations at endpoints to convert DC power to AC power, raising expenses. Hence it is restraining the market growth in H1-2022 as compared to H1-2021.
Demand Analysis Of HVDC Transmission Systems From 2013-2021 Vs Market Outlook For 2022-2028
The global HVDC transmission systems market was valued at ~US$ 5.4 Bn in 2013. HVDC (High Voltage Direct Current) transmission system vendors are focused on maintaining long-term partnership with the consumer to increase market share in the global market.
The demand for HVDC transmission systems rose with a CAGR of 7.3% during the period 2013-2021. The major driving factors are the requirement of low investments as well as low potential losses and ability to transfer power between separate alternating current networks.
High-voltage direct current transmission systems possess the ability to transfer electric power between separate alternating current networks. This power transfer can be autonomously controlled by the HVDC transmission systems to support individual networks during transient conditions. In fact, the integration of at least one HVDC link in an alternating current grid can improve the overall system controllability.
What’s The Requirement Of Low Investments As Well As Low Potential Losses To Fuel HVDC Transmission Systems Market Growth?
The long-distance P2P high-voltage direct current transmission concept does not demand high overall investments. HVDC transmission systems also incur low losses as compared to equivalent alternating current transmission variants.
Although the installation of high-voltage direct current conversion equipment at terminal stations is expensive, the expenditure incurred by the total direct current transmission line over long distances is considerably lower than the alternating current transmission line installed over the same distance.
HVDC transmission systems demand comparatively less conductor per unit distance than an alternating current transmission system. This factor is estimated to propel the adoption of HVDC transmission systems during the forecast period.
Find your sweet spots for generating winning opportunities in this market.
Talk to AnalystHow Has COVID-19 Crisis Impacted The Sales Of HVDC Transmission Systems?
The global components of HVDC transmission systems are forecast to declining in the last one and half years owing to supply chain disruptions caused by the COVID-19 outbreak. There is government rules and municipal governments established strict restrictions, and all non-essential activity were halted. Because end users' activities were halted, this had a negative impact on the HVDC transmission systems industry.
The HVDC transmission systems market is expected to witness a rebound from the second to the third quarter of 2022. There is continuous development and implementation of new technology/solution such as AC & DC harmonic filters, DC lines and circuit breakers for improve transmission line efficiency, and allowing power to be transferred more quickly.
Country-Wise Insights
How will Canada Sales of HVDC Transmission Systems Shape up?
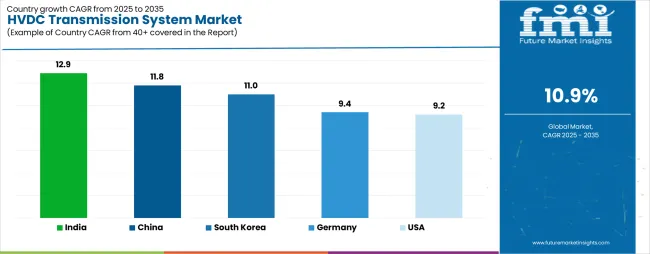
North America is expected to remain one of the most attractive markets during the forecast period. In the North America region, Canada is estimated to grow with a robust CAGR of around 9.0% during the forecast period. The Canada HVDC transmission systems market is expected reach 1.7X by 2028.
HVDC technology-based end-to-end P2P long haul bulk electric power transmission systems are incorporated without intermediate terminal ‘taps.’ These HVDC power transmission systems are usually incorporated to establish a connection between the main electrical grid and a remote generating plant. For instance, Canada has established an HVDC power transmission network at the Nelson River.
What Makes BENELUX A Hub For HVDC Transmission Systems Demand?
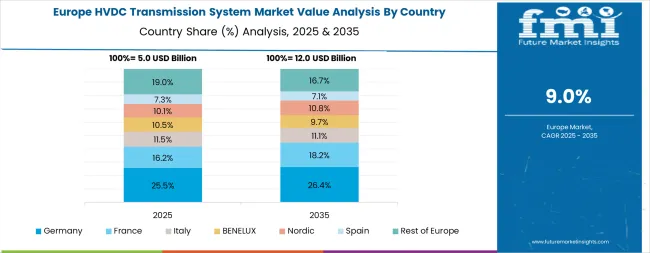
BENELUX market is set to register exponential demand growth of HVDC transmission systems in the Western Europe region with a CAGR of nearly 8.6% during 2022-28. The BENELUX market is anticipated to create an absolute dollar opportunity of ~US$ 0.19 Bn between 2022 & 2028.
Governments and supporting power infrastructure companies are making high investments to accommodate HVDC-based undersea cable transmission schemes. For instance, a 580 kilometer HVDC power transmission cable, NorNed, between Eemshaven in the Netherlands and Feda in Norway, inter-connects the electrical grids of both the countries. Italy has 420-kilometer-long SAPEI HVDC transmission cables that connect the electrical grids of Sardinia and the mainland.
How Japan Is Contributing Towards The Market Growth?
Japan market is set to report the one of the largest consumption of HVDC transmission systems, and market size is expected reach 1.6X by 2027. The Japanese market is anticipated to create an absolute dollar opportunity of ~US$ 0.45 Bn during 2022-28.
Installation of DC lines and advanced converters for connecting AC grids is a rising trend in Japan. Presence of key players such as Toshiba Corporation and Hitachi Ltd. are expected to contribute to growth of HVDC market in the country.

An unified Market Research Subscription Platform, built for today’s disparate research needs.
Category-Wise Insights
Why is Demand for HVDC Transmission System Solution Rising?
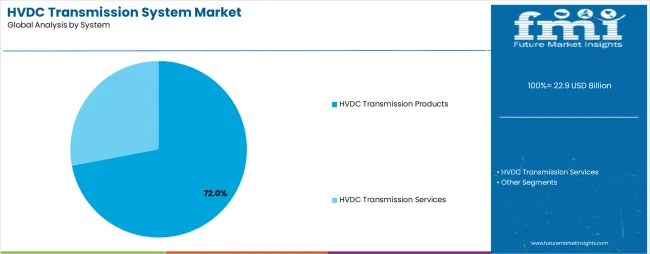
The HVDC transmission system solution segment by system component will dominate the global demand for HVDC transmission system, and expected to grow by 1.5X between 2022 & 2028. Moreover, HVDC transmission system solution segment is set to witness highest growth rate of nearly 9.1% CAGR during 2022-28.
For transmission of electricity over longer distances, HVDC transmission systems solutions are preferred over HVAC transmission systems, owing to the fact that underground AC transmission lines – that stretch over long distances – are not capable of delivering a significant amount of electricity as the electricity gets absorbed by cables. As connecting offshore wind farms to the grid requires transmission over long distances, HVDC transmission systems are ideal.
Why HVDC Transmission System mostly preferred in Deployment Category?
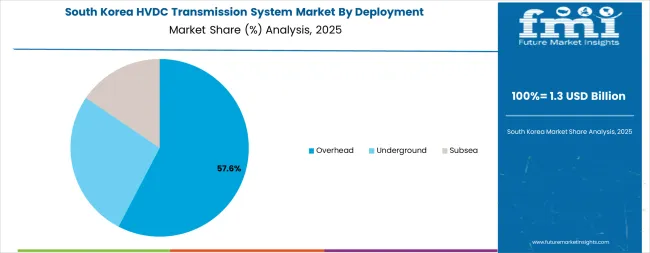
The overhead deployment segment is expected to reach nearly 33% market share in the global HVDC transmission system market in 2028. However, subsea & underground cables are gaining popularity as these cables transmit lower losses than overhead cables.
Power generation plants are harnessing power using naturally existing renewable resources, such as wind. These renewable resources are being integrated into the main power transmission grids. HVDC technology-based overhead cable lines have been undertaken in the Asia Pacific (excluding Japan) region for several onshore as well offshore projects.
Why is Demand Rising in the Voltage Source Converter (VSC) Technology Segment?
On the basis of technology, HVDC transmission system is sub-segmented Line Commutated Converter (LCC), Voltage Source Converter (VSC) and others. Voltage Source Converter (VSC) technology segment is set to expand at a CAGR of 10.6% from 2022 to 2028.
The Voltage Source Converter is a new technology in HVDC transmission system market. It is based on power transistors. This technology is widely used in submarine/land cable interconnection, integrating renewables, offshore and urban applications. The VSC technology is in many schemes including point to point, back to back and others.
How the 2000 MW & above Power Rating Likely to Impact the Market Trend?
The market size of 2000 MW & above segment, by power rating is set to showcase a significant growth rate of nearly 10.6% over the forecast period. In addition, the segment is set to register the absolute $ opportunity of close to US$ 3.0 Bn between 2022 & 2028.
2000 MW & above segment is anticipated to remain attractive in terms of CAGR, market share & incremental $ opportunity owing to deployment of transmission lines with higher capacity. The 2000 MW & above segment is projected to witness impressive growth during the forecast period, due to rising power demand, integration of renewables, and supportive government policies and initiatives for HVDC transmission.
Competitive Landscape
The HVDC transmission system solution providers also focus on launching innovative solution and expanding its HVDC transmission system solution offerings to deliver enhanced technology as well as offer new and upgraded solutions in new markets. The business alliances strategy helps the company in product development, technological management, and in expanding its customer base.
- In November 2018, ABB Ltd., a pioneering technology leader enabled the world’s first high-voltage direct current (HVDC) grid in China.
- In March 2021, Siemens Limited has announced that it has successfully commissioned India’s first high-voltage direct current (HVDC) link featuring voltage-sourced converter (VSC) technology.
HVDC Transmission System Market Report Scope
Attribute |
Details |
Market value in 2021 |
US$ 9.5 Bn |
Market CAGR 2013 to 2021 |
8.9% |
Share of top 5 players |
Around 40% |
Forecast Period |
2022-2028 |
Historical Data Available for |
2013-2021 |
Market Analysis |
USD Million for Value |
Key regions covered |
North America, Latin America, Western Europe, Eastern Europe, Asia Pacific Excluding Japan, Japan, and Middle East and Africa |
Key countries covered |
US, Canada, Brazil, Mexico, Germany, U.K., France, Spain, Russia, China, India, Malaysia, Singapore, Australia, Japan, GCC countries, Israel, and South Africa |
Key market segments covered |
|
Key companies profiled |
|
Report coverage |
Market forecast, company share analysis, competition intelligence, DROT analysis, market dynamics and challenges, and strategic growth initiatives |
Customization & pricing |
Available upon request |
HVDC Transmission System Market Survey By Category
By System Component:
- HVDC Transmission System Solution
- AC & DC Harmonic Filters
- Converters
- DC Lines
- Circuit Breakers
- Others
- HVDC Transmission System Services
By Technology:
- LCC
- VSC
- Others
By Deployment:
- Overhead
- Underground
- Subsea
- Combination
By Power Rating:
- Below 1000 MW
- 1000 - 2000 MW
- 2000 MW & above
Region:
- North America
- Latin America
- APEJ
- Japan
- Eastern Europe
- Western Europe
- MEA
Frequently Asked Questions
The global HVDC transmission system market is valued at nearly US$ 9.5 Bn in 2021.
The upgrading and replacing existing infrastructure is a prominent trend in the U.S., and growing transmission network across the globe creates significant opportunities for the vendors are some of the factors driving the growth of HVDC transmission system market.
From 2013 to 2021, demand for HVDC transmission system increased at a CAGR of nearly 7.3%.
The HVDC transmission system market is projected to increase at 8.9% CAGR and is projected to be valued at around US$ 17.2 Bn by 2028.
The Brazil, India, Germany, China, and Japan are major demand countries for HVDC transmission system.
1. Executive Summary
1.1. Global Market Outlook
1.2. Demand Side Trends
1.3. Supply Side Trends
1.4. Analysis and Recommendations
2. Market Overview
2.1. Market Coverage / Taxonomy
2.2. Market Definition / Scope / Limitations
3. Key Market Trends
3.1. Key Trends Impacting the Market
3.2. Product Innovation / Development Trends
4. HVDC Transmission Systems - Pricing Analysis
4.1. Pricing Analysis, By Component Type
4.2. Average Pricing Benchmark Analysis
5. HVDC Transmission Systems Market Demand Analysis 2013-2021 and Forecast, 2022-2028
5.1. Historical Market Size (US$ Mn) Analysis, 2013-2021
5.2. Current and Future Market Size (US$ Mn) Projections, 2022-2028
5.3. Y-o-Y Growth Trend Analysis
6. Market Background
6.1. Macro-Economic Factors
6.2. Forecast Factors – Relevance & Impact
6.3. Value Chain Analysis
6.4. Market Dynamics
6.4.1. Drivers
6.4.2. Restraints
6.4.3. Opportunity Analysis
7. HVDC Transmission Systems Market Analysis 2013-2021 and Forecast 2022-2028, by System Component
7.1. Introduction / Key Findings
7.2. Historical Market Size (US$ Mn) Analysis By System Component, 2013 - 2021
7.3. Current and Future Market Size (US$ Mn) Analysis and Forecast By System Component, 2022 - 2028
7.3.1. HVDC Transmission Systems Solution
7.3.1.1. AC & DC Harmonic Filters
7.3.1.2. Converters
7.3.1.3. DC Lines
7.3.1.4. Circuit Breakers
7.3.1.5. Others
7.3.2. HVDC Transmission Systems Services
7.4. Market Attractiveness Analysis By System Component
8. HVDC Transmission Systems Market Analysis 2013-2021 and Forecast 2022-2028, by Technology
8.1. Introduction / Key Findings
8.2. Historical Market Size (US$ Mn) Analysis By Technology, 2013 - 2021
8.3. Current and Future Market Size (US$ Mn) Analysis and Forecast By Technology, 2022 - 2028
8.3.1. LCC
8.3.2. VSC
8.3.3. Others
8.4. Market Attractiveness Analysis By Technology
9. HVDC Transmission Systems Market Analysis 2013-2021 and Forecast 2022-2028, by Deployment
9.1. Introduction / Key Findings
9.2. Historical Market Size (US$ Mn) Analysis By Deployment, 2013 - 2021
9.3. Current and Future Market Size (US$ Mn) Analysis and Forecast By Deployment, 2022 - 2028
9.3.1. Overhead
9.3.2. Underground
9.3.3. Subsea
9.3.4. Combination
9.4. Market Attractiveness Analysis By Deployment
10. HVDC Transmission Systems Market Analysis 2013-2021 and Forecast 2022-2028, by Power Rating
10.1. Introduction / Key Findings
10.2. Historical Market Size (US$ Mn) Analysis By Power Rating, 2013 - 2021
10.3. Current and Future Market Size (US$ Mn) Analysis and Forecast By Power Rating, 2022 - 2028
10.3.1. Below 1000 MW
10.3.2. 1000 - 2000 MW
10.3.3. 2000 MW & above
10.4. Market Attractiveness Analysis By Power Rating
11. HVDC Transmission Systems Market Analysis 2013-2021 and Forecast 2022-2028, by Region
11.1. Introduction
11.2. Historical Market Size (US$ Mn) Analysis By Region, 2013 - 2021
11.3. Current Market Size (US$ Mn) Analysis and Forecast By Region, 2022 - 2028
11.3.1. North America
11.3.2. Latin America
11.3.3. APEJ
11.3.4. Japan
11.3.5. Eastern Europe
11.3.6. Western Europe
11.3.7. MEA
11.4. Market Attractiveness Analysis By Region
12. North America HVDC Transmission Systems Market Analysis 2013-2021 and Forecast 2022-2028
12.1. Introduction
12.2. Historical Market Size (US$ Mn) Trend Analysis By Market Taxonomy, 2013 - 2021
12.3. Market Size (US$ Mn) Forecast By Market Taxonomy, 2022 - 2028
12.3.1. By Country
12.3.1.1. U.S.
12.3.1.2. Canada
12.3.2. By System Component
12.3.3. By Technology
12.3.4. By Deployment
12.3.5. By Power Rating
12.4. Market Attractiveness Analysis
12.4.1. By Country
12.4.2. By System Component
12.4.3. By Technology
12.4.4. By Deployment
12.4.5. By Power Rating
12.5. Key Market Participants - Intensity Mapping
12.6. Drivers and Restraints - Impact Analysis
13. Latin America HVDC Transmission Systems Market Analysis 2013-2021 and Forecast 2022-2028
13.1. Introduction
13.2. Historical Market Size (US$ Mn) Trend Analysis By Market Taxonomy, 2013 - 2021
13.3. Market Size (US$ Mn) Forecast By Market Taxonomy, 2022 - 2028
13.3.1. By Country
13.3.1.1. Brazil
13.3.1.2. Mexico
13.3.1.3. Rest of Latin America
13.3.2. By System Component
13.3.3. By Technology
13.3.4. By Deployment
13.3.5. By Power Rating
13.4. Market Attractiveness Analysis
13.4.1. By Country
13.4.2. By System Component
13.4.3. By Technology
13.4.4. By Deployment
13.4.5. By Power Rating
13.5. Key Market Participants - Intensity Mapping
13.6. Drivers and Restraints - Impact Analysis
14. Western Europe HVDC Transmission Systems Market Analysis 2013-2021 and Forecast 2022-2028
14.1. Introduction
14.2. Historical Market Size (US$ Mn) Trend Analysis By Market Taxonomy, 2013 - 2021
14.3. Market Size (US$ Mn) Forecast By Market Taxonomy, 2022 - 2028
14.3.1. By Country
14.3.1.1. Germany
14.3.1.2. U.K.
14.3.1.3. France
14.3.1.4. Spain
14.3.1.5. Russia
14.3.1.6. Rest of Europe
14.3.2. By System Component
14.3.3. By Technology
14.3.4. By Deployment
14.3.5. By Power Rating
14.4. Market Attractiveness Analysis
14.4.1. By Country
14.4.2. By System Component
14.4.3. By Technology
14.4.4. By Deployment
14.4.5. By Power Rating
14.5. Key Market Participants - Intensity Mapping
14.6. Drivers and Restraints - Impact Analysis
15. Eastern Europe HVDC Transmission Systems Market Analysis 2013-2021 and Forecast 2022-2028
15.1. Introduction
15.2. Historical Market Size (US$ Mn) Trend Analysis By Market Taxonomy, 2013 - 2021
15.3. Market Size (US$ Mn) Forecast By Market Taxonomy, 2022 - 2028
15.3.1. By Country
15.3.1.1. Russia
15.3.1.2. Poland
15.3.1.3. Rest of Europe
15.3.2. By System Component
15.3.3. By Technology
15.3.4. By Deployment
15.3.5. By Power Rating
15.4. Market Attractiveness Analysis
15.4.1. By Country
15.4.2. By System Component
15.4.3. By Technology
15.4.4. By Deployment
15.4.5. By Power Rating
15.5. Key Market Participants - Intensity Mapping
15.6. Drivers and Restraints - Impact Analysis
16. Asia Pacific Excluding Japan HVDC Transmission Systems Market Analysis 2013-2021 and Forecast 2022-2028
16.1. Introduction
16.2. Historical Market Size (US$ Mn) Trend Analysis By Market Taxonomy, 2013 - 2021
16.3. Market Size (US$ Mn) Forecast By Market Taxonomy, 2022 - 2028
16.3.1. By Country
16.3.1.1. China
16.3.1.2. India
16.3.1.3. Malaysia
16.3.1.4. Singapore
16.3.1.5. Australia
16.3.1.6. Rest of APEJ
16.3.2. By System Component
16.3.3. By Technology
16.3.4. By Deployment
16.3.5. By Power Rating
16.4. Market Attractiveness Analysis
16.4.1. By Country
16.4.2. By System Component
16.4.3. By Technology
16.4.4. By Deployment
16.4.5. By Power Rating
16.5. Key Market Participants - Intensity Mapping
16.6. Drivers and Restraints - Impact Analysis
17. Japan HVDC Transmission Systems Market Analysis 2013-2021 and Forecast 2022-2028
17.1. Introduction
17.2. Historical Market Size (US$ Mn) Trend Analysis By Market Taxonomy, 2013 - 2021
17.3. Market Size (US$ Mn) Forecast By Market Taxonomy, 2022 - 2028
17.3.1. By Country
17.3.2. By System Component
17.3.3. By Technology
17.3.4. By Deployment
17.3.5. By Power Rating
17.4. Market Attractiveness Analysis
17.4.1. By Country
17.4.2. By System Component
17.4.3. By Technology
17.4.4. By Deployment
17.4.5. By Power Rating
17.5. Key Market Participants - Intensity Mapping
17.6. Drivers and Restraints - Impact Analysis
18. Middle East and Africa HVDC Transmission Systems Market Analysis 2013-2021 and Forecast 2022-2028
18.1. Introduction
18.2. Pricing Analysis
18.3. Historical Market Size (US$ Mn) Trend Analysis By Market Taxonomy, 2013 - 2021
18.4. Market Size (US$ Mn) Forecast By Market Taxonomy, 2022 - 2028
18.4.1. By Country
18.4.1.1. GCC Countries
18.4.1.2. Israel
18.4.1.3. South Africa
18.4.1.4. Rest of MEA
18.4.2. By System Component
18.4.3. By Technology
18.4.4. By Deployment
18.4.5. By Power Rating
18.5. Market Attractiveness Analysis
18.5.1. By Country
18.5.2. By System Component
18.5.3. By Technology
18.5.4. By Deployment
18.5.5. By Power Rating
18.6. Key Market Participants - Intensity Mapping
18.7. Drivers and Restraints - Impact Analysis
19. Market Structure Analysis
19.1. Market Analysis by Tier of Companies (HVDC Transmission Systems Market)
19.2. Market Concentration
19.3. Market Share Analysis of Top Players
19.4. Market Presence Analysis
19.4.1. By Regional footprint of Players
19.4.2. Product foot print by Players
19.4.3. Channel Foot Print by Players
20. Competition Analysis
20.1. Competition Dashboard
20.2. Pricing Analysis by Competition
20.3. Competition Benchmarking
20.4. Competition Deep Dive
20.4.1. ABB Ltd.
20.4.1.1. Overview
20.4.1.2. Product Portfolio
20.4.1.3. Profitability by Market Segments (Product/Channel/Region)
20.4.1.4. Sales Footprint
20.4.1.5. Strategy Overview
20.4.1.5.1. Marketing Strategy
20.4.1.5.2. Product Strategy
20.4.2. Siemens AG
20.4.2.1. Overview
20.4.2.2. Product Portfolio
20.4.2.3. Profitability by Market Segments (Product/Channel/Region)
20.4.2.4. Sales Footprint
20.4.2.5. Strategy Overview
20.4.2.5.1. Marketing Strategy
20.4.2.5.2. Product Strategy
20.4.3. Toshiba Corporation
20.4.3.1. Overview
20.4.3.2. Product Portfolio
20.4.3.3. Profitability by Market Segments (Product/Channel/Region)
20.4.3.4. Sales Footprint
20.4.3.5. Strategy Overview
20.4.3.5.1. Marketing Strategy
20.4.3.5.2. Product Strategy
20.4.4. General Electric Co.
20.4.4.1. Overview
20.4.4.2. Product Portfolio
20.4.4.3. Profitability by Market Segments (Product/Channel/Region)
20.4.4.4. Sales Footprint
20.4.4.5. Strategy Overview
20.4.4.5.1. Marketing Strategy
20.4.4.5.2. Product Strategy
20.4.5. Mitsubishi Electric Corporation
20.4.5.1. Overview
20.4.5.2. Product Portfolio
20.4.5.3. Profitability by Market Segments (Product/Channel/Region)
20.4.5.4. Sales Footprint
20.4.5.5. Strategy Overview
20.4.5.5.1. Marketing Strategy
20.4.5.5.2. Product Strategy
20.4.6. Prysmian SpA
20.4.6.1. Overview
20.4.6.2. Product Portfolio
20.4.6.3. Profitability by Market Segments (Product/Channel/Region)
20.4.6.4. Sales Footprint
20.4.6.5. Strategy Overview
20.4.6.5.1. Marketing Strategy
20.4.6.5.2. Product Strategy
20.4.7. TransGrid Solutions Inc.
20.4.7.1. Overview
20.4.7.2. Product Portfolio
20.4.7.3. Profitability by Market Segments (Product/Channel/Region)
20.4.7.4. Sales Footprint
20.4.7.5. Strategy Overview
20.4.7.5.1. Marketing Strategy
20.4.7.5.2. Product Strategy
20.4.8. Abengoa S.A.
20.4.8.1. Overview
20.4.8.2. Product Portfolio
20.4.8.3. Profitability by Market Segments (Product/Channel/Region)
20.4.8.4. Sales Footprint
20.4.8.5. Strategy Overview
20.4.8.5.1. Marketing Strategy
20.4.8.5.2. Product Strategy
20.4.9. ATCO LTD.
20.4.9.1. Overview
20.4.9.2. Product Portfolio
20.4.9.3. Profitability by Market Segments (Product/Channel/Region)
20.4.9.4. Sales Footprint
20.4.9.5. Strategy Overview
20.4.9.5.1. Marketing Strategy
20.4.9.5.2. Product Strategy
20.4.10. LS Industrial Systems Co., Ltd
20.4.10.1. Overview
20.4.10.2. Product Portfolio
20.4.10.3. Profitability by Market Segments (Product/Channel/Region)
20.4.10.4. Sales Footprint
20.4.10.5. Strategy Overview
20.4.10.5.1. Marketing Strategy
20.4.10.5.2. Product Strategy
21. Assumptions and Acronyms Used
22. Research Methodology
Let us know your requirement to get
100% FREE customization
Table 01: Global HVDC Transmission Systems Market Value (US$ Mn) Analysis (2013 – 2021) by System Component
Table 02: Global HVDC Transmission Systems Market Value (US$ Mn) Analysis (2022 – 2028) by System Component
Table 03: Global HVDC Transmission Systems Market Value (US$ Mn) Analysis (2013 – 2021) by Technology
Table 04: Global HVDC Transmission Systems Market Value (US$ Mn) Analysis (2022 – 2028) by Technology
Table 05: Global HVDC Transmission Systems Market Value (US$ Mn) Analysis (2013 – 2021) by Deployment
Table 06: Global HVDC Transmission Systems Market Value (US$ Mn) Analysis (2022 – 2028) by Deployment
Table 07: Global HVDC Transmission Systems Market Value (US$ Mn) Analysis (2013 – 2021) by Power Rating
Table 08: Global HVDC Transmission Systems Market Value (US$ Mn) Analysis (2022 – 2028) by Power Rating
Table 09: Global HVDC Transmission Systems Market Value (US$ Mn) Analysis (2013 – 2021) by Region
Table 10: Global HVDC Transmission Systems Market Value (US$ Mn) Analysis (2022 – 2028) by Region
Table 11: North America HVDC Transmission Systems Market Value (US$ Mn) Analysis (2013 – 2021) by System Component
Table 12: North America HVDC Transmission Systems Market Value (US$ Mn) Analysis (2022 – 2028) by System Component
Table 13: North America HVDC Transmission Systems Market Value (US$ Mn) Analysis (2013 – 2021) by Technology
Table 14: North America HVDC Transmission Systems Market Value (US$ Mn) Analysis (2022 – 2028) by Technology
Table 15: North America HVDC Transmission Systems Market Value (US$ Mn) Analysis (2013 – 2021) by Deployment
Table 16: North America HVDC Transmission Systems Market Value (US$ Mn) Analysis (2022 – 2028) by Deployment
Table 17: North America HVDC Transmission Systems Market Value (US$ Mn) Analysis (2013 – 2021) by Power Rating
Table 18: North America HVDC Transmission Systems Market Value (US$ Mn) Analysis (2022 – 2028) by Power Rating
Table 19: North America HVDC Transmission Systems Market Value (US$ Mn) Analysis (2013 – 2021) by Country
Table 20: North America HVDC Transmission Systems Market Value (US$ Mn) Forecast (2022 – 2028) by Country
Table 21: Latin America HVDC Transmission Systems Market Value (US$ Mn) Analysis (2013 – 2021) by System Component
Table 22: Latin America HVDC Transmission Systems Market Value (US$ Mn) Analysis (2022 – 2028) by System Component
Table 23: Latin America HVDC Transmission Systems Market Value (US$ Mn) Analysis (2013 – 2021) by Technology
Table 24: Latin America HVDC Transmission Systems Market Value (US$ Mn) Analysis (2022 – 2028) by Technology
Table 25: Latin America HVDC Transmission Systems Market Value (US$ Mn) Analysis (2013 – 2021) by Deployment
Table 26: Latin America HVDC Transmission Systems Market Value (US$ Mn) Analysis (2022 – 2028) by Deployment
Table 27: Latin America HVDC Transmission Systems Market Value (US$ Mn) Analysis (2013 – 2021) by Power Rating
Table 28: Latin America HVDC Transmission Systems Market Value (US$ Mn) Analysis (2022 – 2028) by Power Rating
Table 29: Latin America HVDC Transmission Systems Market Value (US$ Mn) Analysis (2013 – 2021) by Country
Table 30: Latin America HVDC Transmission Systems Market Value (US$ Mn) Forecast (2022 – 2028) by Country
Table 31: Europe HVDC Transmission Systems Market Value (US$ Mn) Analysis (2013 – 2021) by System Component
Table 32: Europe HVDC Transmission Systems Market Value (US$ Mn) Analysis (2022 – 2028) by System Component
Table 33: Europe HVDC Transmission Systems Market Value (US$ Mn) Analysis (2013 – 2021) by Technology
Table 34: Europe HVDC Transmission Systems Market Value (US$ Mn) Analysis (2022 – 2028) by Technology
Table 35: Europe HVDC Transmission Systems Market Value (US$ Mn) Analysis (2013 – 2021) by Deployment
Table 36: Europe HVDC Transmission Systems Market Value (US$ Mn) Analysis (2022 – 2028) by Deployment
Table 37: Europe HVDC Transmission Systems Market Value (US$ Mn) Analysis (2013 – 2021) by Power Rating
Table 38: Europe HVDC Transmission Systems Market Value (US$ Mn) Analysis (2022 – 2028) by Power Rating
Table 39: Europe HVDC Transmission Systems Market Value (US$ Mn) Analysis (2013 – 2021) by Country
Table 40: Europe HVDC Transmission Systems Market Value (US$ Mn) Forecast (2022 – 2028) by Country
Table 41: Asia Pacific Excluding Japan HVDC Transmission Systems Market Value (US$ Mn) Analysis (2013 – 2021) by System Component
Table 42: Asia Pacific Excluding Japan HVDC Transmission Systems Market Value (US$ Mn) Analysis (2022 – 2028) by System Component
Table 43: Asia Pacific Excluding Japan HVDC Transmission Systems Market Value (US$ Mn) Analysis (2013 – 2021) by Technology
Table 44: Asia Pacific Excluding Japan HVDC Transmission Systems Market Value (US$ Mn) Analysis (2022 – 2028) by Technology
Table 45: Asia Pacific Excluding Japan HVDC Transmission Systems Market Value (US$ Mn) Analysis (2013 – 2021) by Deployment
Table 46: Asia Pacific Excluding Japan HVDC Transmission Systems Market Value (US$ Mn) Analysis (2022 – 2028) by Deployment
Table 47: Asia Pacific Excluding Japan HVDC Transmission Systems Market Value (US$ Mn) Analysis (2013 – 2021) by Power Rating
Table 48: Asia Pacific Excluding Japan HVDC Transmission Systems Market Value (US$ Mn) Analysis (2022 – 2028) by Power Rating
Table 49: Asia Pacific Excluding Japan HVDC Transmission Systems Market Value (US$ Mn) Analysis (2013 – 2021) by Country
Table 50: Asia Pacific Excluding Japan HVDC Transmission Systems Market Value (US$ Mn) Forecast (2022 – 2028) by Country
Table 51: Japan HVDC Transmission Systems Market Value (US$ Mn) Analysis (2013 – 2021) by System Component
Table 52: Japan HVDC Transmission Systems Market Value (US$ Mn) Analysis (2022 – 2028) by System Component
Table 53: Japan HVDC Transmission Systems Market Value (US$ Mn) Analysis (2013 – 2021) by Technology
Table 54: Japan HVDC Transmission Systems Market Value (US$ Mn) Analysis (2022 – 2028) by Technology
Table 55: Japan HVDC Transmission Systems Market Value (US$ Mn) Analysis (2013 – 2021) by Deployment
Table 56: Japan HVDC Transmission Systems Market Value (US$ Mn) Analysis (2022 – 2028) by Deployment
Table 57: Japan HVDC Transmission Systems Market Value (US$ Mn) Analysis (2013 – 2021) by Power Rating
Table 58: Japan HVDC Transmission Systems Market Value (US$ Mn) Analysis (2022 – 2028) by Power Rating
Table 59: Japan HVDC Transmission Systems Market Value (US$ Mn) Analysis (2013 – 2021) by Country
Table 60: Japan HVDC Transmission Systems Market Value (US$ Mn) Forecast (2022 – 2028) by Country
Table 61: Middle East & Africa HVDC Transmission Systems Market Value (US$ Mn) Analysis (2013 – 2021) by System Component
Table 62: Middle East & Africa HVDC Transmission Systems Market Value (US$ Mn) Analysis (2022 – 2028) by System Component
Table 63: Middle East & Africa HVDC Transmission Systems Market Value (US$ Mn) Analysis (2013 – 2021) by Technology
Table 64: Middle East & Africa HVDC Transmission Systems Market Value (US$ Mn) Analysis (2022 – 2028) by Technology
Table 65: Middle East & Africa HVDC Transmission Systems Market Value (US$ Mn) Analysis (2013 – 2021) by Deployment
Table 66: Middle East & Africa HVDC Transmission Systems Market Value (US$ Mn) Analysis (2022 – 2028) by Deployment
Table 67: Middle East & Africa HVDC Transmission Systems Market Value (US$ Mn) Analysis (2013 – 2021) by Power Rating
Table 68: Middle East & Africa HVDC Transmission Systems Market Value (US$ Mn) Analysis (2022 – 2028) by Power Rating
Table 69: Middle East & Africa HVDC Transmission Systems Market Value (US$ Mn) Analysis (2013 – 2021) by Country
Table 70: Middle East & Africa HVDC Transmission Systems Market Value (US$ Mn) Forecast (2022 – 2028) by Country
Find your sweet spots for generating winning opportunities in this market.
Talk to AnalystFigure 01: Global HVDC Transmission Systems Market Value (US$ Mn), 2013-2021
Figure 02: Global HVDC Transmission Systems Market Value (US$ Mn), 2022-2028
Figure 03: Global HVDC Transmission Systems Market Size (US$ Mn) and Y-o-Y Growth Rate from 2022-2028
Figure 04: Global HVDC Transmission Systems Market Size and Y-o-Y Growth Rate from 2022-2028
Figure 05: Global HVDC Transmission Systems Market Value Share Analysis (2022 & 2028) by System Component
Figure 06: Global HVDC Transmission Systems Market Value Y-o-Y Growth Trend Analysis (2019 – 2028) by System Component
Figure 07: Global HVDC Transmission Systems Market Attractiveness by System Component
Figure 08: Global HVDC Transmission Systems Market Value Share Analysis (2022 & 2028) by Technology
Figure 09: Global HVDC Transmission Systems Market Value Y-o-Y Growth Trend Analysis (2019 – 2028) by Technology
Figure 10: Global HVDC Transmission Systems Market Attractiveness by Technology
Figure 11: Global HVDC Transmission Systems Market Value Share Analysis (2022 & 2028) by Deployment
Figure 12: Global HVDC Transmission Systems Market Value Y-o-Y Growth Trend Analysis (2019 – 2028) by Deployment
Figure 13: Global HVDC Transmission Systems Market Attractiveness by Deployment
Figure 14: Global HVDC Transmission Systems Market Value Share Analysis (2022 & 2028) by Power Rating
Figure 15: Global HVDC Transmission Systems Market Value Y-o-Y Growth Trend Analysis (2019 – 2028) by Power Rating
Figure 16: Global HVDC Transmission Systems Market Attractiveness by Power Rating
Figure 17: Global HVDC Transmission Systems Market Value Share Analysis (2022 & 2028) by Region
Figure 18: Global HVDC Transmission Systems Market Value Y-o-Y Growth Trend Analysis (2019 – 2028) by Region
Figure 19: Global HVDC Transmission Systems Market Attractiveness by Region
Figure 20: North America HVDC Transmission Systems Market Absolute $ Opportunity (US$ Mn), 2013 – 2028
Figure 21: Latin America HVDC Transmission Systems Market Absolute $ Opportunity (US$ Mn), 2013 – 2028
Figure 22: Europe HVDC Transmission Systems Market Absolute $ Opportunity (US$ Mn), 2013 – 2028
Figure 23: Asia Pacific Excluding Japan HVDC Transmission Systems Market Absolute $ Opportunity (US$ Mn), 2013 – 2028
Figure 24: Japan HVDC Transmission Systems Market Absolute $ Opportunity (US$ Mn), 2013 – 2028
Figure 25: Middle East and Africa HVDC Transmission Systems Market Absolute $ Opportunity (US$ Mn), 2013 – 2028
Figure 26: North America HVDC Transmission Systems Market Value (US$ Mn), 2013-2021
Figure 27: North America HVDC Transmission Systems Market Value (US$ Mn), 2022-2028
Figure 28: North America HVDC Transmission Systems Market Value Share Analysis (2022 & 2028) by System Component
Figure 29: North America HVDC Transmission Systems Market Value Y-o-Y Growth Trend Analysis (2019 – 2028) by System Component
Figure 30: North America HVDC Transmission Systems Market Attractiveness by System Component
Figure 31: North America HVDC Transmission Systems Market Value Share Analysis (2022 & 2028) by Technology
Figure 32: North America HVDC Transmission Systems Market Value Y-o-Y Growth Trend Analysis (2019 – 2028) by Technology
Figure 33: North America HVDC Transmission Systems Market Attractiveness by Technology
Figure 34: North America HVDC Transmission Systems Market Value Share Analysis (2022 & 2028) by Deployment
Figure 35: North America HVDC Transmission Systems Market Value Y-o-Y Growth Trend Analysis (2019 – 2028) by Deployment
Figure 36: North America HVDC Transmission Systems Market Attractiveness by Deployment
Figure 37: North America HVDC Transmission Systems Market Value Share Analysis (2022 & 2028) by Power Rating
Figure 38: North America HVDC Transmission Systems Market Value Y-o-Y Growth Trend Analysis (2019 – 2028) by Power Rating
Figure 39: North America HVDC Transmission Systems Market Attractiveness by Power Rating
Figure 40: North America HVDC Transmission Systems Market Value Share Analysis (2022 & 2028) by Country
Figure 41: North America HVDC Transmission Systems Market Value Y-o-Y Growth Trend Analysis (2019 – 2028) by Country
Figure 42: North America HVDC Transmission Systems Market Attractiveness by Country
Figure 43: U.S. HVDC Transmission Systems Market Absolute $ Opportunity (US$ Mn), 2013 – 2028
Figure 44: Canada HVDC Transmission Systems Market Absolute $ Opportunity (US$ Mn), 2013 – 2028
Figure 45: Latin America HVDC Transmission Systems Market Value (US$ Mn), 2013-2021
Figure 46: Latin America HVDC Transmission Systems Market Value (US$ Mn), 2022-2028
Figure 47: Latin America HVDC Transmission Systems Market Value Share Analysis (2022 & 2028) by System Component
Figure 48: Latin America HVDC Transmission Systems Market Value Y-o-Y Growth Trend Analysis (2019 – 2028) by System Component
Figure 49: Latin America HVDC Transmission Systems Market Attractiveness by System Component
Figure 50: Latin America HVDC Transmission Systems Market Value Share Analysis (2022 & 2028) by Technology
Figure 51: Latin America HVDC Transmission Systems Market Value Y-o-Y Growth Trend Analysis (2019 – 2028) by Technology
Figure 52: Latin America HVDC Transmission Systems Market Attractiveness by Technology
Figure 53: Latin America HVDC Transmission Systems Market Value Share Analysis (2022 & 2028) by Deployment
Figure 54: Latin America HVDC Transmission Systems Market Value Y-o-Y Growth Trend Analysis (2019 – 2028) by Deployment
Figure 55: Latin America HVDC Transmission Systems Market Attractiveness by Deployment
Figure 56: Latin America HVDC Transmission Systems Market Value Share Analysis (2022 & 2028) by Power Rating
Figure 57: Latin America HVDC Transmission Systems Market Value Y-o-Y Growth Trend Analysis (2019 – 2028) by Power Rating
Figure 58: Latin America HVDC Transmission Systems Market Attractiveness by Power Rating
Figure 59: Latin America HVDC Transmission Systems Market Value Share Analysis (2022 & 2028) by Country
Figure 60: Latin America HVDC Transmission Systems Market Value Y-o-Y Growth Trend Analysis (2019 – 2028) by Country
Figure 61: Latin America HVDC Transmission Systems Market Attractiveness by Country
Figure 62: Brazil HVDC Transmission Systems Market Absolute $ Opportunity (US$ Mn), 2013 – 2028
Figure 63: Mexico HVDC Transmission Systems Market Absolute $ Opportunity (US$ Mn), 2013 – 2028
Figure 64: Rest of Latin America HVDC Transmission Systems Market Absolute $ Opportunity (US$ Mn), 2013 – 2028
Figure 65: Europe HVDC Transmission Systems Market Value (US$ Mn), 2013-2021
Figure 66: Europe HVDC Transmission Systems Market Value (US$ Mn), 2022-2028
Figure 67: Europe HVDC Transmission Systems Market Value Share Analysis (2022 & 2028) by System Component
Figure 68: Europe HVDC Transmission Systems Market Value Y-o-Y Growth Trend Analysis (2019 – 2028) by System Component
Figure 69: Europe HVDC Transmission Systems Market Attractiveness by System Component
Figure 70: Europe HVDC Transmission Systems Market Value Share Analysis (2022 & 2028) by Technology
Figure 71: Europe HVDC Transmission Systems Market Value Y-o-Y Growth Trend Analysis (2019 – 2028) by Technology
Figure 72: Europe HVDC Transmission Systems Market Attractiveness by Technology
Figure 73: Europe HVDC Transmission Systems Market Value Share Analysis (2022 & 2028) by Deployment
Figure 74: Europe HVDC Transmission Systems Market Value Y-o-Y Growth Trend Analysis (2019 – 2028) by Deployment
Figure 75: Europe HVDC Transmission Systems Market Attractiveness by Deployment
Figure 76: Europe HVDC Transmission Systems Market Value Share Analysis (2022 & 2028) by Power Rating
Figure 77: Europe HVDC Transmission Systems Market Value Y-o-Y Growth Trend Analysis (2019 – 2028) by Power Rating
Figure 78: Europe HVDC Transmission Systems Market Attractiveness by Power Rating
Figure 79: Europe HVDC Transmission Systems Market Value Share Analysis (2022 & 2028) by Country
Figure 80: Europe HVDC Transmission Systems Market Value Y-o-Y Growth Trend Analysis (2019 – 2028) by Country
Figure 81: Europe HVDC Transmission Systems Market Attractiveness by Country
Figure 82: Germany HVDC Transmission Systems Market Absolute $ Opportunity (US$ Mn), 2013 – 2028
Figure 83: U.K. HVDC Transmission Systems Market Absolute $ Opportunity (US$ Mn), 2013 – 2028
Figure 84: France HVDC Transmission Systems Market Absolute $ Opportunity (US$ Mn), 2013 – 2028
Figure 85: Spain HVDC Transmission Systems Market Absolute $ Opportunity (US$ Mn), 2013 – 2028
Figure 86: Russia HVDC Transmission Systems Market Absolute $ Opportunity (US$ Mn), 2013 – 2028
Figure 87: Rest of Europe HVDC Transmission Systems Market Absolute $ Opportunity (US$ Mn), 2013 – 2028
Figure 88: Asia Pacific Excluding Japan HVDC Transmission Systems Market Value (US$ Mn), 2013-2021
Figure 89: Asia Pacific Excluding Japan HVDC Transmission Systems Market Value (US$ Mn), 2022-2028
Figure 90: Asia Pacific Excluding Japan HVDC Transmission Systems Market Value Share Analysis (2022 & 2028) by System Component
Figure 91: Asia Pacific Excluding Japan HVDC Transmission Systems Market Value Y-o-Y Growth Trend Analysis (2019 – 2028) by System Component
Figure 92: Asia Pacific Excluding Japan HVDC Transmission Systems Market Attractiveness by System Component
Figure 93: Asia Pacific Excluding Japan HVDC Transmission Systems Market Value Share Analysis (2022 & 2028) by Technology
Figure 94: Asia Pacific Excluding Japan HVDC Transmission Systems Market Value Y-o-Y Growth Trend Analysis (2019 – 2028) by Technology
Figure 95: Asia Pacific Excluding Japan HVDC Transmission Systems Market Attractiveness by Technology
Figure 96: Asia Pacific Excluding Japan HVDC Transmission Systems Market Value Share Analysis (2022 & 2028) by Deployment
Figure 97: Asia Pacific Excluding Japan HVDC Transmission Systems Market Value Y-o-Y Growth Trend Analysis (2019 – 2028) by Deployment
Figure 98: Asia Pacific Excluding Japan HVDC Transmission Systems Market Attractiveness by Deployment
Figure 99: Asia Pacific Excluding Japan HVDC Transmission Systems Market Value Share Analysis (2022 & 2028) by Power Rating
Figure 100: Asia Pacific Excluding Japan HVDC Transmission Systems Market Value Y-o-Y Growth Trend Analysis (2019 – 2028) by Power Rating
Figure 101: Asia Pacific Excluding Japan HVDC Transmission Systems Market Attractiveness by Power Rating
Figure 102: Asia Pacific Excluding Japan HVDC Transmission Systems Market Value Share Analysis (2022 & 2028) by Country
Figure 103: Asia Pacific Excluding Japan HVDC Transmission Systems Market Value Y-o-Y Growth Trend Analysis (2019 – 2028) by Country
Figure 104: Asia Pacific Excluding Japan HVDC Transmission Systems Market Attractiveness by Country
Figure 105: China HVDC Transmission Systems Market Absolute $ Opportunity (US$ Mn), 2013 – 2028
Figure 106: India HVDC Transmission Systems Market Absolute $ Opportunity (US$ Mn), 2013 – 2028
Figure 107: Malaysia HVDC Transmission Systems Market Absolute $ Opportunity (US$ Mn), 2013 – 2028
Figure 108: Singapore HVDC Transmission Systems Market Absolute $ Opportunity (US$ Mn), 2013 – 2028
Figure 109: Australia HVDC Transmission Systems Market Absolute $ Opportunity (US$ Mn), 2013 – 2028
Figure 110: Rest of APEJ HVDC Transmission Systems Market Absolute $ Opportunity (US$ Mn), 2013 – 2028
Figure 111: Japan HVDC Transmission Systems Market Value (US$ Mn), 2013-2021
Figure 112: Japan HVDC Transmission Systems Market Value (US$ Mn), 2022-2028
Figure 113: Japan HVDC Transmission Systems Market Value Share Analysis (2022 & 2028) by System Component
Figure 114: Japan HVDC Transmission Systems Market Value Y-o-Y Growth Trend Analysis (2019 – 2028) by System Component
Figure 115: Japan HVDC Transmission Systems Market Attractiveness by System Component
Figure 116: Japan HVDC Transmission Systems Market Value Share Analysis (2022 & 2028) by Technology
Figure 117: Japan HVDC Transmission Systems Market Value Y-o-Y Growth Trend Analysis (2019 – 2028) by Technology
Figure 118: Japan HVDC Transmission Systems Market Attractiveness by Technology
Figure 119: Japan HVDC Transmission Systems Market Value Share Analysis (2022 & 2028) by Deployment
Figure 120: Japan HVDC Transmission Systems Market Value Y-o-Y Growth Trend Analysis (2019 – 2028) by Deployment
Figure 121: Japan HVDC Transmission Systems Market Attractiveness by Deployment
Figure 122: Japan HVDC Transmission Systems Market Value Share Analysis (2022 & 2028) by Power Rating
Figure 123: Japan HVDC Transmission Systems Market Value Y-o-Y Growth Trend Analysis (2019 – 2028) by Power Rating
Figure 124: Japan HVDC Transmission Systems Market Attractiveness by Power Rating
Figure 125: Japan HVDC Transmission Systems Market Value Share Analysis (2022 & 2028) by Country
Figure 126: Japan HVDC Transmission Systems Market Value Y-o-Y Growth Trend Analysis (2019 – 2028) by Country
Figure 127: Japan HVDC Transmission Systems Market Attractiveness by Country
Figure 128: Middle East & Africa HVDC Transmission Systems Market Value (US$ Mn), 2013-2021
Figure 129: Middle East & Africa HVDC Transmission Systems Market Value (US$ Mn), 2022-2028
Figure 130: Middle East & Africa HVDC Transmission Systems Market Value Share Analysis (2022 & 2028) by System Component
Figure 131: Middle East & Africa HVDC Transmission Systems Market Value Y-o-Y Growth Trend Analysis (2019 – 2028) by System Component
Figure 132: Middle East & Africa HVDC Transmission Systems Market Attractiveness by System Component
Figure 133: Middle East & Africa HVDC Transmission Systems Market Value Share Analysis (2022 & 2028) by Technology
Figure 134: Middle East & Africa HVDC Transmission Systems Market Value Y-o-Y Growth Trend Analysis (2019 – 2028) by Technology
Figure 135: Middle East & Africa HVDC Transmission Systems Market Attractiveness by Technology
Figure 136: Middle East & Africa HVDC Transmission Systems Market Value Share Analysis (2022 & 2028) by Deployment
Figure 137: Middle East & Africa HVDC Transmission Systems Market Value Y-o-Y Growth Trend Analysis (2019 – 2028) by Deployment
Figure 138: Middle East & Africa HVDC Transmission Systems Market Attractiveness by Deployment
Figure 139: Middle East & Africa HVDC Transmission Systems Market Value Share Analysis (2022 & 2028) by Power Rating
Figure 140: Middle East & Africa HVDC Transmission Systems Market Value Y-o-Y Growth Trend Analysis (2019 – 2028) by Power Rating
Figure 141: Middle East & Africa HVDC Transmission Systems Market Attractiveness by Power Rating
Figure 142: Middle East & Africa HVDC Transmission Systems Market Value Share Analysis (2022 & 2028) by Country
Figure 143: Middle East & Africa HVDC Transmission Systems Market Value Y-o-Y Growth Trend Analysis (2019 – 2028) by Country
Figure 144: Middle East & Africa HVDC Transmission Systems Market Attractiveness by Country
Figure 145: GCC Countries HVDC Transmission Systems Market Absolute $ Opportunity (US$ Mn), 2013 – 2028
Figure 146: Israel HVDC Transmission Systems Market Absolute $ Opportunity (US$ Mn), 2013 – 2028
Figure 147: South Africa HVDC Transmission Systems Market Absolute $ Opportunity (US$ Mn), 2013 – 2028
Figure 148: Rest of Middle East & Africa HVDC Transmission Systems Market Absolute $ Opportunity (US$ Mn), 2013 – 2028
Need specific information?
Request CustomizationExplore Technology Insights
View Reports