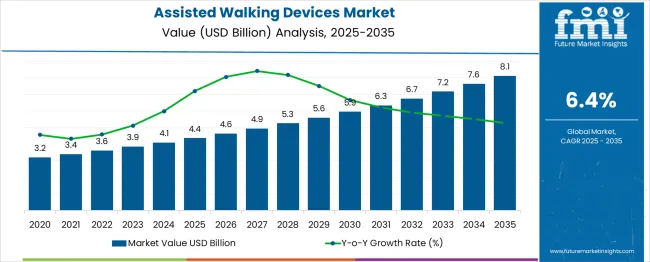
The Assisted Walking Devices Market is estimated to be valued at USD 4.4 billion in 2025 and is projected to reach USD 8.1 billion by 2035, registering a compound annual growth rate (CAGR) of 6.4% over the forecast period.

The assisted walking devices market is experiencing consistent growth due to the rising aging population, increasing prevalence of mobility-related disorders, and expanding access to rehabilitative care. Advances in ergonomic design and lightweight materials have significantly improved device usability and comfort, encouraging wider adoption among elderly and post-surgical patients.
Governments across several regions are also expanding healthcare access and funding support for mobility aids, which is fueling demand across both public health facilities and home care settings. In addition, the growing emphasis on fall prevention in geriatric care and the integration of safety enhancements such as anti-slip tips and foldable frames are driving product upgrades and replacements.
Future market expansion is expected to be supported by innovations in hybrid devices that combine support with smart monitoring functions, catering to both independence and safety.
The market is segmented by Product Type and region. By Product Type, the market is divided into Walkers, Canes, Crutches, and Gait Trainers. Regionally, the market is classified into North America, Latin America, Western Europe, Eastern Europe, Balkan & Baltic Countries, Russia & Belarus, Central Asia, East Asia, South Asia & Pacific, and the Middle East & Africa.
The market is segmented by Product Type and region. By Product Type, the market is divided into Walkers, Canes, Crutches, and Gait Trainers. Regionally, the market is classified into North America, Latin America, Western Europe, Eastern Europe, Balkan & Baltic Countries, Russia & Belarus, Central Asia, East Asia, South Asia & Pacific, and the Middle East & Africa.

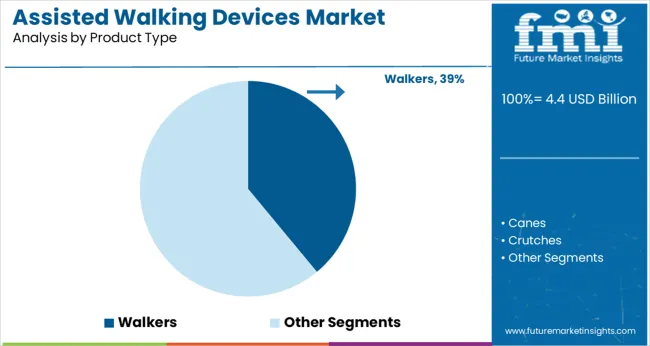
Walkers are projected to hold 39.0% of the total market revenue in 2025, making them the leading product segment in the assisted walking devices market. Their dominance is being attributed to their superior stability, ease of use, and effectiveness in supporting individuals with limited balance or lower body strength.
Widely recommended in clinical rehabilitation programs, walkers are preferred due to their four-point ground contact and weight-bearing capacity, which help reduce fall risks in both elderly and post-operative users. The availability of multiple variants such as front-wheeled, rollators, and folding walkers has enhanced their adaptability across home, institutional, and outdoor environments.
Additionally, product development focused on lightweight frames, adjustable height, and integrated seats has expanded user comfort and confidence. As healthcare systems increasingly emphasize mobility retention and at-home care, walkers remain the most trusted and accessible option for independent ambulation support.
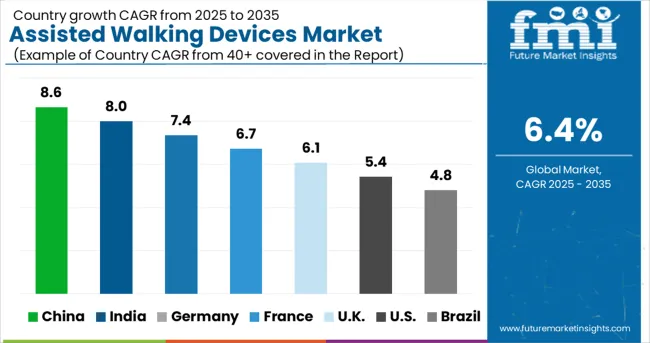
The North American regions are cumulatively expected to dominate the global assisted walking devices market through the forecast period, contributing a major share of 35.6%. Whilst North America is expected to dominate the forum, the Asia Pacific market is projected to register a considerable CAGR of 7.5% during the projection period, owing to the rising investments in healthcare infrastructure and elevating disposable income.
Besides these domineering markets, it is also identified by the expert analysts at Future Market Insights that the country UK is likely to exert an influence in the augmenting market growth, due to the offering of special grants by government-hosted initiatives to physically handicapped patients for purchasing the assisted walking devices. The physically challenged populace is also granted equitable access and reimbursement policies, along with guidance in matters related to purchasing assisted walking devices.
The growth of the healthcare infrastructure has installed the base of new technology penetration. Countries across the globe are having a considerable expenditure on capital equipment, and different kinds of products for assisted walking devices market. There is a usage of line curves and changes in the regulatory scenarios and their impact is likely to open numerous growth prospects for the key players proliferating in the forum.
As per the analysis of FMI, there are new product launches recently that include technologically advanced wheelchair power assist systems. It is a smartwatch app that enables users to simply tap the wheel to control the powerful SmartDriveMX@+ motor via Bluetooth. The market players are indulged in frequent innovations of assisted walking devices. For instance, Sunrise Medical Limited announced the launch of an easily adjustable mid-wheel drive power wheelchair. This wheelchair can be easily customized to suit individual requirements and quickly adapted to the changing needs of the physically handicapped.
Besides these new product launches, the markets in the USA and Canada region are identified to launch carbon ultralight rollators, which will be commercially available to rescue the growing geriatric population in these regions. Therefore, it is anticipated that the overall advanced walking devices market is likely to have significant growth during the estimated period of study.
Increased average old age, huge consumer base coupled with increasing incidences and rise in prevalence is summing up and fueling the sales of assisted walking devices like walkers, rollators, knee scooters, wheelchairs etc.
A new research report on assisted walking devices states that lifestyle and age-based health diseases like Parkinson, arthritis and other prevalent diseases have rocketed the sales of assisted walking devices. The government's financial support and initiatives are also thriving in the sales of assisted walking devices.
Neurological diseases & injuries are also pushing the demand for assisted walking devices. The growing geriatric population is leading to disability and knee weakness. Walking assist devices provide balance, support, and ultimately, the subsequent ability to survive independently. The aforementioned factors are responsible for the increasing geriatric population getting attracted to these devices.
Demand for assisted walking devices has increased from the last forecast period as governments have increased healthcare expenditure and funding for technological integration like the use of robotics in these assistive devices to help the patient.
Government initiatives run to distribute these walking devices like walkers and wheelchairs to poor people and also consume a huge chunk of assisted walking devices. Additionally, patients with chronic illnesses and standing disabilities are exempted from paying VAT on mobility products, pushing the sales of assisted walking devices.
Latest technological integration with the assistive devices that help the disable end users are holding hands with the government and private spaces to adopt these innovative devices that help walking disabled people.
Product and geography are the driving factors for assisted walking devices. The equipment employed people who suffered from certain disease are pushing the sales of assisted walking devices. The growing rates of accidents are leading to people with disabilities. Walking disabilities are pushing the demand for assisted walking devices. Increasing cases of arthritis consume walking devices. The increased prevalence of target diseases including Rheumatoid Arthritis and Parkinson’s disease is expected to propel the usage rates of assisted walking devices during the forecast period.
Rising cases of rheumatoid, surging demand for rehabilitation equipment and osteoarthritis are increasing the demand for assisted walking devices.
The lower investments through government schemes are slowing down the sales of assisted walking devices. The higher cost of purchasing walking assist devices is another factor that restricts the sales of assisted walking devices.
According to the assisted walking devices market analysis states that walker segment is the leading vehicle type segment in the assisted walking devices market. The other segments from the vehicle type are Canes, Crutches and Gait Trainers. This segment holds 62.7% of the global revenue. The factor adding to the growth of this segment is its enhanced stability by this equipment, higher mobility and it’s helping factor in physical activities in physically handicapped individuals. This pushes the overall sales of assisted walking devices globally.
While, the gait trainers' segment is expected to witness a maximum CAGR of 8.6% during the forecast period. This is due to the rising number of cerebral palsy and Parkinson’s disease, proliferating spinal injuries, and increase in the number of stroke cases in adults are some of the factors responsible for the growth of the gait trainer segment, increasing the sales of assisted walking devices.

North America is forecasted to hold 35.6% of the revenue in the global assisted walking devices market by the end of 2035.
The growing assisted walking devices market is attributed to the geriatric population in the region, The presence of advanced healthcare facilities and well-developed reimbursement policies are the key factors driving the market in this region.
Moreover, the high prevalence of target diseases, such as arthritis, Parkinson’s disease, and other chronic disabilities in this region is expected to act as a high impact rendering driver for the market expansion over the next nine years. Furthermore, the availability of these mobility devices like walkers, knee rollers etc. at tax free rates for disabled end users is likely to propel this market during the forecast period.
Asia Pacific is likely to thrive on the CAGR of 7.5% share in the assisted walking devices market, generating huge revenue.
Emerging trends in assisted walking devices market explains that the growth attributed to proliferating geriatric population count in the Asia Pacific nations, such as China, India, and Japan, the increasing cases of chronic deformities in the present population in this region, the rise in public and private healthcare investments, and the rise in disposable incomes. This gives an overall push to the sales of assisted walking devices.
Assisted walking devices market report explains that the start-up scenario is not untouched from Assisted walking devices. The latest innovations affect the overall market space. The use of a button to get the tints up and down is one of the latest ideas that generate traction for new market players. The latest technology is an addition to the already existing dynamic glass model. Dynamic glass can transition from being transparent to a tinted and back. This technology is slowly landing up on the market surface, increasing the overall demand for Assisted walking devices. Though, these films are expensive and slow, taking more than 20 minutes to fully tint. Manufacturers and startups are working for the improvement of the latest technology.

The assisted walking devices market has various key competitors that focus on expanding their supply chain while expanding the sales channel. The key competitors focus on advancing technology and experimenting with the latest tools to deliver better convenience. This makes the competitive landscape more dynamic and versatile, owing to the expansion of assisted walking devices market size.
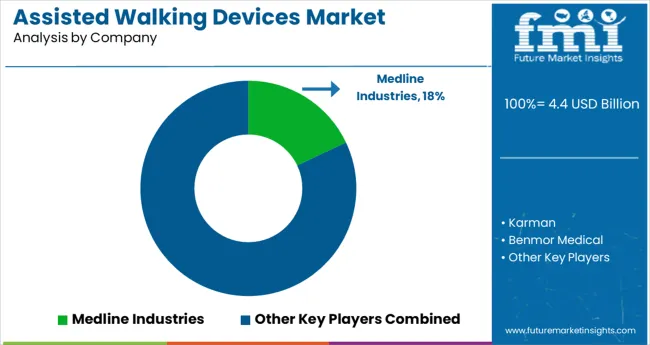
The key players contributing to the growth of Assisted walking devices are Karman; Benmor Medical; Briggs Healthcare; Carex Health Brands; TOPRO; Invacare Corporation; Drive medical design; Eurovema AB; HUMAN CARE
Recent Developments in Global Assisted walking devices Market
The global assisted walking devices market is estimated to be valued at USD 4.4 billion in 2025.
It is projected to reach USD 8.1 billion by 2035.
The market is expected to grow at a 6.4% CAGR between 2025 and 2035.
The key product types are walkers, canes, crutches and gait trainers.
segment is expected to dominate with a 0.0% industry share in 2025.


Our Research Products

The "Full Research Suite" delivers actionable market intel, deep dives on markets or technologies, so clients act faster, cut risk, and unlock growth.

The Leaderboard benchmarks and ranks top vendors, classifying them as Established Leaders, Leading Challengers, or Disruptors & Challengers.

Locates where complements amplify value and substitutes erode it, forecasting net impact by horizon

We deliver granular, decision-grade intel: market sizing, 5-year forecasts, pricing, adoption, usage, revenue, and operational KPIs—plus competitor tracking, regulation, and value chains—across 60 countries broadly.

Spot the shifts before they hit your P&L. We track inflection points, adoption curves, pricing moves, and ecosystem plays to show where demand is heading, why it is changing, and what to do next across high-growth markets and disruptive tech

Real-time reads of user behavior. We track shifting priorities, perceptions of today’s and next-gen services, and provider experience, then pace how fast tech moves from trial to adoption, blending buyer, consumer, and channel inputs with social signals (#WhySwitch, #UX).

Partner with our analyst team to build a custom report designed around your business priorities. From analysing market trends to assessing competitors or crafting bespoke datasets, we tailor insights to your needs.
Supplier Intelligence
Discovery & Profiling
Capacity & Footprint
Performance & Risk
Compliance & Governance
Commercial Readiness
Who Supplies Whom
Scorecards & Shortlists
Playbooks & Docs
Category Intelligence
Definition & Scope
Demand & Use Cases
Cost Drivers
Market Structure
Supply Chain Map
Trade & Policy
Operating Norms
Deliverables
Buyer Intelligence
Account Basics
Spend & Scope
Procurement Model
Vendor Requirements
Terms & Policies
Entry Strategy
Pain Points & Triggers
Outputs
Pricing Analysis
Benchmarks
Trends
Should-Cost
Indexation
Landed Cost
Commercial Terms
Deliverables
Brand Analysis
Positioning & Value Prop
Share & Presence
Customer Evidence
Go-to-Market
Digital & Reputation
Compliance & Trust
KPIs & Gaps
Outputs
Full Research Suite comprises of:
Market outlook & trends analysis
Interviews & case studies
Strategic recommendations
Vendor profiles & capabilities analysis
5-year forecasts
8 regions and 60+ country-level data splits
Market segment data splits
12 months of continuous data updates
DELIVERED AS:
PDF EXCEL ONLINE
Assisted Living Software Market by Deployment, Amenity Type, and Region-Forecast through 2035
AI Assisted Robots Market
Coil Assisted Flow Diverters Market – Growth, Demand & Forecast 2025 to 2035
Laser-Assisted Smart Lathes Market Size and Share Forecast Outlook 2025 to 2035
Robot Assisted Surgical Microscope Market Size and Share Forecast Outlook 2025 to 2035
Robotic Assisted Endovascular Systems Market Size and Share Forecast Outlook 2025 to 2035
Robotics-Assisted Telesurgery Market Size and Share Forecast Outlook 2025 to 2035
Hardware-Assisted Verification Market Size and Share Forecast Outlook 2025 to 2035
Computer Assisted Coding Software Market Analysis by Solution, Deployment, Application, and Region Through 2035
Laparoscopic Robotic-assisted Procedures Market Size and Share Forecast Outlook 2025 to 2035
Walking Aid Market Analysis by Product, Technology, End-user, and Region 2025 to 2035
Bariatric Walking Aids Market Size and Share Forecast Outlook 2025 to 2035
FBAR Devices Market
Snare devices Market
C-Arms Devices Market Size and Share Forecast Outlook 2025 to 2035
Timing Devices Market Analysis - Size, Growth, & Forecast Outlook 2025 to 2035
Spinal Devices Market Size and Share Forecast Outlook 2025 to 2035
Hearing Devices 3D Printing Market Size and Share Forecast Outlook 2025 to 2035
Medical Devices Market Size and Share Forecast Outlook 2025 to 2035
Network Devices Market Size and Share Forecast Outlook 2025 to 2035

Thank you!
You will receive an email from our Business Development Manager. Please be sure to check your SPAM/JUNK folder too.
Chat With
MaRIA