Automated Breast Ultrasound Systems Market Outlook 2025 to 2035

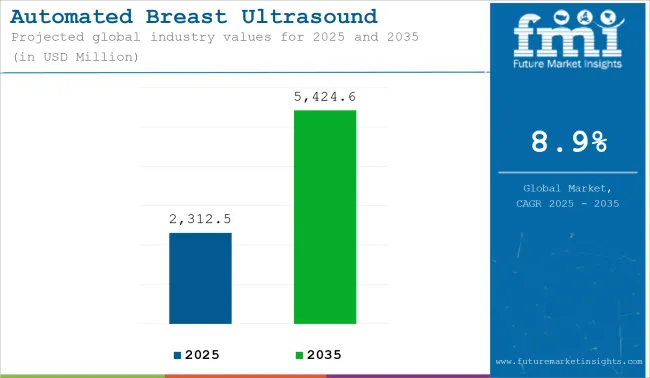
The global automated breast ultrasound systems market is estimated to be valued at USD 2,312.5 million in 2025 and is projected to reach USD 5,424.5 million by 2035, registering a CAGR of 8.9% over the forecast period.
Quick Stats for Automated Breast Ultrasound Systems Market

  • Industry Value (2025): USD 2,312.5 million
  • Forecast Value (2035): USD 5,424.6 million
  • Forecast CAGR: 8.9%
  • Leading Segment in 2025: Automated Breast Ultrasound Systems (ABUS) used in Hospitals
  • Key Growth Region: North America, Asia-Pacific
  • Top Key Players: GE Healthcare, Siemens Healthineers, Hitachi, Ltd, iVu Imaging, Delphinus Medical Technologies, Inc., iSono Health, Inc, SonoCiné

Automated Breast Ultrasound Systems Market Industry Value Analysis

Metric Value
Industry Size (2025E) USD 2,312.5 million
Industry Value (2035F) USD 5,424.6 million
CAGR (2025 to 2035) 8.9%

The automated breast ultrasound systems market has been experiencing steady expansion, driven by increasing breast cancer prevalence and the limitations of conventional mammography in women with dense breast tissue. A notable rise in the adoption of supplemental imaging modalities to improve early detection rates and enhance diagnostic confidence. Healthcare providers are prioritizing capital investments in automated solutions that deliver standardized, reproducible imaging outcomes while reducing operator dependency.

Several regulatory approvals and supportive reimbursement policies in developed markets have further encouraged the integration of automated breast ultrasound systems into routine screening protocols. The combination of demographic trends, awareness campaigns, and supportive clinical guidelines is expected to sustain momentum and open new avenues for commercialization.

Analyzing Automated Breast Ultrasound Systems Market by Top Investment Segments

Automated Breast Ultrasound Systems Dominate the Market with Standardized Imaging and Workflow Efficiencies

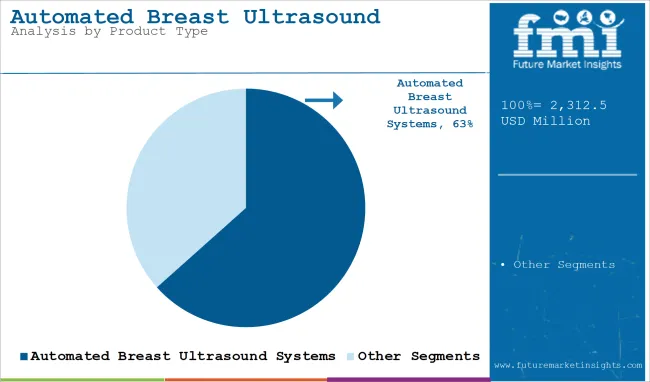
Automated breast ultrasound systems have maintained a leading revenue share of 63.4% in 2025, attributed to their capacity to standardize breast imaging and improve lesion characterization in dense breast tissue. The segment’s expansion has been supported by a growing recognition among clinicians that operator-dependent handheld ultrasound often results in variability of interpretation and incomplete breast coverage.

A significant emphasis has been placed on technological innovations that enhance volumetric image acquisition and automated reconstruction, enabling radiologists to interpret comprehensive datasets with higher confidence. Investments in system ergonomics and integration with PACS have contributed to more efficient workflows and reduced exam times, encouraging broader adoption across both screening and diagnostic settings.

The preference for these systems has been reinforced by their compatibility with established screening pathways, which has created opportunities for cross-modality utilization in hospitals and imaging centers.
Automated Breast Ultrasound Systems Market Analysis By Product Type

Breast Cancer Screening Leads the Market with Emphasis on Early Detection and Supplemental Imaging

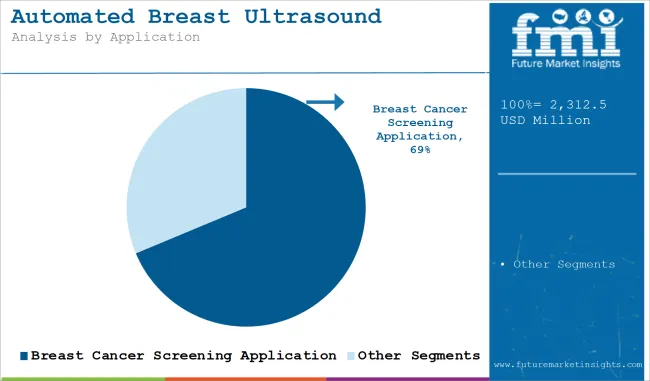
The breast cancer screening application has held a dominant revenue share of 68.7% due to the rising incidence of cancer diagnoses and the clinical necessity to improve detection sensitivity, particularly in women with dense breast composition. A sustained focus has been placed on improving early-stage cancer identification, which has been acknowledged by professional guidelines supporting adjunctive ultrasound screening for high-risk populations.

Government-sponsored awareness initiatives and non-profit advocacy have amplified patient demand for comprehensive screening approaches, driving higher procedure volumes across diagnostic facilities. The segment’s growth has also been reinforced by healthcare systems increasingly recognizing the economic and clinical value of detecting malignancies at earlier, more treatable stages. The inclusion of automated breast ultrasound systems in structured screening programs has created sustained revenue streams, with reimbursement policies in developed markets further incentivizing utilization.
Automated Breast Ultrasound Systems Market Analysis By Application

Hospitals Anchor the Market with Integrated Breast Health Programs and Investment in Advanced Modalities

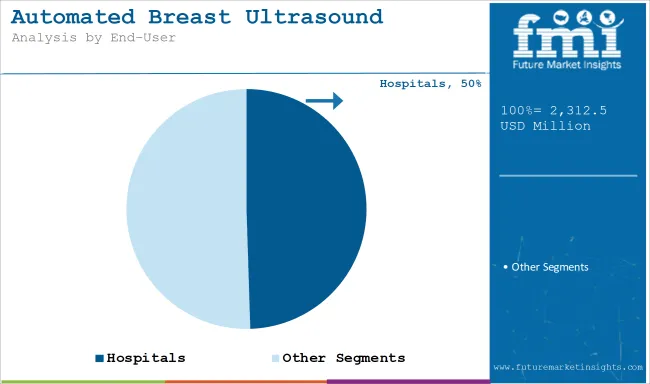
Hospitals have accounted for a 49.5% share of the market, supported by their established infrastructure, capital resources, and multidisciplinary care pathways. Adoption in these settings has been propelled by the integration of automated breast ultrasound into comprehensive breast health programs that combine digital mammography, MRI, and biopsy services. Decision-makers in hospitals have prioritized investments in automated imaging platforms to address increasing patient volumes and reduce diagnostic bottlenecks.

The segment’s expansion has been facilitated by strategic collaborations with technology vendors offering tailored training and service agreements that support long-term operational continuity. In addition, hospitals have benefited from economies of scale in negotiating procurement contracts and securing reimbursement for adjunctive screening procedures. These factors have established hospitals as the leading end-user segment and are expected to sustain their leadership position in the foreseeable future.
Automated Breast Ultrasound Systems Market   Analysis By End User

Challenges and Opportunities

Challenges

Limited Awareness and Training Requirements of Healthcare Workers is Limiting the Product Adoption

One major impediment restraining the Automated Breast Ultrasound Systems (ABUS market is ignorance and the absence of specialization in the training of medical professionals. While ABUS provides standardized and automated imaging, interpreting high-resolution 3D ultrasound images requires skill sets distinct from those used in conventional 2D ultrasound or mammography.

Most radiologists and sonologists are not sufficiently trained to differentiate between benign and malignant lesions on ABUS scans, resulting in some possible misinterpretations with very low diagnostic confidence. This knowledge gap holds back acceptance, as medical professionals most likely would be reluctant to incorporate ABUS into regular breast cancer screening programs.

Besides the limited awareness, the lack of knowledge on the part of physicians and patients is said to be another aspect restricting market growth. Large numbers of general practitioners and gynecologists remain unaware of the benefits of ABUS for dense breast tissue screening, and so continue to rely solely on mammography.

Patients, too, lack knowledge about other options for breast imaging and hence do not demand ABUS-based screening. Factors like these lead to poor consolidation of ABUS technology, especially in developing regions, where there is little training and awareness initiated with respect to ABUS technology. Unless these constraints are addressed through training, awareness campaigns, and collaboration in academics, the full potential of ABUS for breast cancer detection and diagnosis will remain unlocked.

Opportunities

A significant market opportunity for the Automated Breast Ultrasound Systems (ABUS) market lies in its ability to advance early breast cancer detection.

Over time, people have realized that mammography is not compatible with the kind of tissue they might have in their breasts. People, especially women, have become increasingly demanding about what complementary screening technologies should be able to offer. More so, such technology should give a better diagnosis for women who have dense breast tissue and thus may have a higher risk for undetected tumors.

ABUS, among other things, identifies smaller, earlier-stage lesions that could otherwise have been missed, providing earlier intervention and better patient outcomes.

But even increasing ABUS uptake, which surely offers an opportunity for more accurate detection in initial diagnosis, is not all that is possible; it stands to improve diagnosis itself. Adding ABUS into routine screenings would therefore reduce false positives and unnecessary biopsies along the diagnostic pathway.

As more healthcare systems prioritize preventive care and early intervention, ABUS provides an invaluable tool for upgrading screening programs, particularly for high-risk and underserved populations.

Industry-Specific Highlights

The ABUS industry has been experiencing significant growth due to technological advancements and the increasing value placed on patient-centered imaging solutions. An example of this is automated 3D imaging systems, which provide spatially comprehensive views of breast tissue to improve diagnostic accuracy.

Portability and easy-to-use devices in ABUS will also provide wider access to advanced diagnostics in many healthcare settings, be it in underserved or remote areas.

Another emerging trend in this field is the integration of artificial intelligence algorithms to assist in image analysis, thereby reducing the time required to interpret images and increasing confidence in diagnoses. Again, combined with some other imaging modalities such as mammography, overall screening efficiencies have improved, which is a testimony to the broadening application and benefit of such innovations.

Emerging Trends

One of the major trends accelerating the growth of the Automated Breast Ultrasound Systems (ABUS) market is the increasing expansion of regulatory approvals and reimbursement assurance.

Regulatory bodies like the FDA and European CE authorities have been increasingly recognizing the role of ABUS as an adjunctive screening tool that adds to screening for the density of breast tissue, making it acceptable for widespread use. These approvals have encouraged healthcare facilities to adopt ABUS in their regular protocols of screening for breast cancer.

Concurrently, the widening scope of reimbursement policies has rendered ABUS fairly accessible to a wider patient pool. Insurers, in general, have been extending cover for ABUS scans, making it a viable option for patients, especially for the high-risk category of individuals.

This not only encourages healthcare practices to adopt ABUS but also enables the majority of patients to seek early detection for malignant states, leading to improved clinical outcomes. The result of regulatory support, along with reimbursement availability, is allowing the market to grow at a rapid pace.
Country-wise Insights

Automated Breast Ultrasound Systems Market Cagr Analysis By Country

United States

Market Outlook

The market in the USA for Automated Breast Ultrasound Systems (ABUS) is growing rapidly with the increasing incidence of breast cancer and the problems faced by mammogram-based methods in detecting tumors in dense breast tissue.

It is when ABUS is introduced that the images can be as clear of a quality conducive to providing adequate detection rates. The high price and the need for special training are obstacles to mass acceptance.

Market Growth Factors

  • High Incidence of Breast Cancer: An increased number of breast cancer cases indicates the need for more advanced diagnostic tools for early detection.
  • Mammography Limitations: The reason why ABUS is increasingly acquired is that traditional mammograms do not perform well in dense breast tissue and hence are less sensitive.
  • Technological Advances: The continual improvement of ABUS technologies enables the production of better-quality images and accurate diagnoses as they move forward.
  • Regulatory Approvals: FDA approvals of ABUS devices have contributed to increased confidence and market acceptance. Awareness Initiatives: Awareness educational campaigns, informing people about breast cancer screening, may also increase the use of advanced imaging systems.

Market Forecast

Country CAGR (2025 to 2035)
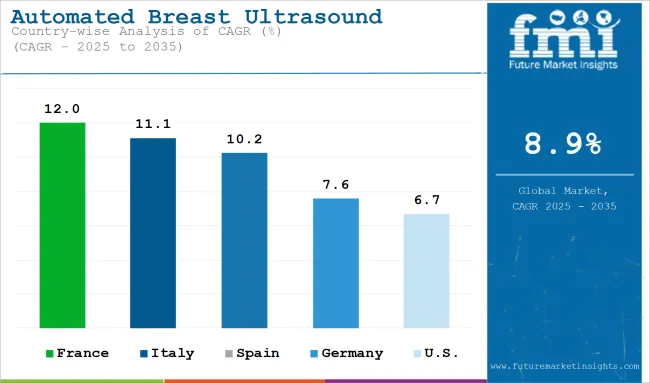
United States 2.8%

Germany

Market Outlook

The expansion of the ABUS market in Germany is greatly supported by a sound healthcare infrastructure and the promotion of the early detection of cancer. The limitations of conventional mammography in the case of women with dense breast tissue have opened a wider space for using the ABUS system, while strong regulatory requirements and exorbitant costs may shadow its growth.

Market Growth Drivers

  • Healthcare Advancement: A well-defined healthcare structure in Germany supports the introduction of technologies such as ABUS into its systems.
  • Government Initiatives: Public health campaigns stressing early detection of cancer encourage the use of advanced imaging technologies.
  • Technological Integration: The integration of ABUS into the diagnostic protocol enhances the accuracy of the screening.
  • Specialized Training Programs: Continuous education is imparted to ensure that healthcare providers are proficient in the use of ABUS technology.
  • Patient Awareness: Awareness among patients on the benefits of advanced breast imaging increases demand.

Market Forecast

Country CAGR (2025 to 2035)
Germany 4.0%

China

Market Outlook

The ABUS market for China is experiencing rapid growth because of increasing incidence rates of breast cancer and the growing awareness of early detection methods. Developments and improvements in economic conditions and the healthcare infrastructure shall contribute to the convenience of access to advanced diagnostic technologies.

However, the disparity in healthcare access for urban and rural residents can hinder market growth.

Market Growth Factors

  • Economic Development: The improvements in healthcare infrastructure along with the increasing patient incomes provide better access to advanced diagnostic technologies.
  • Government Health Policies: Programs promoting preventive care and disease screening initiate market demand.
  • Urbanization: The rising urban population would be expected to enhance its penetration into advanced medical facilities.
  • Technological Advancements: Local manufacturers are introducing low-cost ABUS solutions.
  • Putative Awareness: Increased awareness by women towards the importance of early breast cancer detection increases the demand for ABUS.

Market Forecast

Country CAGR (2025 to 2035)
China 6.1%

India

Market Outlook.

India's ABUS market is on the threshold of growth due to increasing awareness of breast cancer and a growing focus on its early detection. The development of healthcare facilities and rising healthcare expenditure, meanwhile, aid the market's growth. Nevertheless, challenges such as limited resources in rural areas and variations in the quality of healthcare may act as deterrents to growth.

Market Growth Factors

  • Increased Awareness of Breast Cancer: The demand for advanced diagnostic tools is increasing due to educational campaigns.
  • Expansion of Healthcare Infrastructure: The increased number of hospitals and diagnostic centers promotes good access to ABUS technology.
  • Government Health Programs: Initiatives to improve cancer screening and early detection are supportive of market demand.
  • Medical Tourism: Increasingly, India as a destination for medical tourism puts demand on advanced diagnostic procedures.
  • Technological Adoption: The growing acceptance of advanced imaging technologies enhances diagnostic outcomes.

Market Forecast

Country CAGR (2025 to 2035)
India 5.9%

Brazil

Market Outlook

Brazil's ABUS market is experiencing growth, supported by improvements in healthcare infrastructure and increased focus on women's health. The prevalence of breast cancer necessitates the availability of advanced diagnostic technologies. Economic disparities and regional differences in healthcare access may pose challenges to market growth.

Market Growth Factors

  • Development of Healthcare Infrastructure: Investments in medical facilities enhance their ability to develop advanced diagnostic services.
  • Government Health Initiatives: Policies that promote early detection of breast cancer will support market demand.
  • Ageing Population: Higher elderly populations mean more incidences of breast cancer.
  • Private Healthcare Development: Increased private hospitals, as well as clinics, open up access to ABUS technology.
  • Awareness of Advanced Diagnostics Modern: Capacity development training in modern imaging solutions has been taught through an educational campaign.

Market Forecast

Country CAGR (2025 to 2035)
Brazil 5.6%

Competitive Outlook

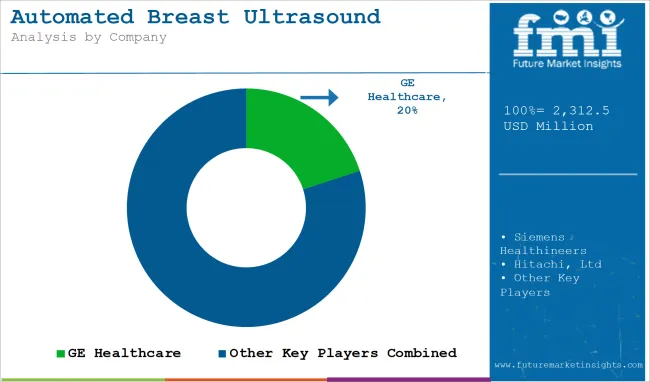
Automated Breast Ultrasound Systems Market Analysis By Company

Key market players in the automated breast ultrasound system market are focusing on installing ABUS in hospitals and diagnostics centers to expand their global footprint. They are also working towards developing the accuracy of automated breast ultrasound systems for faster cancer screening assessment and getting government approval for their products.

Key players are investing heavily in research and development activities to develop essential and improved products. These players are adopting various market methodologies such as mergers, acquisitions, product launches, collaborations, and partnerships. They are distributing their products with local and international suppliers to reach relevant audiences to increase sales volume.

Leading Players in the Market Includes:

  • GE Healthcare
  • Siemens Healthineers
  • Hitachi, Ltd
  • iVu Imaging
  • Delphinus Medical Technologies, Inc.
  • iSono Health, Inc
  • SonoCiné

Key Segments

By Product Type:

  • Automated Breast Ultrasound System (ABUS)
  • Automated Breast Volume Scanner (ABVS)

By Application:

  • Breast Cancer Screening
  • Diagnostic Imaging
  • Preoperative
  • Postoperative Assessment

By End User:

  • Hospitals
  • Diagnostic Imaging Centers
  • Specialty Clinics
  • Research Institutes

By Region:

  • North America
  • Latin America
  • Western Europe
  • Eastern Europe
  • East Asia
  • South Asia and Pacific
  • Middle East and Africa

Table of Content

  1. Executive Summary
  2. Industry Introduction, including Taxonomy and Market Definition
  3. Market Trends and Success Factors, including Macro-Economic Factors, Market Dynamics, and Recent Industry Developments
  4. Global Market Demand (Value in USD) and Volume (Units) Analysis 2020 to 2024 and Forecast 2025 to 2035, including Historical Analysis and Future Projections
  5. Global Market - Pricing Analysis
  6. Global Market Analysis 2020 to 2024 and Forecast 2025 to 2035
    • By Product Type
    • By Application
    • By End User
    • By Region
  7. Global Market Analysis 2020 to 2024 and Forecast 2025 to 2035, By Product Type
    • Automated Breast Ultrasound System (ABUS)
    • Automated Breast Volume Scanner (ABVS)
  8. Global Market Analysis 2020 to 2024 and Forecast 2025 to 2035, By Application
    • Breast Cancer Screening
    • Diagnostic Imaging
    • Preoperative and Postoperative Assessment
  9. Global Market Analysis 2020 to 2024 and Forecast 2025 to 2035, By End User
    • Hospitals
    • Diagnostic Imaging Centers
    • Specialty Clinics
    • Research Institutes
  10. Global Market Analysis 2020 to 2024 and Forecast 2025 to 2035, By Region
    • North America
    • Latin America
    • Western Europe
    • Eastern Europe
    • South Asia & Pacific
    • East Asia
    • Middle East & Africa
  11. North America Sales Analysis 2020 to 2024 and Forecast 2025 to 2035, by Key Segments and Countries
  12. Latin America Sales Analysis 2020 to 2024 and Forecast 2025 to 2035, by Key Segments and Countries
  13. Western Europe Sales Analysis 2020 to 2024 and Forecast 2025 to 2035, by Key Segments and Countries
  14. Eastern Europe Sales Analysis 2020 to 2024 and Forecast 2025 to 2035, by Key Segments and Countries
  15. South Asia & Pacific Sales Analysis 2020 to 2024 and Forecast 2025 to 2035, by Key Segments and Countries
  16. East Asia Sales Analysis 2020 to 2024 and Forecast 2025 to 2035, by Key Segments and Countries
  17. Middle East and Africa Sales Analysis 2020 to 2024 and Forecast 2025 to 2035, by Key Segments and Countries
  18. Sales Forecast 2025 to 2035 By Product Type, By Application and by End User for 30 Countries
  19. Competition Outlook, including Market Structure Analysis, Company Share Analysis by Key Players, and Competition Dashboard
  20. Company Profile
    • GE Healthcare
    • Siemens Healthineers
    • Hologic, Inc.
    • Canon Medical Systems
    • Hitachi Ltd.
    • Delphinus Medical Technologies, Inc.
    • Others

List of Tables

  • Table 1: Global Market Value (USD Million) Forecast by Region, 2020 to 2035
  • Table 2: Global Market Volume (Units) Forecast by Region, 2020 to 2035
  • Table 3: Global Market Value (USD Million) Forecast by Product, 2020 to 2035
  • Table 4: Global Market Volume (Units) Forecast by Product, 2020 to 2035
  • Table 5: Global Market Value (USD Million) Forecast by End User, 2020 to 2035
  • Table 6: Global Market Volume (Units) Forecast by End User, 2020 to 2035
  • Table 7: North America Market Value (USD Million) Forecast by Country, 2020 to 2035
  • Table 8: North America Market Volume (Units) Forecast by Country, 2020 to 2035
  • Table 9: North America Market Value (USD Million) Forecast by Product, 2020 to 2035
  • Table 10: North America Market Volume (Units) Forecast by Product, 2020 to 2035
  • Table 11: North America Market Value (USD Million) Forecast by End User, 2020 to 2035
  • Table 12: North America Market Volume (Units) Forecast by End User, 2020 to 2035
  • Table 13: Latin America Market Value (USD Million) Forecast by Country, 2020 to 2035
  • Table 14: Latin America Market Volume (Units) Forecast by Country, 2020 to 2035
  • Table 15: Latin America Market Value (USD Million) Forecast by Product, 2020 to 2035
  • Table 16: Latin America Market Volume (Units) Forecast by Product, 2020 to 2035
  • Table 17: Latin America Market Value (USD Million) Forecast by End User, 2020 to 2035
  • Table 18: Latin America Market Volume (Units) Forecast by End User, 2020 to 2035
  • Table 19: Europe Market Value (USD Million) Forecast by Country, 2020 to 2035
  • Table 20: Europe Market Volume (Units) Forecast by Country, 2020 to 2035
  • Table 21: Europe Market Value (USD Million) Forecast by Product, 2020 to 2035
  • Table 22: Europe Market Volume (Units) Forecast by Product, 2020 to 2035
  • Table 23: Europe Market Value (USD Million) Forecast by End User, 2020 to 2035
  • Table 24: Europe Market Volume (Units) Forecast by End User, 2020 to 2035
  • Table 25: Asia Pacific Market Value (USD Million) Forecast by Country, 2020 to 2035
  • Table 26: Asia Pacific Market Volume (Units) Forecast by Country, 2020 to 2035
  • Table 27: Asia Pacific Market Value (USD Million) Forecast by Product, 2020 to 2035
  • Table 28: Asia Pacific Market Volume (Units) Forecast by Product, 2020 to 2035
  • Table 29: Asia Pacific Market Value (USD Million) Forecast by End User, 2020 to 2035
  • Table 30: Asia Pacific Market Volume (Units) Forecast by End User, 2020 to 2035
  • Table 31: MEA Market Value (USD Million) Forecast by Country, 2020 to 2035
  • Table 32: MEA Market Volume (Units) Forecast by Country, 2020 to 2035
  • Table 33: MEA Market Value (USD Million) Forecast by Product, 2020 to 2035
  • Table 34: MEA Market Volume (Units) Forecast by Product, 2020 to 2035
  • Table 35: MEA Market Value (USD Million) Forecast by End User, 2020 to 2035
  • Table 36: MEA Market Volume (Units) Forecast by End User, 2020 to 2035

List of Figures

  • Figure 1: Global Market Value (USD Million) by Product, 2025 to 2035
  • Figure 2: Global Market Value (USD Million) by End User, 2025 to 2035
  • Figure 3: Global Market Value (USD Million) by Region, 2025 to 2035
  • Figure 4: Global Market Value (USD Million) Analysis by Region, 2020 to 2035
  • Figure 5: Global Market Volume (Units) Analysis by Region, 2020 to 2035
  • Figure 6: Global Market Value Share (%) and BPS Analysis by Region, 2025 to 2035
  • Figure 7: Global Market Y-o-Y Growth (%) Projections by Region, 2025 to 2035
  • Figure 8: Global Market Value (USD Million) Analysis by Product, 2020 to 2035
  • Figure 9: Global Market Volume (Units) Analysis by Product, 2020 to 2035
  • Figure 10: Global Market Value Share (%) and BPS Analysis by Product, 2025 to 2035
  • Figure 11: Global Market Y-o-Y Growth (%) Projections by Product, 2025 to 2035
  • Figure 12: Global Market Value (USD Million) Analysis by End User, 2020 to 2035
  • Figure 13: Global Market Volume (Units) Analysis by End User, 2020 to 2035
  • Figure 14: Global Market Value Share (%) and BPS Analysis by End User, 2025 to 2035
  • Figure 15: Global Market Y-o-Y Growth (%) Projections by End User, 2025 to 2035
  • Figure 16: Global Market Attractiveness by Product, 2025 to 2035
  • Figure 17: Global Market Attractiveness by End User, 2025 to 2035
  • Figure 18: Global Market Attractiveness by Region, 2025 to 2035
  • Figure 19: North America Market Value (USD Million) by Product, 2025 to 2035
  • Figure 20: North America Market Value (USD Million) by End User, 2025 to 2035
  • Figure 21: North America Market Value (USD Million) by Country, 2025 to 2035
  • Figure 22: North America Market Value (USD Million) Analysis by Country, 2020 to 2035
  • Figure 23: North America Market Volume (Units) Analysis by Country, 2020 to 2035
  • Figure 24: North America Market Value Share (%) and BPS Analysis by Country, 2025 to 2035
  • Figure 25: North America Market Y-o-Y Growth (%) Projections by Country, 2025 to 2035
  • Figure 26: North America Market Value (USD Million) Analysis by Product, 2020 to 2035
  • Figure 27: North America Market Volume (Units) Analysis by Product, 2020 to 2035
  • Figure 28: North America Market Value Share (%) and BPS Analysis by Product, 2025 to 2035
  • Figure 29: North America Market Y-o-Y Growth (%) Projections by Product, 2025 to 2035
  • Figure 30: North America Market Value (USD Million) Analysis by End User, 2020 to 2035
  • Figure 31: North America Market Volume (Units) Analysis by End User, 2020 to 2035
  • Figure 32: North America Market Value Share (%) and BPS Analysis by End User, 2025 to 2035
  • Figure 33: North America Market Y-o-Y Growth (%) Projections by End User, 2025 to 2035
  • Figure 34: North America Market Attractiveness by Product, 2025 to 2035
  • Figure 35: North America Market Attractiveness by End User, 2025 to 2035
  • Figure 36: North America Market Attractiveness by Country, 2025 to 2035
  • Figure 37: Latin America Market Value (USD Million) by Product, 2025 to 2035
  • Figure 38: Latin America Market Value (USD Million) by End User, 2025 to 2035
  • Figure 39: Latin America Market Value (USD Million) by Country, 2025 to 2035
  • Figure 40: Latin America Market Value (USD Million) Analysis by Country, 2020 to 2035
  • Figure 41: Latin America Market Volume (Units) Analysis by Country, 2020 to 2035
  • Figure 42: Latin America Market Value Share (%) and BPS Analysis by Country, 2025 to 2035
  • Figure 43: Latin America Market Y-o-Y Growth (%) Projections by Country, 2025 to 2035
  • Figure 44: Latin America Market Value (USD Million) Analysis by Product, 2020 to 2035
  • Figure 45: Latin America Market Volume (Units) Analysis by Product, 2020 to 2035
  • Figure 46: Latin America Market Value Share (%) and BPS Analysis by Product, 2025 to 2035
  • Figure 47: Latin America Market Y-o-Y Growth (%) Projections by Product, 2025 to 2035
  • Figure 48: Latin America Market Value (USD Million) Analysis by End User, 2020 to 2035
  • Figure 49: Latin America Market Volume (Units) Analysis by End User, 2020 to 2035
  • Figure 50: Latin America Market Value Share (%) and BPS Analysis by End User, 2025 to 2035
  • Figure 51: Latin America Market Y-o-Y Growth (%) Projections by End User, 2025 to 2035
  • Figure 52: Latin America Market Attractiveness by Product, 2025 to 2035
  • Figure 53: Latin America Market Attractiveness by End User, 2025 to 2035
  • Figure 54: Latin America Market Attractiveness by Country, 2025 to 2035
  • Figure 55: Europe Market Value (USD Million) by Product, 2025 to 2035
  • Figure 56: Europe Market Value (USD Million) by End User, 2025 to 2035
  • Figure 57: Europe Market Value (USD Million) by Country, 2025 to 2035
  • Figure 58: Europe Market Value (USD Million) Analysis by Country, 2020 to 2035
  • Figure 59: Europe Market Volume (Units) Analysis by Country, 2020 to 2035
  • Figure 60: Europe Market Value Share (%) and BPS Analysis by Country, 2025 to 2035
  • Figure 61: Europe Market Y-o-Y Growth (%) Projections by Country, 2025 to 2035
  • Figure 62: Europe Market Value (USD Million) Analysis by Product, 2020 to 2035
  • Figure 63: Europe Market Volume (Units) Analysis by Product, 2020 to 2035
  • Figure 64: Europe Market Value Share (%) and BPS Analysis by Product, 2025 to 2035
  • Figure 65: Europe Market Y-o-Y Growth (%) Projections by Product, 2025 to 2035
  • Figure 66: Europe Market Value (USD Million) Analysis by End User, 2020 to 2035
  • Figure 67: Europe Market Volume (Units) Analysis by End User, 2020 to 2035
  • Figure 68: Europe Market Value Share (%) and BPS Analysis by End User, 2025 to 2035
  • Figure 69: Europe Market Y-o-Y Growth (%) Projections by End User, 2025 to 2035
  • Figure 70: Europe Market Attractiveness by Product, 2025 to 2035
  • Figure 71: Europe Market Attractiveness by End User, 2025 to 2035
  • Figure 72: Europe Market Attractiveness by Country, 2025 to 2035
  • Figure 73: Asia Pacific Market Value (USD Million) by Product, 2025 to 2035
  • Figure 74: Asia Pacific Market Value (USD Million) by End User, 2025 to 2035
  • Figure 75: Asia Pacific Market Value (USD Million) by Country, 2025 to 2035
  • Figure 76: Asia Pacific Market Value (USD Million) Analysis by Country, 2020 to 2035
  • Figure 77: Asia Pacific Market Volume (Units) Analysis by Country, 2020 to 2035
  • Figure 78: Asia Pacific Market Value Share (%) and BPS Analysis by Country, 2025 to 2035
  • Figure 79: Asia Pacific Market Y-o-Y Growth (%) Projections by Country, 2025 to 2035
  • Figure 80: Asia Pacific Market Value (USD Million) Analysis by Product, 2020 to 2035
  • Figure 81: Asia Pacific Market Volume (Units) Analysis by Product, 2020 to 2035
  • Figure 82: Asia Pacific Market Value Share (%) and BPS Analysis by Product, 2025 to 2035
  • Figure 83: Asia Pacific Market Y-o-Y Growth (%) Projections by Product, 2025 to 2035
  • Figure 84: Asia Pacific Market Value (USD Million) Analysis by End User, 2020 to 2035
  • Figure 85: Asia Pacific Market Volume (Units) Analysis by End User, 2020 to 2035
  • Figure 86: Asia Pacific Market Value Share (%) and BPS Analysis by End User, 2025 to 2035
  • Figure 87: Asia Pacific Market Y-o-Y Growth (%) Projections by End User, 2025 to 2035
  • Figure 88: Asia Pacific Market Attractiveness by Product, 2025 to 2035
  • Figure 89: Asia Pacific Market Attractiveness by End User, 2025 to 2035
  • Figure 90: Asia Pacific Market Attractiveness by Country, 2025 to 2035
  • Figure 91: MEA Market Value (USD Million) by Product, 2025 to 2035
  • Figure 92: MEA Market Value (USD Million) by End User, 2025 to 2035
  • Figure 93: MEA Market Value (USD Million) by Country, 2025 to 2035
  • Figure 94: MEA Market Value (USD Million) Analysis by Country, 2020 to 2035
  • Figure 95: MEA Market Volume (Units) Analysis by Country, 2020 to 2035
  • Figure 96: MEA Market Value Share (%) and BPS Analysis by Country, 2025 to 2035
  • Figure 97: MEA Market Y-o-Y Growth (%) Projections by Country, 2025 to 2035
  • Figure 98: MEA Market Value (USD Million) Analysis by Product, 2020 to 2035
  • Figure 99: MEA Market Volume (Units) Analysis by Product, 2020 to 2035
  • Figure 100: MEA Market Value Share (%) and BPS Analysis by Product, 2025 to 2035
  • Figure 101: MEA Market Y-o-Y Growth (%) Projections by Product, 2025 to 2035
  • Figure 102: MEA Market Value (USD Million) Analysis by End User, 2020 to 2035
  • Figure 103: MEA Market Volume (Units) Analysis by End User, 2020 to 2035
  • Figure 104: MEA Market Value Share (%) and BPS Analysis by End User, 2025 to 2035
  • Figure 105: MEA Market Y-o-Y Growth (%) Projections by End User, 2025 to 2035
  • Figure 106: MEA Market Attractiveness by Product, 2025 to 2035
  • Figure 107: MEA Market Attractiveness by End User, 2025 to 2035
  • Figure 108: MEA Market Attractiveness by Country, 2025 to 2035

Frequently Asked Questions

What is the future of global Automated Breast Ultrasound Systems industry?

The global Automated Breast Ultrasound Systems industry is projected to witness CAGR of 8.9% between 2025 and 2035.

What was the worth of the global Automated Breast Ultrasound Systems industry in 2024?

The global Automated Breast Ultrasound Systems industry stood at USD 2,123.6 million in 2024.

What will the worth of global Automated Breast Ultrasound Systems industry by 2035 end?

The global rare neurological disease treatment industry is anticipated to reach USD 5,424.5 million by 2035 end.

What is the expected CAGR for China during forecast period?

China is expected to show a CAGR of 6.1% in the assessment period.

Who are the key manufacturer of global Automated Breast Ultrasound Systems industry?

The key players operating in the global automated breast ultrasound systems industry are GE Healthcare, Siemens Healthineers, Hologic, Inc., Canon Medical Systems, Hitachi Ltd., Delphinus Medical Technologies, Inc. and others.

Explore Similar Insights

Future Market Insights

Automated Breast Ultrasound Systems Market