

- Market Size (2026)
- USD 374.0 Mn
- Forecast (2036)
- USD 970.1 Mn
- CAGR (2026 to 2036)
- 10.0%
How big is the Beauty Cereal Products Market in 2026?
USD 374.0 million in 2026 and USD 970.1 million by 2036 at a 10.0% CAGR.
Demand for beauty cereal products exists because buyers need the product to perform inside a real operating workflow, beyond a trend label. FDA food labeling and Human Foods Program references place compliance or claim evidence close to launch decisions, while FAO and WHO food-safety resources keep quality and safety expectations visible. USDA ERS, Codex Alimentarius and Eurostat food data add the country and standards context that procurement teams use when they compare suppliers, so beauty cereal products suppliers need documented performance before accounts scale.
The commercial opportunity is clearest where beauty cereal products reduces a specific pain point for brand teams, category managers and co-manufacturers. Accounts are expected to compare SKU economics, supplier service and proof of claim wording, serving-size math, sensory performance and shelf-life control before volume moves from trial runs to recurring purchase orders.
Country demand will not develop evenly. India shows the higher CAGR reference in the model, while Rest of World remains an important value pool because larger buyers ask for stricter evidence before switching formats, materials or suppliers.
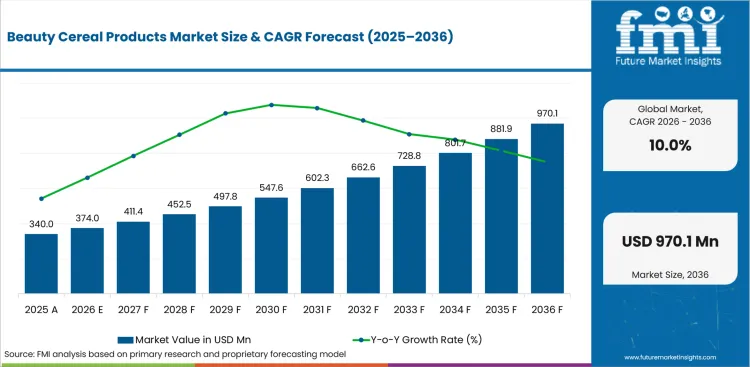
| Metric | Value |
|---|---|
| 2025 Market Size | USD 340.0 million |
| 2026 Market Size | USD 374.0 million |
| 2036 Market Size | USD 970.1 million |
| Forecast CAGR (2026-2036) | 10.0% |
| Leading Distribution Channel | Supermarkets/Hypermarkets |
| Supermarkets/Hypermarkets Share (2026) | 37.5% |
| Leading Benefit | Skin Health |
| Skin Health Share (2026) | 30.9% |
| Leading Product Type | Cereal Cups |
| Cereal Cups Share (2026) | 36.1% |
| Fastest-growing Country | India |
| India CAGR by 2036 | 9.0% |
Summary of the Beauty Cereal Products Market
| Market Signal | Commercial Impact |
|---|---|
| Demand and Growth Drivers |
|
| Product and Segment View |
|
| Geography and Growth Outlook |
|
| Competition |
|
| Analyst Perspective |
|
How is the beauty cereal products market segmented?
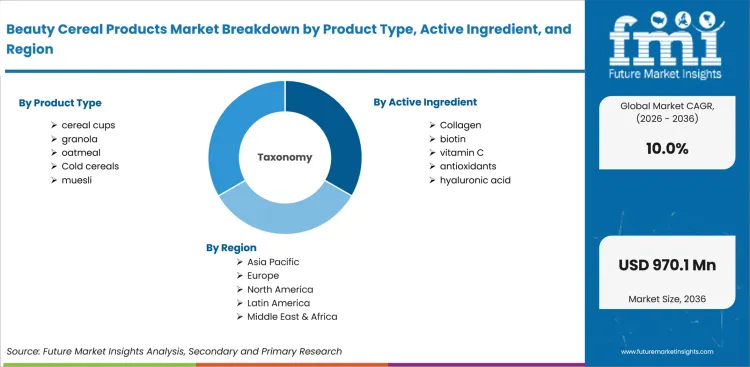
The beauty cereal products market industry is segmented by Product Type, Active Ingredient, Benefit, Distribution Channel and Region.
By Product Type, the market covers Cold cereals, granola, oatmeal, cereal cups and muesli By Active Ingredient, the market covers Collagen, biotin, vitamin C, antioxidants and hyaluronic acid By Benefit, the market covers Skin health, hair & nails, glow, anti-aging and wellness By Distribution Channel, the market covers Supermarkets/hypermarkets, convenience stores, drug stores/pharmacies, e-commerce and specialty retail By Region, the market covers North America, Europe, East Asia, South Asia and Latin America. Regional coverage includes North America, Latin America, Europe, East Asia, South Asia and Pacific, and Middle East and Africa.
How does cereal cups shape demand within the product type category?
cereal cups selection starts with the operating job the buyer needs beauty cereal products to perform. The category is reviewed through claim wording, serving-size math, sensory performance and shelf-life control, so technical proof matters before procurement compares price.
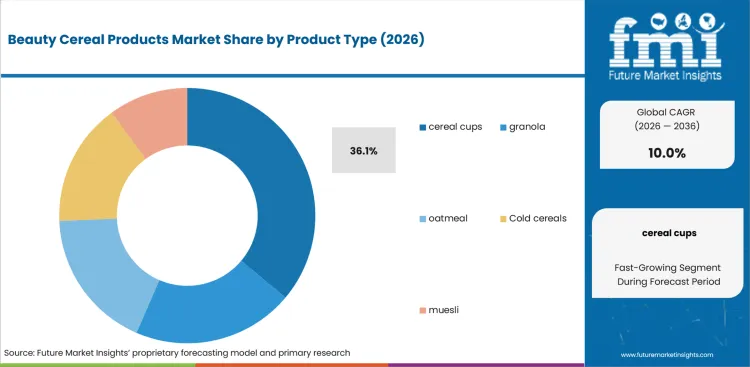
- By Product Type, cereal cups is estimated to hold 36.1% share in 2026. FDA food labeling and Human Foods Program references and FAO and WHO food-safety resources keep beauty cereal products formulation and label-claim review visible in buyer reviews.
- The executive implication is practical: cereal cups links the product promise to taste, texture and label review for beauty cereal products. Suppliers that can show evidence for that point face fewer objections during account expansion.
What supports Collagen purchasing within active ingredient?
Collagen selection starts with the operating job the buyer needs beauty cereal products to perform. The category is reviewed through claim wording, serving-size math, sensory performance and shelf-life control, so technical proof matters before procurement compares price.
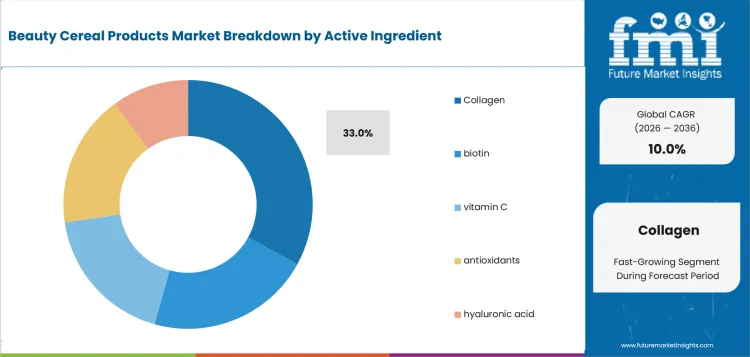
- By Active Ingredient, Collagen is estimated to hold 33.0% share in 2026. FDA food labeling and Human Foods Program references and FAO and WHO food-safety resources keep beauty cereal products formulation and label-claim review visible in buyer reviews.
- The executive implication is practical: Collagen links the product promise to taste, texture and label review for beauty cereal products. Suppliers that can show evidence for that point face fewer objections during account expansion.
Where does Skin health fit in the benefit mix?
Skin health selection starts with the operating job the buyer needs beauty cereal products to perform. The category is reviewed through claim wording, serving-size math, sensory performance and shelf-life control, so technical proof matters before procurement compares price.
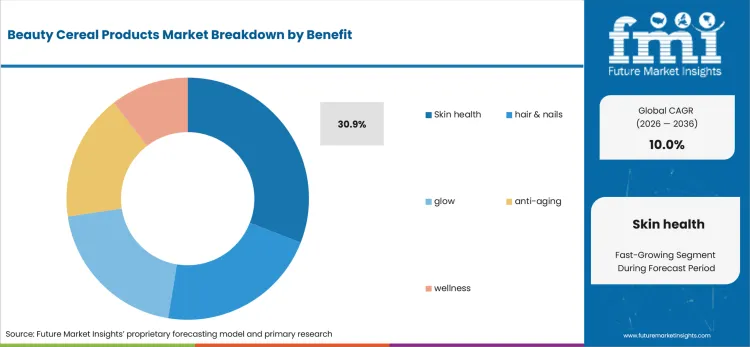
- By Benefit, Skin health is estimated to hold 30.9% share in 2026. FDA food labeling and Human Foods Program references and FAO and WHO food-safety resources keep beauty cereal products formulation and label-claim review visible in buyer reviews.
- The executive implication is practical: Skin health links the product promise to taste, texture and label review for beauty cereal products. Suppliers that can show evidence for that point face fewer objections during account expansion.
Why is Supermarkets/hypermarkets important to buyer screening in distribution channel?
Supermarkets/hypermarkets selection starts with the operating job the buyer needs beauty cereal products to perform. The category is reviewed through claim wording, serving-size math, sensory performance and shelf-life control, so technical proof matters before procurement compares price.
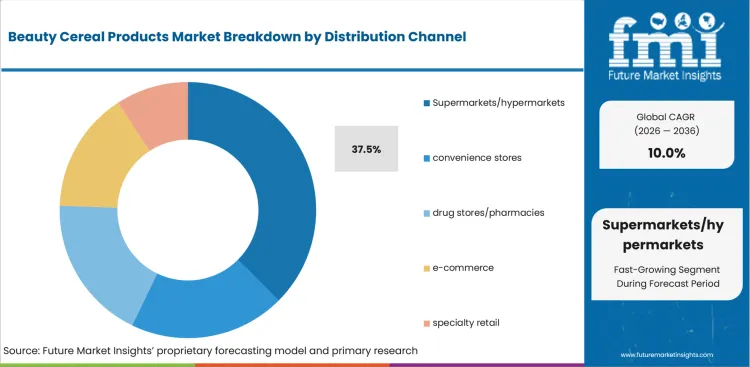
- By Distribution Channel, Supermarkets/hypermarkets is estimated to hold 37.5% share in 2026. FDA food labeling and Human Foods Program references and FAO and WHO food-safety resources keep beauty cereal products formulation and label-claim review visible in buyer reviews.
- The executive implication is practical: Supermarkets/hypermarkets controls trial frequency and price visibility for beauty cereal products. Suppliers that can show evidence for that point face fewer objections during account expansion.
How is North America positioned within region?
North America selection starts with the operating job the buyer needs beauty cereal products to perform. The category is reviewed through claim wording, serving-size math, sensory performance and shelf-life control, so technical proof matters before procurement compares price.
- By Region, North America is estimated to hold 34.2% share in 2026. FDA food labeling and Human Foods Program references and FAO and WHO food-safety resources keep beauty cereal products formulation and label-claim review visible in buyer reviews.
- The executive implication is practical: North America stays close to premium retailers, regulated accounts and early specification work for beauty cereal products. Suppliers that can show evidence for that point face fewer objections during account expansion.
What are the drivers, restraints, and opportunities in the beauty cereal products market?
Near-term purchases are being shaped by the operating requirement, implementation constraint and account-expansion route outlined below.
- Driver: Packaged food buyers are using beauty cereal products to solve a claim, taste or portion-control problem without losing repeat purchase.
- Restraint: Adoption can stall when beauty cereal products formulas create taste, texture, label-claim or cost trade-offs that retailers cannot defend.
- Opportunity: Suppliers that can prove sensory performance and claim discipline for beauty cereal products have a clearer path into private-label and club-channel programs.
Demand for beauty cereal products is tied to a specific buyer problem: claim wording, serving-size math, sensory performance and shelf-life control. This is why account teams ask for evidence at the SKU, format or application level rather than accepting category growth as proof.
Buyer pressure is strongest where beauty cereal products touches claims, product safety, shipment performance, GMP files or retailer scorecards. FDA food labeling and Human Foods Program references, FAO and WHO food-safety resources and USDA ERS, Codex Alimentarius and Eurostat food data make those checks visible across national and cross-border programs.
Implementation friction sits in the handoff between product teams, quality managers and channel owners. Suppliers that answer questions on specifications, test results and service response before launch discussions move faster through buyer review.
Which country CAGRs are profiled in the beauty cereal products market?
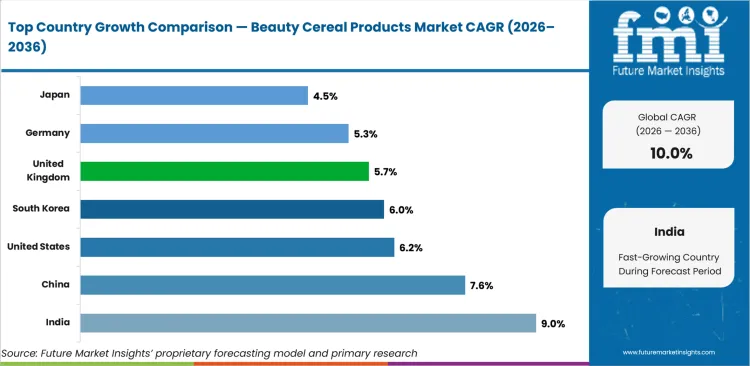
| Country | CAGR |
|---|---|
| United States | 6.2% |
| China | 7.6% |
| India | 9.0% |
| Germany | 5.3% |
| United Kingdom | 5.7% |
| Japan | 4.5% |
| South Korea | 6.0% |
Source: FMI's proprietary forecasting model and primary research.
How do country-level CAGRs compare in the beauty cereal products market?
Country growth should be read as a buying-cycle signal, not a simple ranking. For beauty cereal products, higher CAGR markets usually show faster channel formation or material substitution, while larger 2026 value pools such as Rest of World often require stricter proof before suppliers win recurring accounts.
- United States is projected at 6.2% CAGR through 2036. The country is modeled at USD 101.0 Mn in 2026 and USD 184.3 Mn by 2036. FDA and USDA data keep label and packaged-food review visible. Buyers use national accounts to test beauty cereal products shelf economics before broader rollouts. For beauty cereal products formulation and label-claim review, the United States differs because retailer and regulator-facing reviews come earlier in the launch cycle.
- China is projected at 7.6% CAGR through 2036. The country is modeled at USD 52.4 Mn in 2026 and USD 108.9 Mn by 2036. National statistics and customs signals point to large manufacturing and retail conversion pools. Local suppliers need beauty cereal products formats that can handle high-volume platform and brand programs. For beauty cereal products formulation and label-claim review, China differs because factory scale and platform selling can expose small specification failures quickly.
- India is projected at 9.0% CAGR through 2036. The country is modeled at USD 16.8 Mn in 2026 and USD 39.8 Mn by 2036. FSSAI and official economic data keep packaged-food and supplement channels in focus. Price-tiered buyers need beauty cereal products specifications that work across modern trade, pharmacy or online fulfillment without adding avoidable cost. For beauty cereal products formulation and label-claim review, India differs because affordability and distribution reach decide whether a specification can survive outside metro accounts.
- Germany is projected at 5.3% CAGR through 2036. The country is modeled at USD 29.9 Mn in 2026 and USD 50.1 Mn by 2036. EU and German official data keep quality and compliance review visible. Engineering or category teams review beauty cereal products against EU documentation, material or ingredient files before switching approved suppliers. For beauty cereal products formulation and label-claim review, Germany differs because EU compliance records carry more weight before supplier substitution.
- United Kingdom is projected at 5.7% CAGR through 2036. The country is modeled at USD 24.3 Mn in 2026 and USD 42.3 Mn by 2036. ONS and UK regulator references keep retail-channel and import discipline visible. Retailer scorecards make beauty cereal products availability, pack claims and import continuity part of the buying decision. For beauty cereal products formulation and label-claim review, the United Kingdom differs because importer reliance and retailer scorecards make pack claims and supply assurance visible.
- Japan is projected at 4.5% CAGR through 2036. The country is modeled at USD 26.2 Mn in 2026 and USD 40.7 Mn by 2036. MHLW, METI and official trade indicators keep quality and audit expectations visible. Buyers place more weight on compact formats, consistency checks and low-defect presentation for beauty cereal products. For beauty cereal products formulation and label-claim review, Japan differs because low-defect presentation and compact usage matter more than speed of listing.
- South Korea is projected at 6.0% CAGR through 2036. The country is modeled at USD 22.4 Mn in 2026 and USD 40.2 Mn by 2036. MFDS, MOTIE and Statistics Korea references keep export-oriented product cycles visible. Short product cycles reward suppliers that can adjust beauty cereal products packaging, claims or specifications quickly. For beauty cereal products formulation and label-claim review, South Korea differs because rapid product refresh cycles favor suppliers that shorten sampling and approval loops.
Who are the notable companies in the beauty cereal products market?
Kellanova, WK Kellogg, General Mills, Post Holdings, Nestle, PepsiCo (Quaker), Weetabix and Nature's Path are the notable companies shaping this market.
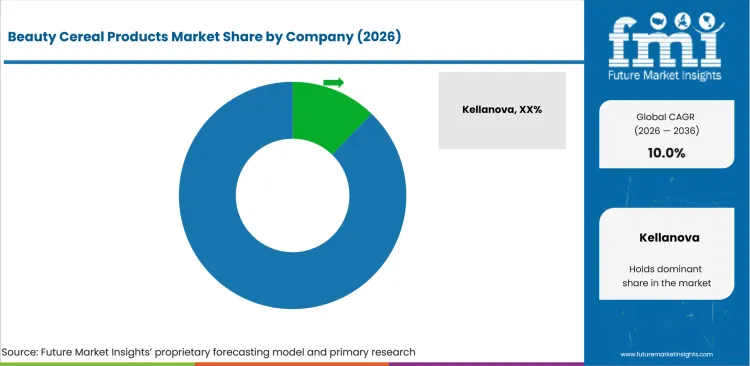
Competition is organized around taste performance, nutrition-claim control, co-manufacturing access and retail execution. Buyers compare suppliers on whether they can translate product claims into repeatable specifications, then support the account after launch.
- Global packaged-food brand owners matter because Kellanova, WK Kellogg and General Mills bring account access, portfolio breadth or specialist support for beauty cereal products. Their role is clearest where buyers want fewer supplier handoffs during qualification, listing or fulfillment review.
- Snack and meal-format manufacturers matter because Post Holdings, Nestle and PepsiCo (Quaker) bring account access, portfolio breadth or specialist support for beauty cereal products. Their role is clearest where buyers want fewer supplier handoffs during qualification, listing or fulfillment review.
- Retail and private-label supply partners matter because Weetabix and Nature's Path bring account access, portfolio breadth or specialist support for beauty cereal products. Their role is clearest where buyers want fewer supplier handoffs during qualification, listing or fulfillment review.
Competitive Benchmarking: Beauty Cereal Products Market
| Company | Portfolio Relevance | Format Fit | Application Support | Service Reach |
|---|---|---|---|---|
| Kellanova | Medium | Medium | High | Global |
| WK Kellogg | Strong | High | Medium | Global |
| General Mills | Medium | Strong | High | Global |
| Post Holdings | Strong | High | Strong | Global |
| Nestle | Strong | Medium | Medium | Multi-region |
| PepsiCo (Quaker) | Medium | Strong | Medium | Multi-region |
| Weetabix | High | Strong | Strong | Multi-region |
| Nature's Path | Strong | Strong | High | Multi-region |
Source: Future Market Insights competitive analysis, 2026. Ratings reflect relative portfolio relevance, workflow or project fit, service capability, and geographic reach.
Key Developments in the Beauty Cereal Products Market
- In 2025, FDA postponed the effective date for its updated healthy nutrient content claim to April 28, 2025. For beauty cereal products, the change keeps nutrient thresholds and front-pack wording close to product renovation decisions.
- In January 2025, FDA proposed a front-of-package Nutrition Info box for most packaged foods. This pushes beauty cereal products brands to check saturated fat, sodium and added-sugar exposure before new shelf placements.
- FDA set January 1, 2028 as the uniform compliance date for final food-labeling regulations published in 2025 and 2026. That timing gives manufacturers a relabeling window for beauty cereal products while packaging, serving and formulation changes are coordinated.
Key Players in the Beauty Cereal Products Market
Global packaged-food brand owners
- Kellanova
- WK Kellogg
- General Mills
Snack and meal-format manufacturers
- Post Holdings
- Nestle
- PepsiCo (Quaker)
Retail and private-label supply partners
- Weetabix
- Nature's Path
Beauty Cereal Products Market - Report Scope
| Coverage field | Report scope |
|---|---|
| Market breakdown | Beauty Cereal Products Market Breakdown By Product Type, Active Ingredient, Benefit, Distribution Channel and Region |
| Market Definition | Beauty Cereal Products products cover packaged food formats positioned around nutrition, portion, digestive or functional eating needs across branded and private-label channels. |
| Regions Covered | North America, Latin America, Europe, East Asia, South Asia and Pacific, and Middle East and Africa |
| Countries Covered | United States, China, India, Germany, United Kingdom, Japan, South Korea, Rest of World and 30+ countries |
| Key Companies Profiled | Kellanova, WK Kellogg, General Mills, Post Holdings, Nestle, PepsiCo (Quaker), Weetabix and Nature's Path |
| Forecast Period | 2026 to 2036 |
| Approach | Hybrid bottom-up and top-down methodology using segment share, country growth, claim wording, serving-size math, sensory performance and shelf-life control, supplier portfolio depth and channel exposure |
Beauty Cereal Products Market - Research Methodology
| Method | Approach |
|---|---|
| Primary Research | Primary interviews covered brand teams, category managers and co-manufacturers, quality teams, suppliers and channel buyers. Discussions focused on claim wording, serving-size math, sensory performance and shelf-life control, price sensitivity, changeover risk and account expansion. |
| Desk Research | Desk research reviewed FDA food labeling and Human Foods Program references, FAO and WHO food-safety resources and USDA ERS, Codex Alimentarius and Eurostat food data along with company portfolio pages and official trade or country datasets. |
| Market Sizing and Forecasting | Market sizing used a hybrid model across segment mix, 2026 country values, forecast CAGR, channel route and supplier participation in beauty cereal products. |
| Data Validation | Data validation compared segment shares, country CAGRs, company relevance and source signals to avoid category leakage and unsupported claims. |
Source: Future Market Insights (FMI) analysis, based on proprietary forecasting model and primary research.
Beauty Cereal Products Market by Segments
Beauty Cereal Products Market segmented by Product Type:
- Cold cereals
- granola
- oatmeal
- cereal cups
- muesli
Beauty Cereal Products Market segmented by Active Ingredient:
- Collagen
- biotin
- vitamin C
- antioxidants
- hyaluronic acid
Beauty Cereal Products Market segmented by Benefit:
- Skin health
- hair & nails
- glow
- anti-aging
- wellness
Beauty Cereal Products Market segmented by Distribution Channel:
- Supermarkets/hypermarkets
- convenience stores
- drug stores/pharmacies
- e-commerce
- specialty retail
Beauty Cereal Products Market segmented by Region:
- North America
- Europe
- East Asia
- South Asia
- Latin America
Research Sources and Bibliography
- USA Food and Drug Administration. Food labeling and Human Foods Program updates.
- Food and Agriculture Organization of the United Nations. FAOSTAT.
- World Health Organization. Food safety and nutrition resources.
- Codex Alimentarius Commission. International food standards.
- Future Market Insights. Proprietary forecasting model and primary research, 2026.
This bibliography is provided for reader reference and uses primary government, standards-body, official trade body and company sources.
This Report Answers
- What value is the beauty cereal products market estimated at in 2026 and forecast to reach by 2036?
- What CAGR is expected for the beauty cereal products market from 2026 to 2036?
- Which segments shape demand across Product Type, Active Ingredient, Benefit, Distribution Channel and Region?
- Which operating pressures support purchase activity among brand teams, category managers and co-manufacturers?
- How do country CAGRs differ across the profiled markets?
- Which companies compete across portfolio relevance, application support and service reach?
- How does FMI validate forecasts using a hybrid bottom-up and top-down approach?
- What factors should category, procurement or engineering teams address before broader account expansion?
- How do claims review, documentation and performance evidence affect supplier selection?
- What limits return on investment for buyers adding beauty cereal products to their portfolio or operation?
Frequently Asked Questions
What is supporting growth in the Beauty Cereal Products Market?
Growth is supported by buyer need for claim wording, serving-size math, sensory performance and shelf-life control. Category teams are using beauty cereal products to solve a defined product, channel or operations problem rather than adding another undifferentiated SKU.
Who are the key players in the Beauty Cereal Products Market?
Key companies include Kellanova, WK Kellogg, General Mills, Post Holdings, Nestle, PepsiCo (Quaker), Weetabix and Nature's Path. Competition is focused on taste performance, nutrition-claim control, co-manufacturing access and retail execution.
What is a restraint in the Beauty Cereal Products Market?
The main restraint is proof burden. Buyers slow down when beauty cereal products lacks specifications, testing records, label support or supplier response needed for account approval.
Why should executives track the Beauty Cereal Products Market?
Executives should track the market because beauty cereal products affects channel access, product claims, quality files, shipment performance or consumer repeat use. Those points influence margin and complaint risk.
What business problem does the Beauty Cereal Products Market address?
The market addresses a practical operating gap: buyers need beauty cereal products formats that perform in the intended use case while fitting current sourcing, packaging, quality and retail workflows.
What should procurement leaders evaluate before selecting suppliers?
Procurement leaders should evaluate specification evidence, scale-up history, service response, price discipline and fit with claim wording, serving-size math, sensory performance and shelf-life control.
What limits return on investment for purchasing teams?
Return on investment weakens when product performance, documentation or channel acceptance is not proven before launch. Rework, relabeling, returns or substitution costs can erase the planned margin gain.
How do suppliers build long-term account confidence?
Suppliers build account confidence by giving buyers clear technical files, stable supply response and category-specific evidence for beauty cereal products.
Preview the report firsthand - request a free sample
Get SampleGet the brochure for pricing and purchase details.
Get PDFTable of Content
- Key Takeaways
- Market Size and CAGR
- Top Growth Driver
- Fastest Growing Segment
- Leading Region
- Key Companies
- Emerging Opportunities
- Executive Summary
- Global Market Outlook
- Demand-side Trends
- Supply-side Trends
- Technology Roadmap Analysis
- Analysis and Recommendations
- Analyst Perspective (What is happening? Why now? What should investors know?)
- Key Questions Answered
- How large is the market?
- What is the CAGR?
- What are key trends?
- Which region dominates?
- Who are the leaders?
- Market Overview
- Market Coverage / Taxonomy
- Market Definition / Scope / Limitations
- Research Methodology
- Chapter Orientation
- Analytical Lens and Working Hypotheses
- Market Structure, Signals, and Trend Drivers
- Benchmarking and Cross-market Comparability
- Market Sizing, Forecasting, and Opportunity Mapping
- Research Design and Evidence Framework
- Desk Research Programme (Secondary Evidence)
- Expert Input and Fieldwork (Primary Evidence)
- Tooling, Models, and Reference Databases
- Data Engineering and Model Build
- Quality Assurance and Audit Trail
- Market Background
- Market Dynamics (Drivers, Restraints, Opportunity, Trends)
- Scenario Forecast (Optimistic, Likely, Conservative)
- Impact Analysis
- AI Impact
- Sustainability Impact
- Regulatory Impact
- Technology Impact
- Consumer / Buyer Analysis
- Purchase Drivers
- Adoption Barriers
- Buyer Journey
- Opportunity Map Analysis
- Product Life Cycle Analysis
- Supply Chain Analysis
- Investment Feasibility Matrix
- Value Chain Analysis
- PESTLE and Porter's Analysis
- Regulatory Landscape
- Regional Parent Market Outlook
- Production and Consumption Statistics
- Import and Export Statistics
- Global Market Analysis and Forecast, 2021 to 2036
- Historical Market Size Value (USD Mn) & Volume (Unit) Analysis, 2021 to 2025
- Current and Future Market Size Value (USD Mn) & Volume (Unit) Projections, 2026 to 2036
- Y-o-Y Growth Trend Analysis
- Absolute $ Opportunity Analysis
- Global Market Pricing Analysis, 2021 to 2036
- Global Market Analysis and Forecast, By Product Type, 2021 to 2036
- Introduction / Key Findings
- Historical Market Size Value (USD Mn) & Volume (Unit) Analysis By Product Type, 2021 to 2025
- Current and Future Market Size Value (USD Mn) & Volume (Unit) Analysis and Forecast By Product Type, 2026 to 2036
- cereal cups
- granola
- oatmeal
- Cold cereals
- muesli
- cereal cups
- Y-o-Y Growth Trend Analysis By Product Type, 2021 to 2025
- Absolute $ Opportunity Analysis By Product Type, 2026 to 2036
- Global Market Analysis and Forecast, By Active Ingredient, 2021 to 2036
- Introduction / Key Findings
- Historical Market Size Value (USD Mn) & Volume (Unit) Analysis By Active Ingredient, 2021 to 2025
- Current and Future Market Size Value (USD Mn) & Volume (Unit) Analysis and Forecast By Active Ingredient, 2026 to 2036
- Collagen
- biotin
- vitamin C
- antioxidants
- hyaluronic acid
- Collagen
- Y-o-Y Growth Trend Analysis By Active Ingredient, 2021 to 2025
- Absolute $ Opportunity Analysis By Active Ingredient, 2026 to 2036
- Global Market Analysis and Forecast, By Benefit, 2021 to 2036
- Introduction / Key Findings
- Historical Market Size Value (USD Mn) & Volume (Unit) Analysis By Benefit, 2021 to 2025
- Current and Future Market Size Value (USD Mn) & Volume (Unit) Analysis and Forecast By Benefit, 2026 to 2036
- Skin health
- hair & nails
- glow
- anti-aging
- wellness
- Skin health
- Y-o-Y Growth Trend Analysis By Benefit, 2021 to 2025
- Absolute $ Opportunity Analysis By Benefit, 2026 to 2036
- Global Market Analysis and Forecast, By Distribution Channel, 2021 to 2036
- Introduction / Key Findings
- Historical Market Size Value (USD Mn) & Volume (Unit) Analysis By Distribution Channel, 2021 to 2025
- Current and Future Market Size Value (USD Mn) & Volume (Unit) Analysis and Forecast By Distribution Channel, 2026 to 2036
- Supermarkets/hypermarkets
- convenience stores
- drug stores/pharmacies
- e-commerce
- specialty retail
- Supermarkets/hypermarkets
- Y-o-Y Growth Trend Analysis By Distribution Channel, 2021 to 2025
- Absolute $ Opportunity Analysis By Distribution Channel, 2026 to 2036
- Global Market Analysis and Forecast, By Region, 2021 to 2036
- Introduction
- Historical Market Size Value (USD Mn) & Volume (Unit) Analysis By Region, 2021 to 2025
- Current Market Size Value (USD Mn) & Volume (Unit) Analysis and Forecast By Region, 2026 to 2036
- North America
- Latin America
- Western Europe
- Eastern Europe
- East Asia
- South Asia and Pacific
- Middle East & Africa
- Market Attractiveness Analysis By Region
- North America Market Analysis and Forecast, By Country, 2021 to 2036
- Historical Market Size Value (USD Mn) & Volume (Unit) Trend Analysis By Market Taxonomy, 2021 to 2025
- Market Size Value (USD Mn) & Volume (Unit) Forecast By Market Taxonomy, 2026 to 2036
- By Country
- USA
- Canada
- Mexico
- By Product Type
- By Active Ingredient
- By Benefit
- By Distribution Channel
- By Country
- Market Attractiveness Analysis
- By Country
- By Product Type
- By Active Ingredient
- By Benefit
- By Distribution Channel
- Key Takeaways
- Latin America Market Analysis and Forecast, By Country
- Historical Market Size Value (USD Mn) & Volume (Unit) Trend Analysis By Market Taxonomy, 2021 to 2025
- Market Size Value (USD Mn) & Volume (Unit) Forecast By Market Taxonomy, 2026 to 2036
- By Country
- Brazil
- Chile
- Rest of Latin America
- By Product Type
- By Active Ingredient
- By Benefit
- By Distribution Channel
- By Country
- Market Attractiveness Analysis
- By Country
- By Product Type
- By Active Ingredient
- By Benefit
- By Distribution Channel
- Key Takeaways
- Western Europe Market Analysis and Forecast, By Country
- Historical Market Size Value (USD Mn) & Volume (Unit) Trend Analysis By Market Taxonomy, 2021 to 2025
- Market Size Value (USD Mn) & Volume (Unit) Forecast By Market Taxonomy, 2026 to 2036
- By Country
- Germany
- UK
- Italy
- Spain
- France
- Nordic
- BENELUX
- Rest of Western Europe
- By Product Type
- By Active Ingredient
- By Benefit
- By Distribution Channel
- By Country
- Market Attractiveness Analysis
- By Country
- By Product Type
- By Active Ingredient
- By Benefit
- By Distribution Channel
- Key Takeaways
- Eastern Europe Market Analysis and Forecast, By Country
- Historical Market Size Value (USD Mn) & Volume (Unit) Trend Analysis By Market Taxonomy, 2021 to 2025
- Market Size Value (USD Mn) & Volume (Unit) Forecast By Market Taxonomy, 2026 to 2036
- By Country
- Russia
- Poland
- Hungary
- Balkan & Baltic
- Rest of Eastern Europe
- By Product Type
- By Active Ingredient
- By Benefit
- By Distribution Channel
- By Country
- Market Attractiveness Analysis
- By Country
- By Product Type
- By Active Ingredient
- By Benefit
- By Distribution Channel
- Key Takeaways
- East Asia Market Analysis and Forecast, By Country
- Historical Market Size Value (USD Mn) & Volume (Unit) Trend Analysis By Market Taxonomy, 2021 to 2025
- Market Size Value (USD Mn) & Volume (Unit) Forecast By Market Taxonomy, 2026 to 2036
- By Country
- China
- Japan
- South Korea
- By Product Type
- By Active Ingredient
- By Benefit
- By Distribution Channel
- By Country
- Market Attractiveness Analysis
- By Country
- By Product Type
- By Active Ingredient
- By Benefit
- By Distribution Channel
- Key Takeaways
- South Asia and Pacific Market Analysis and Forecast, By Country
- Historical Market Size Value (USD Mn) & Volume (Unit) Trend Analysis By Market Taxonomy, 2021 to 2025
- Market Size Value (USD Mn) & Volume (Unit) Forecast By Market Taxonomy, 2026 to 2036
- By Country
- India
- ASEAN
- Australia & New Zealand
- Rest of South Asia and Pacific
- By Product Type
- By Active Ingredient
- By Benefit
- By Distribution Channel
- By Country
- Market Attractiveness Analysis
- By Country
- By Product Type
- By Active Ingredient
- By Benefit
- By Distribution Channel
- Key Takeaways
- Middle East & Africa Market Analysis and Forecast, By Country
- Historical Market Size Value (USD Mn) & Volume (Unit) Trend Analysis By Market Taxonomy, 2021 to 2025
- Market Size Value (USD Mn) & Volume (Unit) Forecast By Market Taxonomy, 2026 to 2036
- By Country
- Kingdom of Saudi Arabia
- Other GCC Countries
- Türkiye
- South Africa
- Other African Union
- Rest of Middle East & Africa
- By Product Type
- By Active Ingredient
- By Benefit
- By Distribution Channel
- By Country
- Market Attractiveness Analysis
- By Country
- By Product Type
- By Active Ingredient
- By Benefit
- By Distribution Channel
- Key Takeaways
- Key Countries Market Analysis
- USA
- Pricing Analysis
- Market Share Analysis, 2025
- By Product Type
- By Active Ingredient
- By Benefit
- By Distribution Channel
- Canada
- Pricing Analysis
- Market Share Analysis, 2025
- By Product Type
- By Active Ingredient
- By Benefit
- By Distribution Channel
- Mexico
- Pricing Analysis
- Market Share Analysis, 2025
- By Product Type
- By Active Ingredient
- By Benefit
- By Distribution Channel
- Brazil
- Pricing Analysis
- Market Share Analysis, 2025
- By Product Type
- By Active Ingredient
- By Benefit
- By Distribution Channel
- Chile
- Pricing Analysis
- Market Share Analysis, 2025
- By Product Type
- By Active Ingredient
- By Benefit
- By Distribution Channel
- Germany
- Pricing Analysis
- Market Share Analysis, 2025
- By Product Type
- By Active Ingredient
- By Benefit
- By Distribution Channel
- UK
- Pricing Analysis
- Market Share Analysis, 2025
- By Product Type
- By Active Ingredient
- By Benefit
- By Distribution Channel
- Italy
- Pricing Analysis
- Market Share Analysis, 2025
- By Product Type
- By Active Ingredient
- By Benefit
- By Distribution Channel
- Spain
- Pricing Analysis
- Market Share Analysis, 2025
- By Product Type
- By Active Ingredient
- By Benefit
- By Distribution Channel
- France
- Pricing Analysis
- Market Share Analysis, 2025
- By Product Type
- By Active Ingredient
- By Benefit
- By Distribution Channel
- India
- Pricing Analysis
- Market Share Analysis, 2025
- By Product Type
- By Active Ingredient
- By Benefit
- By Distribution Channel
- ASEAN
- Pricing Analysis
- Market Share Analysis, 2025
- By Product Type
- By Active Ingredient
- By Benefit
- By Distribution Channel
- Australia & New Zealand
- Pricing Analysis
- Market Share Analysis, 2025
- By Product Type
- By Active Ingredient
- By Benefit
- By Distribution Channel
- China
- Pricing Analysis
- Market Share Analysis, 2025
- By Product Type
- By Active Ingredient
- By Benefit
- By Distribution Channel
- Japan
- Pricing Analysis
- Market Share Analysis, 2025
- By Product Type
- By Active Ingredient
- By Benefit
- By Distribution Channel
- South Korea
- Pricing Analysis
- Market Share Analysis, 2025
- By Product Type
- By Active Ingredient
- By Benefit
- By Distribution Channel
- Russia
- Pricing Analysis
- Market Share Analysis, 2025
- By Product Type
- By Active Ingredient
- By Benefit
- By Distribution Channel
- Poland
- Pricing Analysis
- Market Share Analysis, 2025
- By Product Type
- By Active Ingredient
- By Benefit
- By Distribution Channel
- Hungary
- Pricing Analysis
- Market Share Analysis, 2025
- By Product Type
- By Active Ingredient
- By Benefit
- By Distribution Channel
- Kingdom of Saudi Arabia
- Pricing Analysis
- Market Share Analysis, 2025
- By Product Type
- By Active Ingredient
- By Benefit
- By Distribution Channel
- Türkiye
- Pricing Analysis
- Market Share Analysis, 2025
- By Product Type
- By Active Ingredient
- By Benefit
- By Distribution Channel
- South Africa
- Pricing Analysis
- Market Share Analysis, 2025
- By Product Type
- By Active Ingredient
- By Benefit
- By Distribution Channel
- USA
- Market Structure Analysis
- Competition Dashboard
- Competition Benchmarking
- Market Share Analysis of Top Players
- By Regional
- By Product Type
- By Active Ingredient
- By Benefit
- By Distribution Channel
- Emerging Startups
- Innovation Benchmarking
- Competition Analysis
- Competition Deep Dive
- Kellanova
- Overview
- Product Portfolio
- Profitability by Market Segments (Product/Region/Sales Channel)
- Sales Footprint
- Strategy Overview
- Marketing Strategy
- Product Strategy
- Channel Strategy
- WK Kellogg
- General Mills
- Post Holdings
- Nestle
- PepsiCo (Quaker)
- Weetabix
- Nature's Path
- Kellanova
- Case Studies
- Success Stories
- Recent Developments
- Competition Deep Dive
- Assumptions & Acronyms Used


